
Systems and methods for visualization of single-cell resolution characteristics

a single-cell resolution and characteristic technology, applied in the field of visualizing patterns, can solve problems such as complex sequence datasets

Active Publication Date: 2020-01-02
10X GENOMICS
View PDF3 Cites 46 Cited by
  • Summary
  • Abstract
  • Description
  • Claims
  • Application Information

AI Technical Summary

Benefits of technology

The present patent provides a comprehensive and scalable approach to identify genomic heterogeneity and map clonal evolution by profiling thousands of cells in a single sample. The method allows for the identification of somatic variation and exploration of single cells and groups of cells defined by their mutual similarity. The visualization system provides a user-friendly interface to display and analyze the data. The technical effects of the invention include improved understanding of clonal evolution and the identification of new mutations in cancer genomes.

Problems solved by technology

However, such sequencing datasets are complex and, consequently, tools are needed to allow for a scalable approach to analyzing such datasets in order to determine genomic heterogeneity such as copy number variation, map clonal evolution, and / or identification of somatic variation even in a single cell.

Method used


Image

  • Systems and methods for visualization of single-cell resolution characteristics
  • Systems and methods for visualization of single-cell resolution characteristics
  • Systems and methods for visualization of single-cell resolution characteristics

Examples


example 1

Sequence Reads

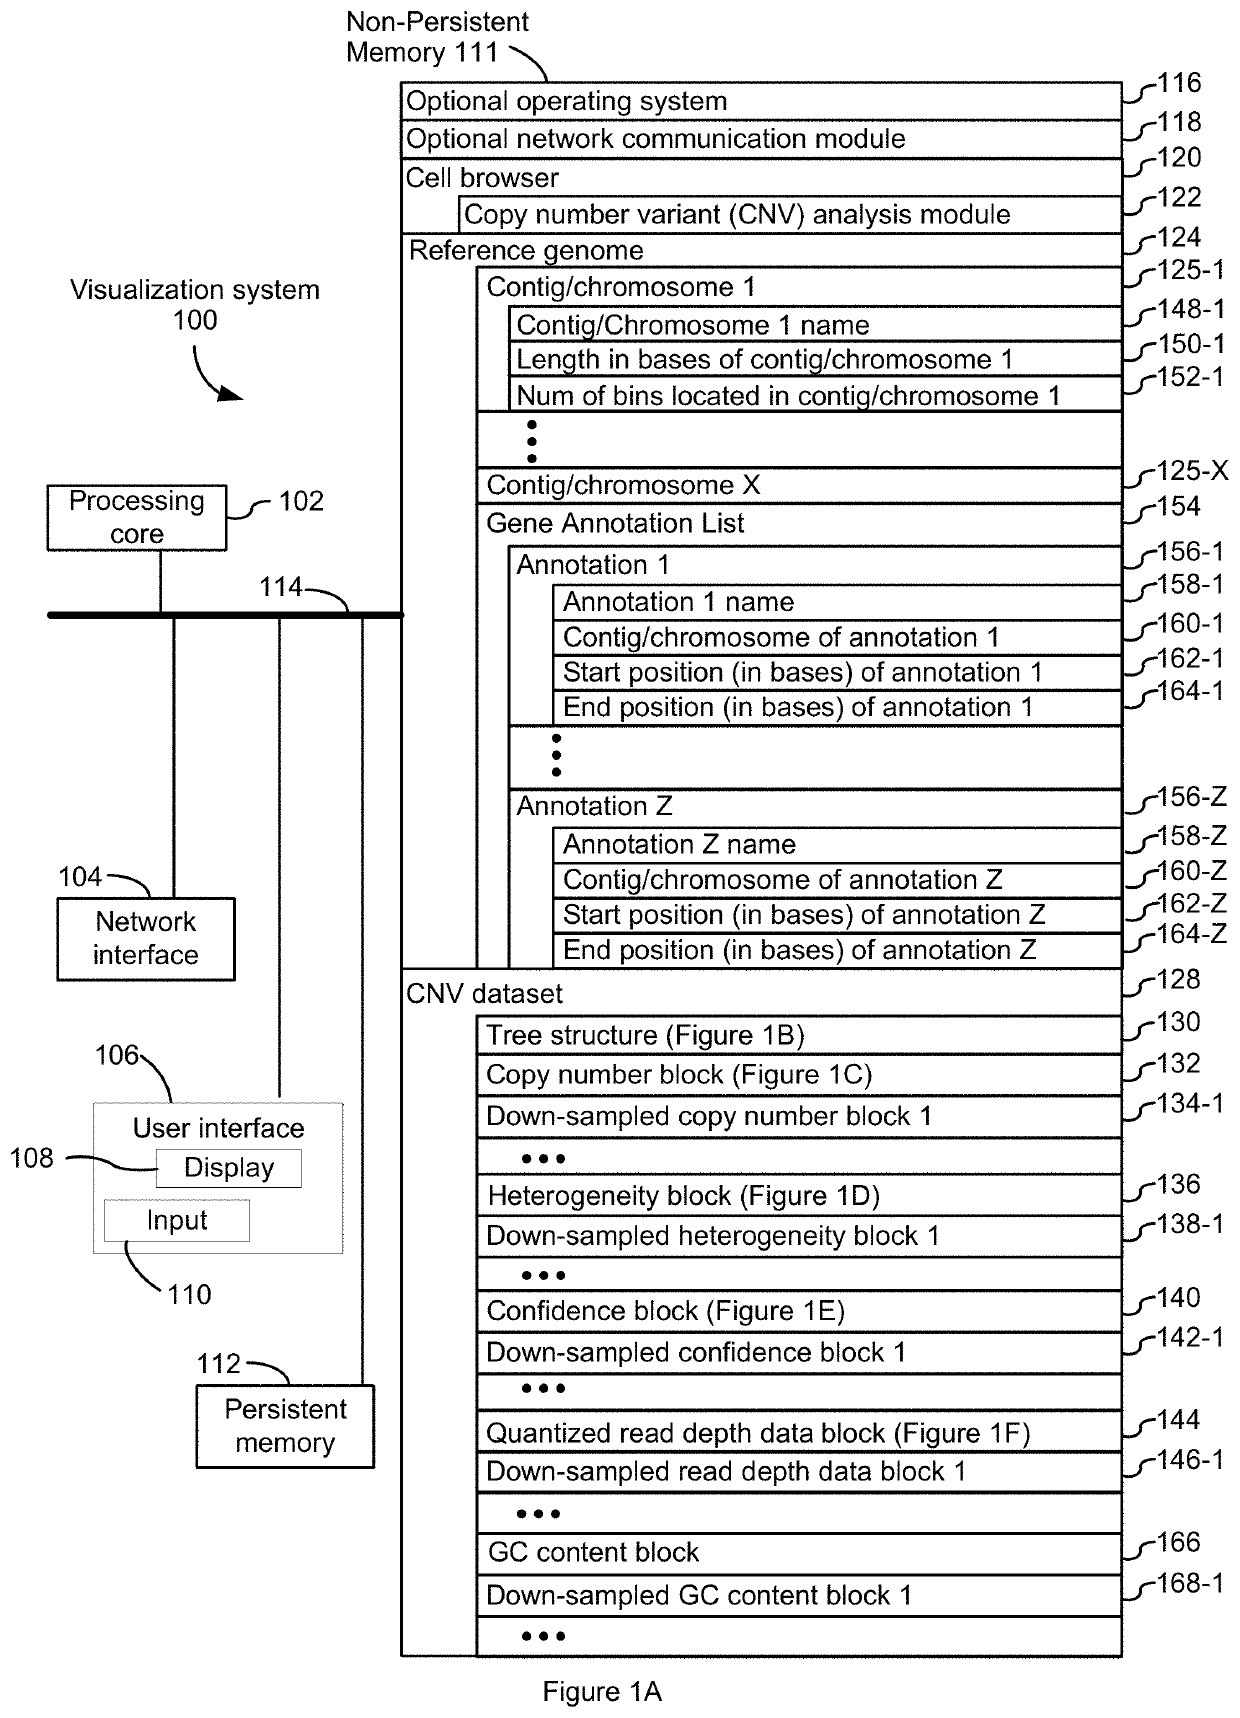
[0112]The analysis module 122 reads and analyzes single cell sequencing datasets 128 in the manner set forth in FIG. 2 and described above. This example provides non-limiting examples of how such single cell sequencing datasets 128 are acquired and how they are barcoded. In some embodiments, such analysis is done by a pipeline that is run before the analysis module 122 loads a dataset 128.

[0113]In some embodiments, single cell sequencing is performed as disclosed in U.S. patent application Ser. No. 15 / 887,947, entitled “Methods and Systems for Droplet-Based Single Cell Barcoding,” filed Feb. 2, 2018 (the '947 application), which is hereby incorporated by reference. For instance, the '947 application discloses the production of one or more droplets containing a single cell bead and a single barcode bead. The systems and methods disclosed in the '947 application also allow for the production of one or more droplets containing a single cell bead and more than one barcode ...

example 2

g for GC Bias

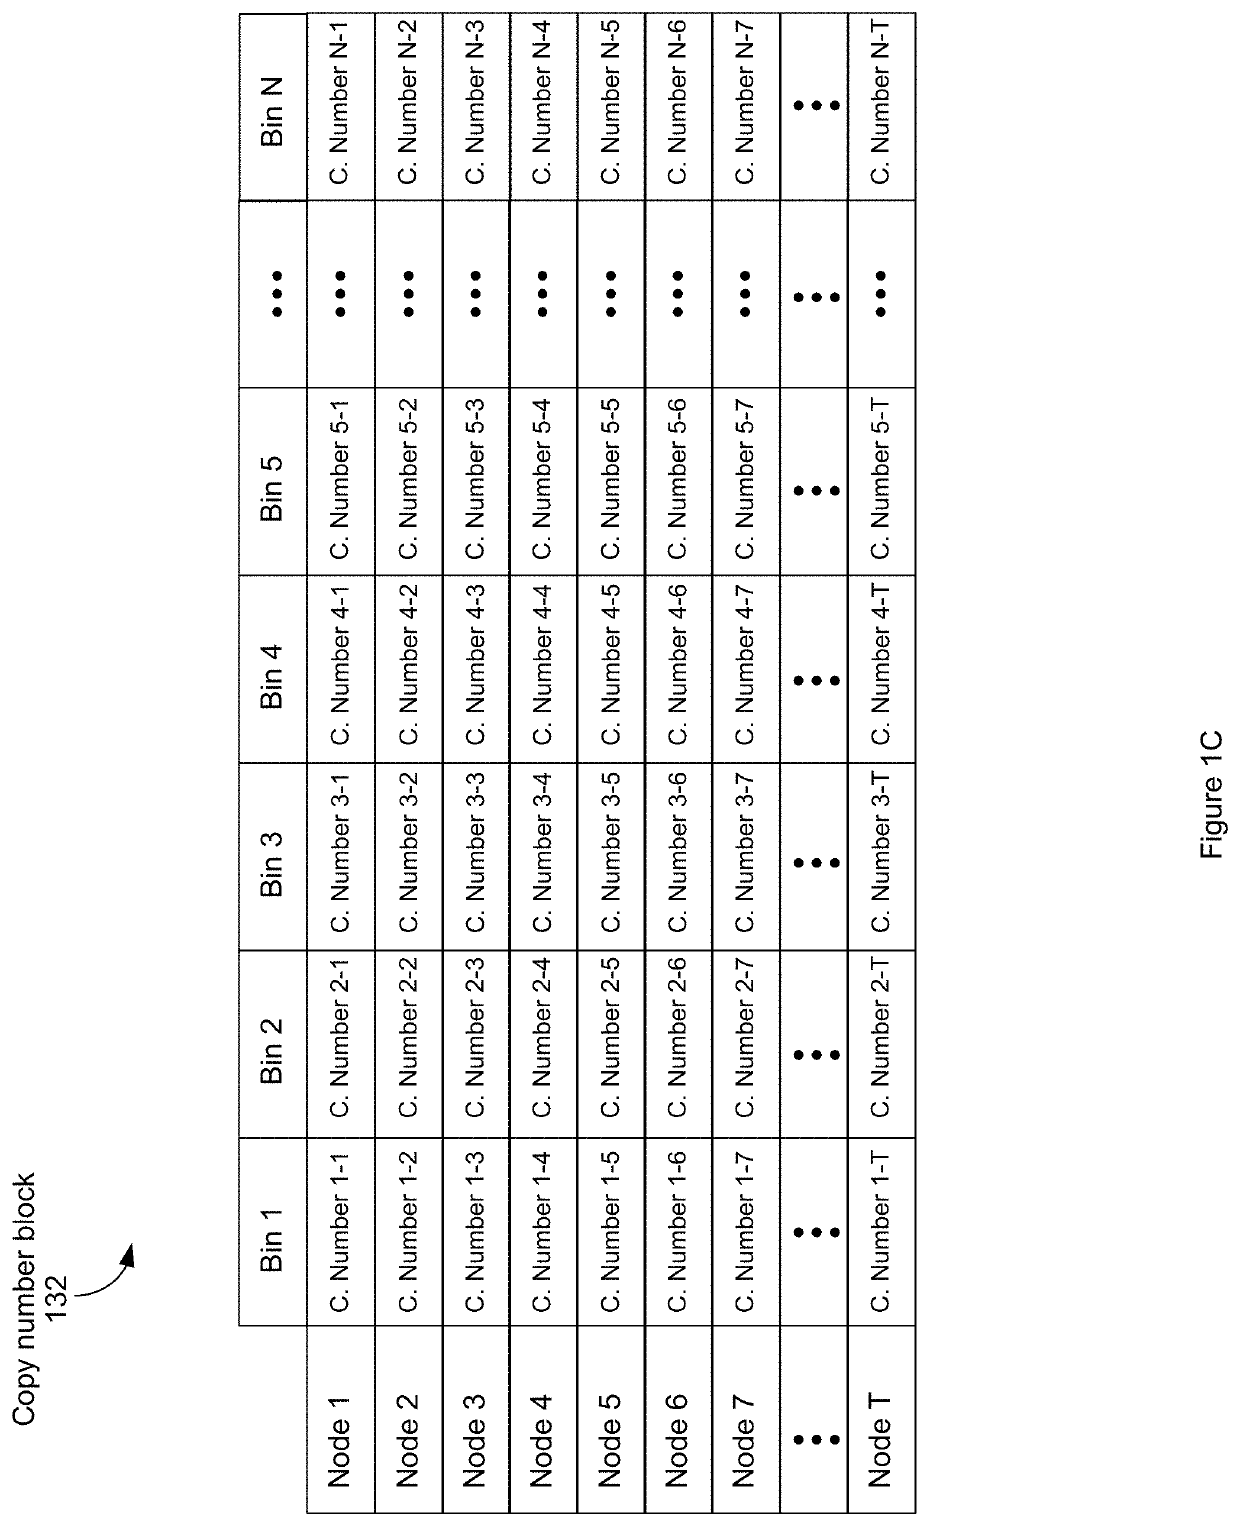
[0122]The observed coverage per cell for a fixed bin 126 is influenced by both (i) bin mappability, on the basis that regions with low mappability produce fewer read pairs, (ii) bin GC content, on the basis that a drop in coverage in regions of very low or very high GC content, (iii) scale factor, that is, the number of read pairs generated by a single fragment of DNA in a partition, which is a function of both the underlying library complexity and the sequencing depth, and (iv) bin copy number on the basis that bins that have high copy number have high coverage. These effects can be incorporated into a generative model where DNA in a fixed, unknown copy number state “emits” read pairs that are observed according to a Poisson distribution. The mean of the Poisson distribution is determined by the product of the copy number, the effect of GC content, the mappability, and the scale factor:

Xi˜Poisson(S piQ(gi)mi)

[0123]where i is an index over all the mappable bins, X is th...


PUM

PropertyMeasurementUnit
heat mapaaaaaaaaaa
heterogeneityaaaaaaaaaa
genomic heterogeneityaaaaaaaaaa

Abstract

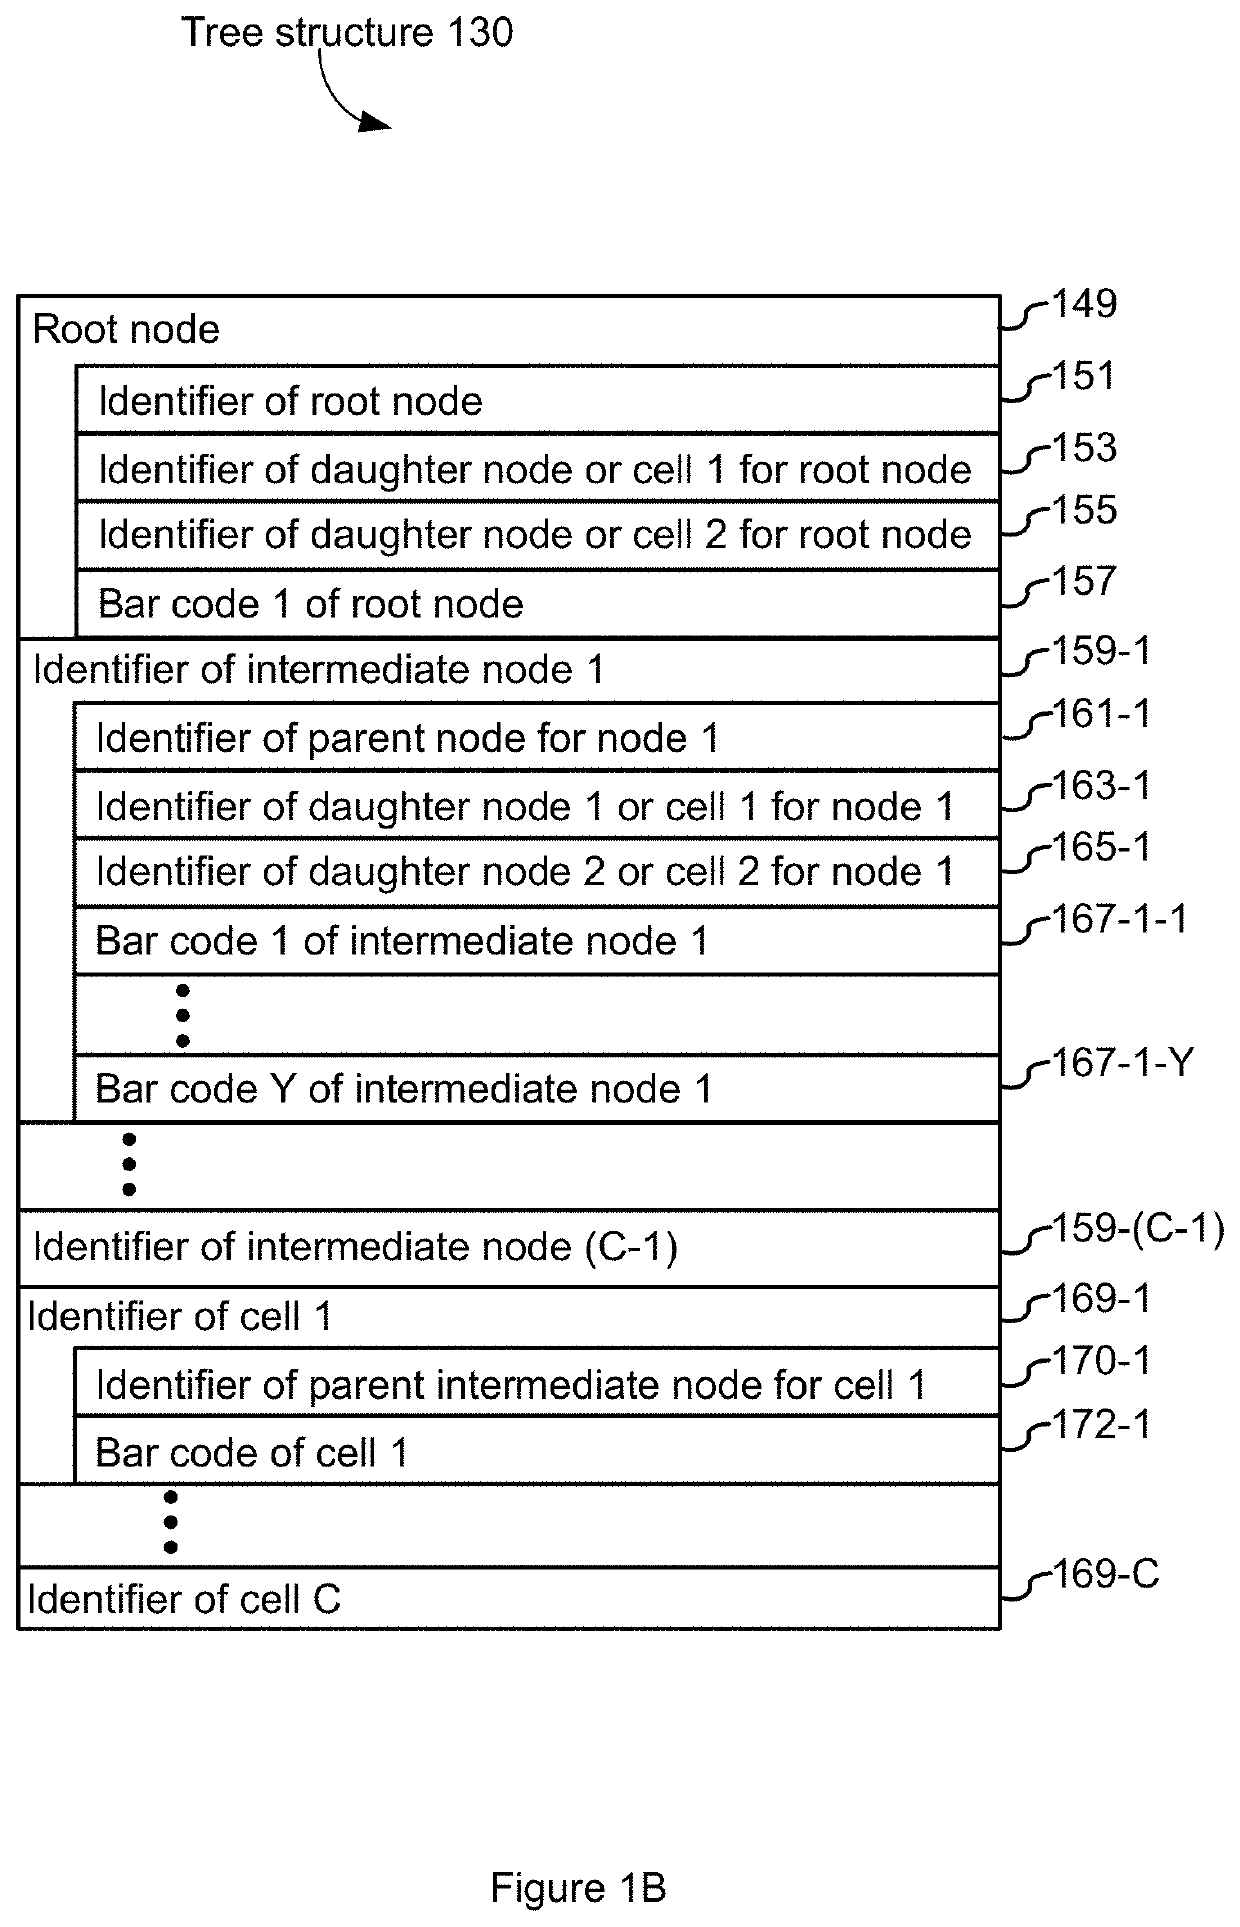
A dataset is obtained comprising data blocks, each representing a different characteristic, for a plurality of cells across a plurality of bins, each bin representing a different portion of a reference sequence. Cells are clustered on one such characteristic across the bins thereby forming a tree that includes root, intermediate, and terminal nodes, where the cells are terminal nodes and intermediate nodes have daughter nodes, themselves being intermediate nodes or a cell. A subset of the tree is displayed that includes the root and leaves, each leaf representing an intermediate node or a cell. A heat map of the characteristic is also displayed, the map including a segment for each leaf, across the bins. When a segment represents an intermediate node, it is an average of the characteristic across daughters of the node. Graphs of characteristics for the root across the bins are also displayed.

Description

CROSS REFERENCE TO RELATED APPLICATION[0001]This application claims priority to U.S. Provisional Patent Application No. 62 / 691,593, entitled “Systems and Methods for Visualizing a Pattern in a Dataset,” filed Jun. 28, 2018, which is hereby incorporated by reference.TECHNICAL FIELD[0002]This specification describes technologies relating to visualizing patterns in datasets.BACKGROUND[0003]Advances in single cell nucleic acid sequencing have given rise to rich datasets for cell populations. Such sequencing techniques provide data for cell populations that can be used to determine genomic heterogeneity, including genomic copy number variation, as well as for mapping clonal evolution (e.g., evaluation of the evolution of tumors). However, such sequencing datasets are complex and, consequently, tools are needed to allow for a scalable approach to analyzing such datasets in order to determine genomic heterogeneity such as copy number variation, map clonal evolution, and / or identification o...

Claims


Application Information

Patent Timeline
Patent Type & Authority Applications(United States)
IPC IPC(8): G16B45/00G16B20/40C12Q1/68
CPCG16B20/40C12Q1/68G16B45/00C12Q1/6869C12Q2535/122C12Q2563/159
Inventor MELLEN, JEFFREYWU, KEVIN J.GOPALAN, VIJAY KUMAR SREENIVASAHEPLER, NICOLAUS LANCESTAAB, JASPER
Owner 10X GENOMICS
Learn More