Method and system for monitoring and improving attention
a monitoring system and attention technology, applied in the field of monitoring and training attention, can solve the problems of higher dropout rate, higher likelihood of drug abuse, lower academic achievement, etc., and achieve the effect of encouragering vigilance in the subj
- Summary
- Abstract
- Description
- Claims
- Application Information
AI Technical Summary
Benefits of technology
Problems solved by technology
Method used
Image
Examples
example 1
n of EEG Annotated with Reaction Time Data
[0045]A psychomotor vigilance task (PVT), which measures a subject's reaction time to a stimulus, was administered to subjects while simultaneously recording the subjects' brain activity. This process was used to obtain information about whether a given set of EEG features at any instance are associated with attentiveness or inattentiveness. Measures of attention other than PVT may also be used. The PVT is also useful for eliciting states of attentiveness or inattentiveness in a subject during the data collection. This is achieved by administering stimuli at various intervals over a long period of time, during which the subject must attempt to remain vigilant in attending to the task. Instances of lased attention tend to result in longer reaction times, and such instances may become more frequent over time.
[0046]The PVT was administered through a touch-sensitive video monitor as follows: A light stimulus appeared at random intervals of 2 to ...
example 2
ification by Cluster Analysis
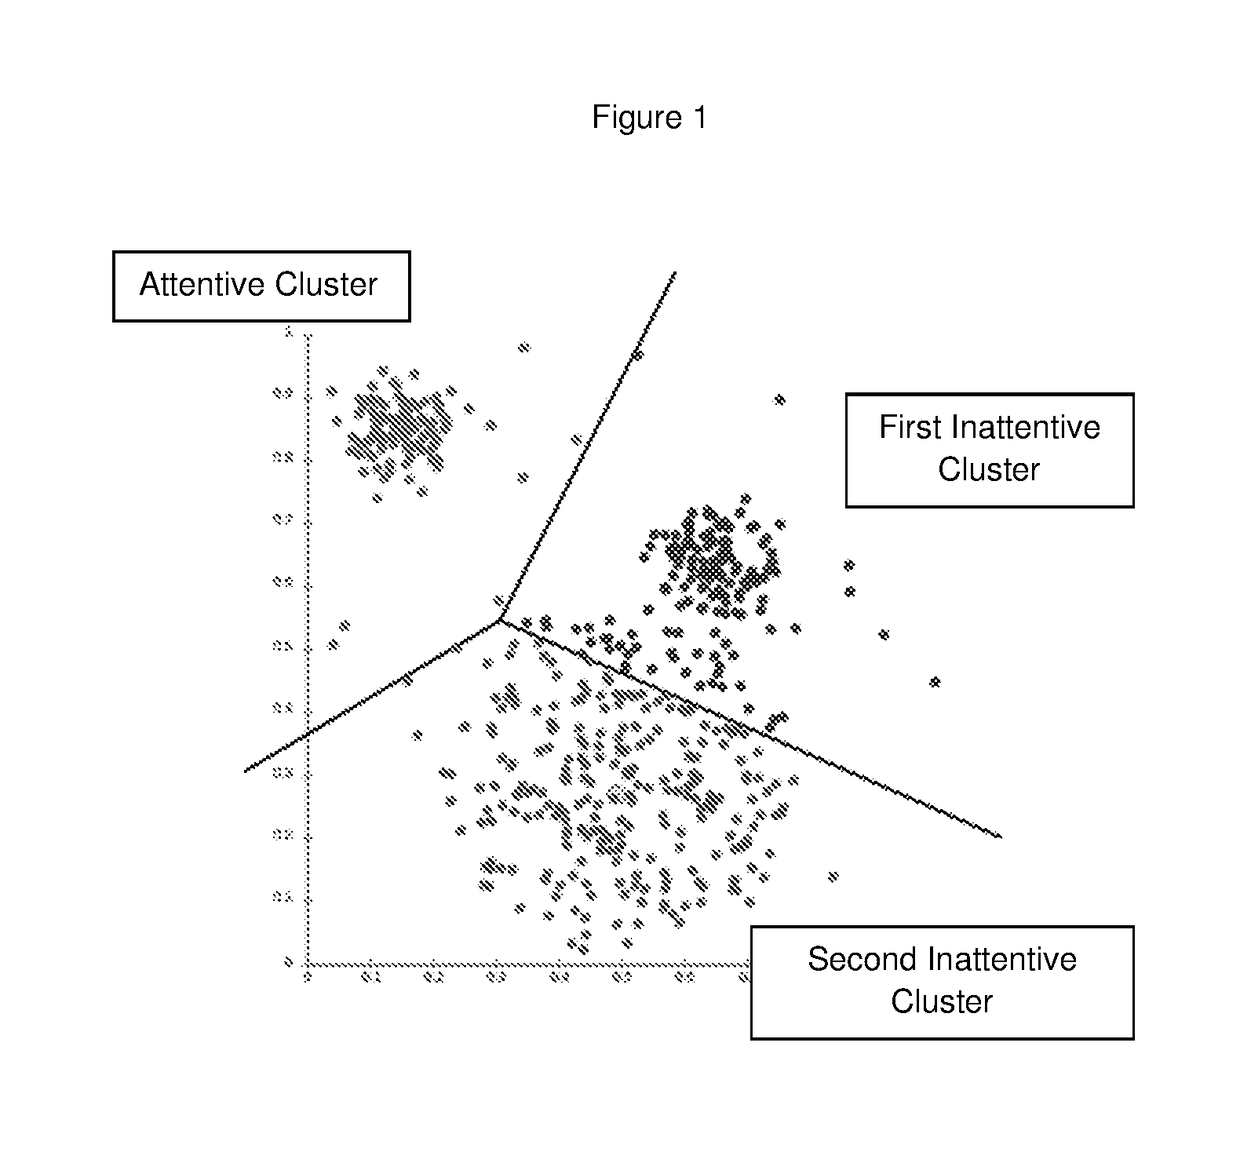
[0049]The EEG and PVT reaction times data were used to classify EEG features as characteristic of states of attention and inattention observed in the subjects during the course of the testing described in Example 1.
[0050]The EEG and PVT reaction times data were pooled. Each EEG feature in the pooled data was multiplied by the reaction time for its trial and also multiplied by the age of the specific subject to create a variable for analysis (the general form of equation is shown in equation 1).
Iba_theta_mastoid_r=latency*b_theta_mastoid_r*age (1),
where Iba_theta_mastoid_r is the composite variable, latency is the reaction time, b_theta_mastoid_r is the relative EEG power in the mastoid channel frequency range of 4-8 Hz.
[0051]Each variable type was Z-transformed across the entire pool of like variables (the general form of equation is shown in equation 2).
Iba_theta_mastoid_rz=(Iba_theta_mastoid_r−E) / F (2),
where Iba_theta_mastoid_rz is the Z-transformed ...
example 3
ification by Logistic Regression
[0055]The EEG and PVT reaction times data are used to classify EEG features as characteristic of states of attention and inattention observed in the subjects during the course of the testing described in Example 1.
[0056]The EEG and PVT reaction times data are pooled. The relative powers of the EEG bands (b_delta_mastoid_r, b_theta_mastoid_r, etc.) are examined for evidence of EEG slowing (i.e., increasing power in the delta and theta bands), coincident with longer reaction times, indicating drowsiness. A composite measure is created, and a threshold assigned. If the composite measure exceeds the threshold the trial is assigned to the inattentive drowsy group.
[0057]The remaining trials are subject to logistic regression to find the EEG features' correlates of reaction time (see FIG. 5). The correlation coefficients (e.g. Pearson's r) are examined, and the features with the weaker correlates are removed from further analysis. The remaining EEG features ...
PUM
 Abstract
Description
Claims
Application Information
 - R&D
- Intellectual Property
- Life Sciences
- Materials
- Tech Scout
- Unparalleled Data Quality
- Higher Quality Content
- 60% Fewer Hallucinations
Browse by: Latest US Patents, China's latest patents, Technical Efficacy Thesaurus, Application Domain, Technology Topic, Popular Technical Reports.
© 2025 PatSnap. All rights reserved.Legal|Privacy policy|Modern Slavery Act Transparency Statement|Sitemap|About US| Contact US: help@patsnap.com


