Radiograph density detection device
a density detection and radiograph technology, applied in the field of imaging, can solve the problems of low bone density, large-scale studies that correlate bone/tissue density with health and disease states, and are primarily lacking studies in other animals
- Summary
- Abstract
- Description
- Claims
- Application Information
AI Technical Summary
Benefits of technology
Problems solved by technology
Method used
Image
Examples
example 1
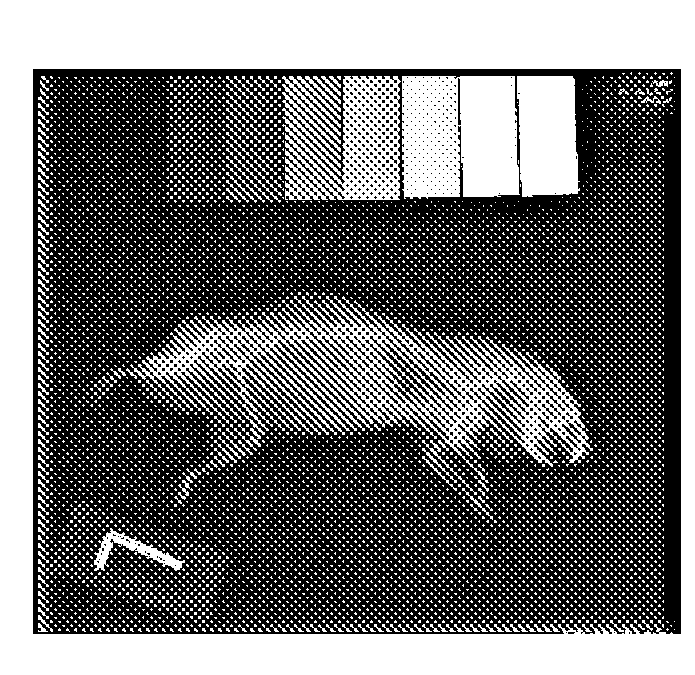
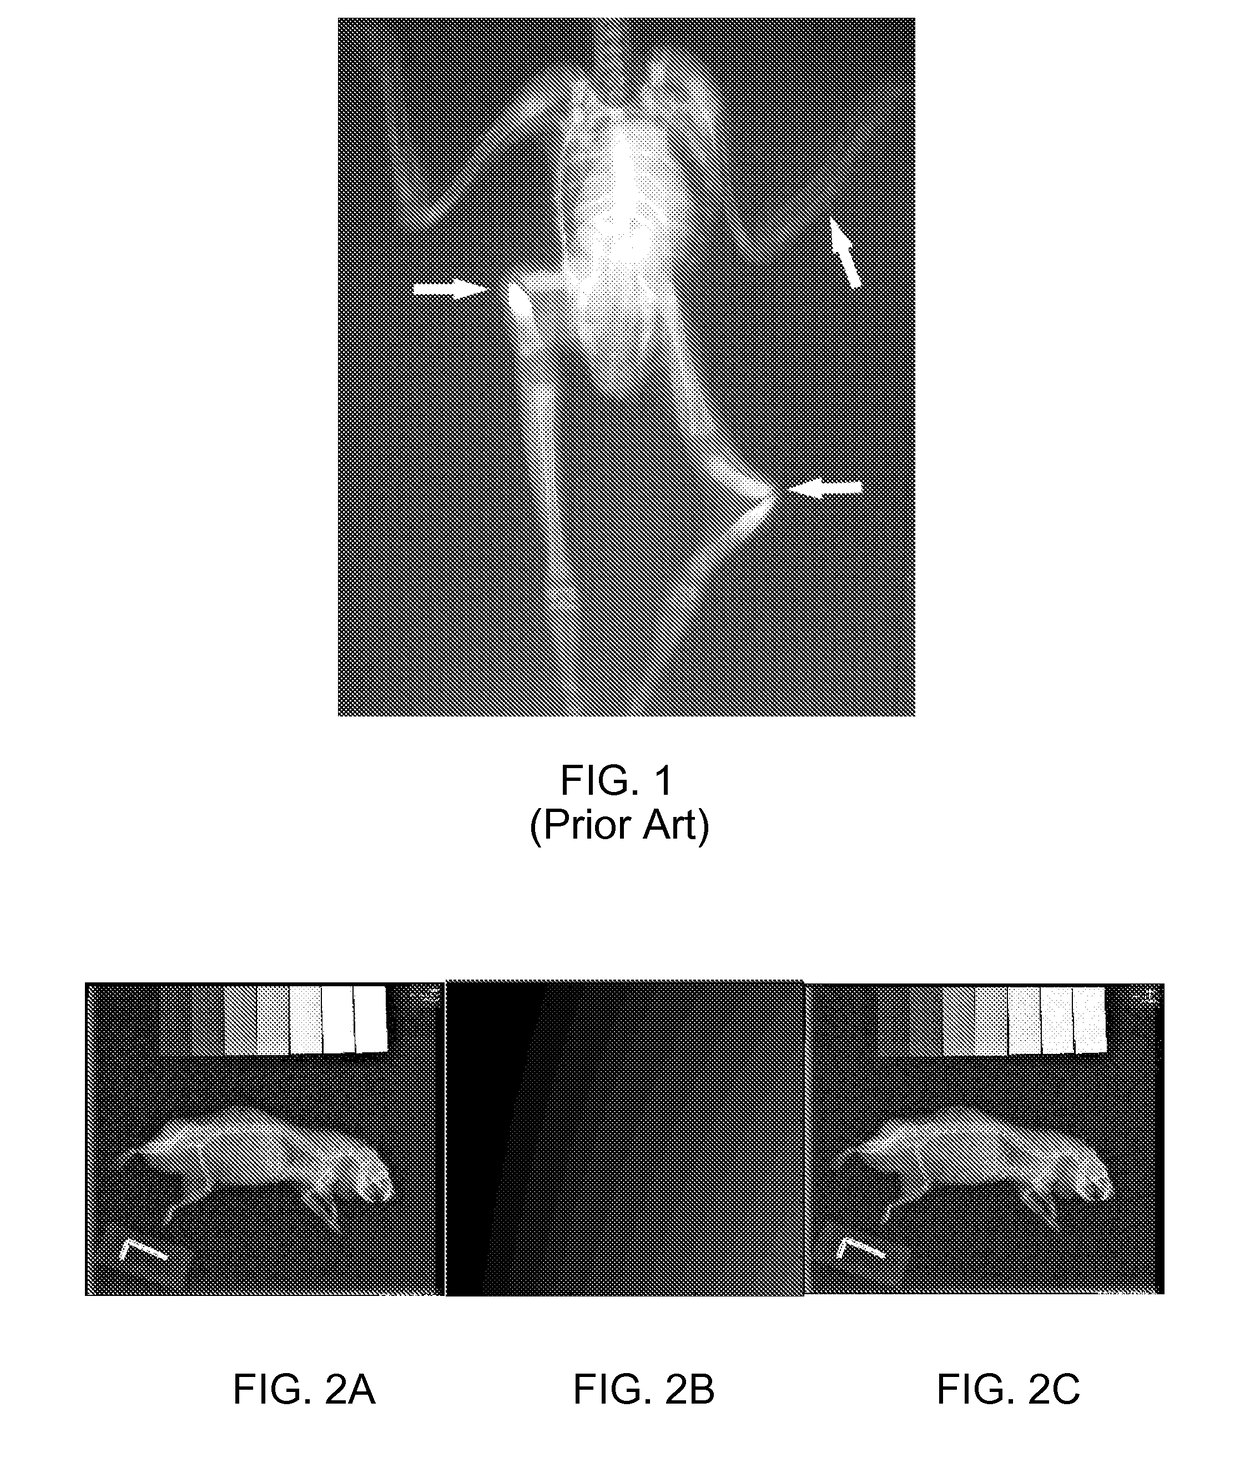
[0034]FIGS. 2A-C show a radiograph of an ex vivo hamster (FIG. 2A) with an embodiment of the intensity calibration bar (top of image). In the radiograph of FIG. 2A, there is a conspicuous background that increases in intensity (dark to light) from left to right of the image. The non-uniform background is isolated (FIG. 2B), which contributes to approximately 10-15% of the intensity variation across the image in this specific example. After subtracting the background, the corrected image (FIG. 2C) shows visibly improved contrast and detail, especially in the animal head. Importantly, the intensities can now be assigned bone density values with more certainty by cross-referencing with the calibration bar.
example 2
[0035]Validation of embodiments of hardware-software methodology in making X-ray radiography quantitative is obtained with radiographs of different objects as well as ex vivo animals of varying sizes, and performing post-analysis corrections, and compare the corrected radiographs directly with CTs of the identical objects and animals. The results may be used as feedback for improving the software algorithms of the correction.
example 3
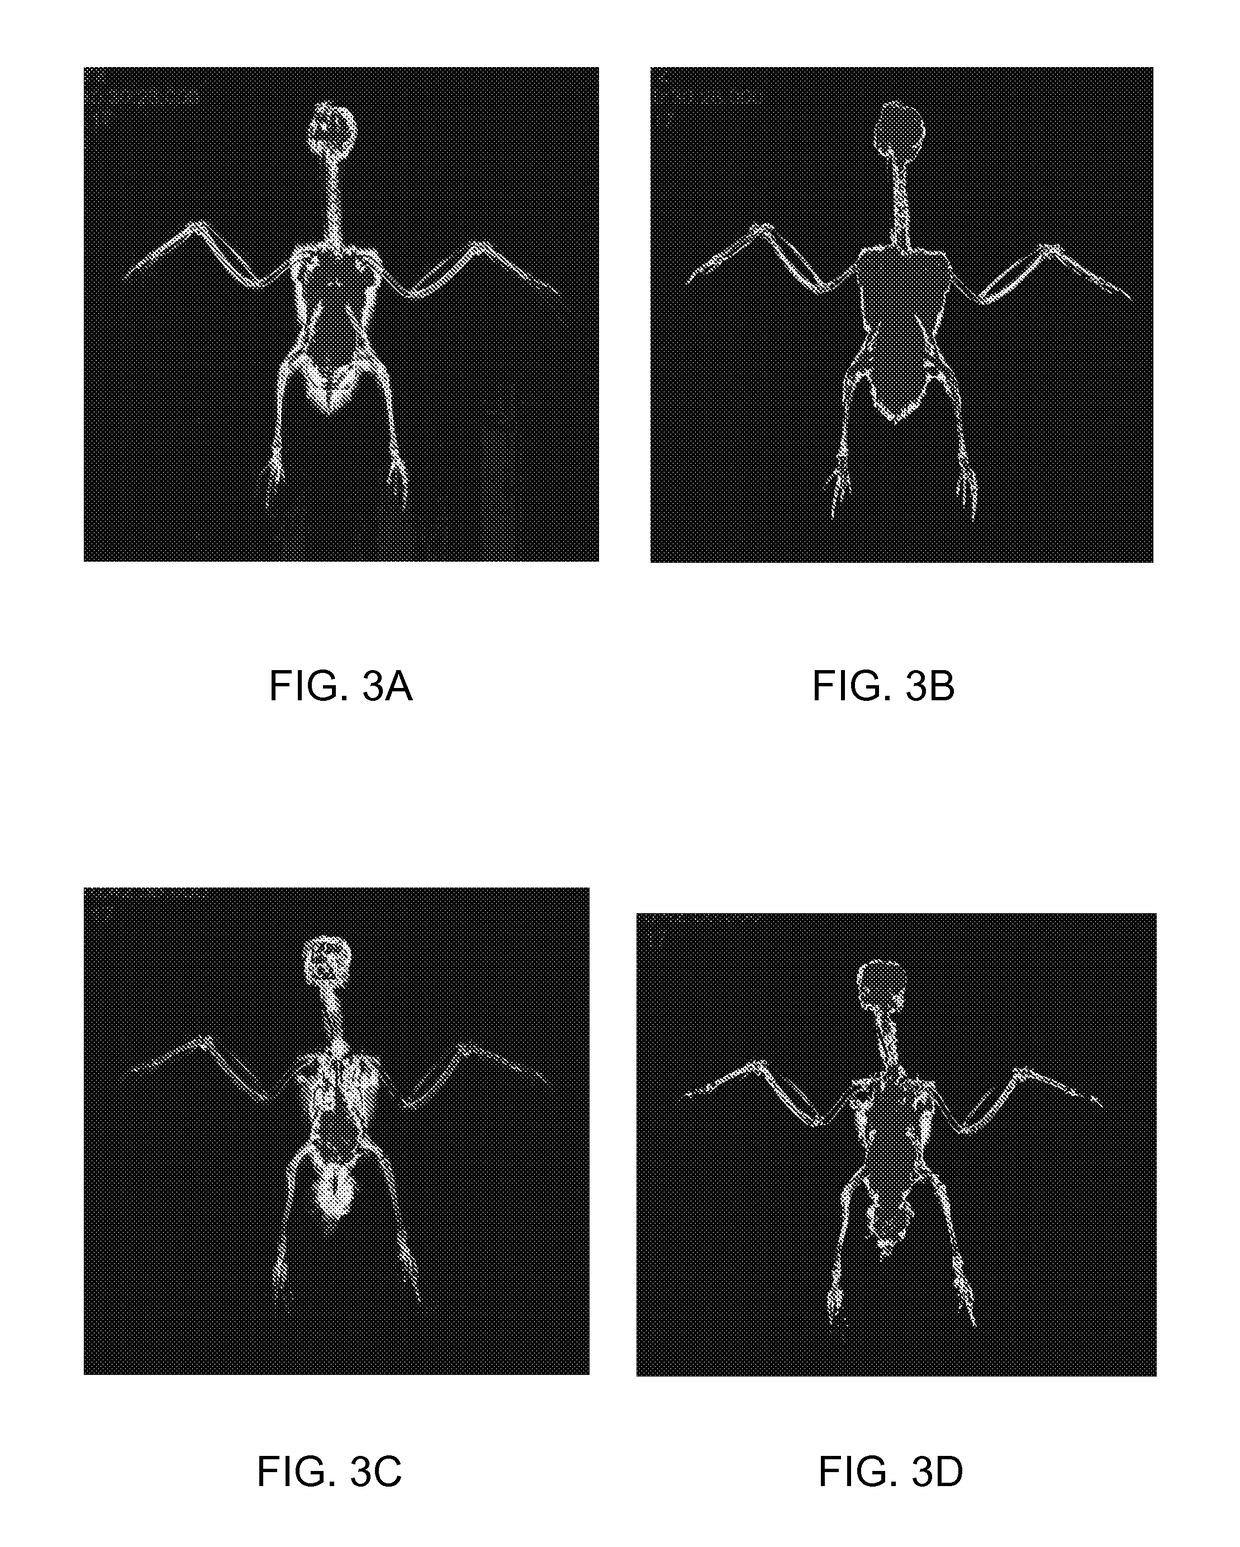
[0036]FIGS. 3A-3H are plain and corrected radiographs (X-ray image) and color density maps of a two cockatiels. FIGS. 3A through 3D refer to cockatiel 1, and FIGS. 3E through 3H refer to cockatiel 2. The animals are approximately the same size and radiographs were completed on the same machine with identical settings. FIGS. 3A and 3E represent the unprocessed radiograph and show the calibration bar (represented by circles of varying densities [gray scales]) and the natural gradient of the image (notice the variable ‘black’ of the background). FIGS. 3B and 3F show the same images post-processing to even the gradient. This step ensures that all, or at least most, points on the image have been adjusted for the gradient variation and is crucial to the next step of assigning density values to the tissues. FIGS. 3C and 3G show the same subjects with a color map and identical density scale. Each color corresponds to a density value that can also be represented with a numerical value. The r...
PUM
 Abstract
Description
Claims
Application Information
 - R&D
- Intellectual Property
- Life Sciences
- Materials
- Tech Scout
- Unparalleled Data Quality
- Higher Quality Content
- 60% Fewer Hallucinations
Browse by: Latest US Patents, China's latest patents, Technical Efficacy Thesaurus, Application Domain, Technology Topic, Popular Technical Reports.
© 2025 PatSnap. All rights reserved.Legal|Privacy policy|Modern Slavery Act Transparency Statement|Sitemap|About US| Contact US: help@patsnap.com


