
System and Method for Mapping Financial Data

a financial data and system technology, applied in the field of mapping systems, can solve the problems of reducing the effectiveness and efficiency of techniques, and achieve the effect of reducing the disadvantages and eliminating the problems of mapping financial data

Inactive Publication Date: 2014-08-28
BANK OF AMERICA CORP
View PDF0 Cites 0 Cited by
  • Summary
  • Abstract
  • Description
  • Claims
  • Application Information

AI Technical Summary

Benefits of technology

The present invention provides a system for mapping financial data that can reduce or eliminate problems associated with mapping. The system allows users to manage a large number of segments and calculate their profitability without sacrificing accuracy. It also allows organizations to determine a more accurate profitability forecast by utilizing a database of financial data from multiple business units. Additionally, the system allows multiple users to collaborate on a forecast to ensure an accurate decision.

Problems solved by technology

Conventional techniques do not consider all possible variables to calculate profitability, which reduces the effectiveness and efficiency of the techniques.

Method used


Image

  • System and Method for Mapping Financial Data
  • System and Method for Mapping Financial Data
  • System and Method for Mapping Financial Data

Examples


Embodiment Construction

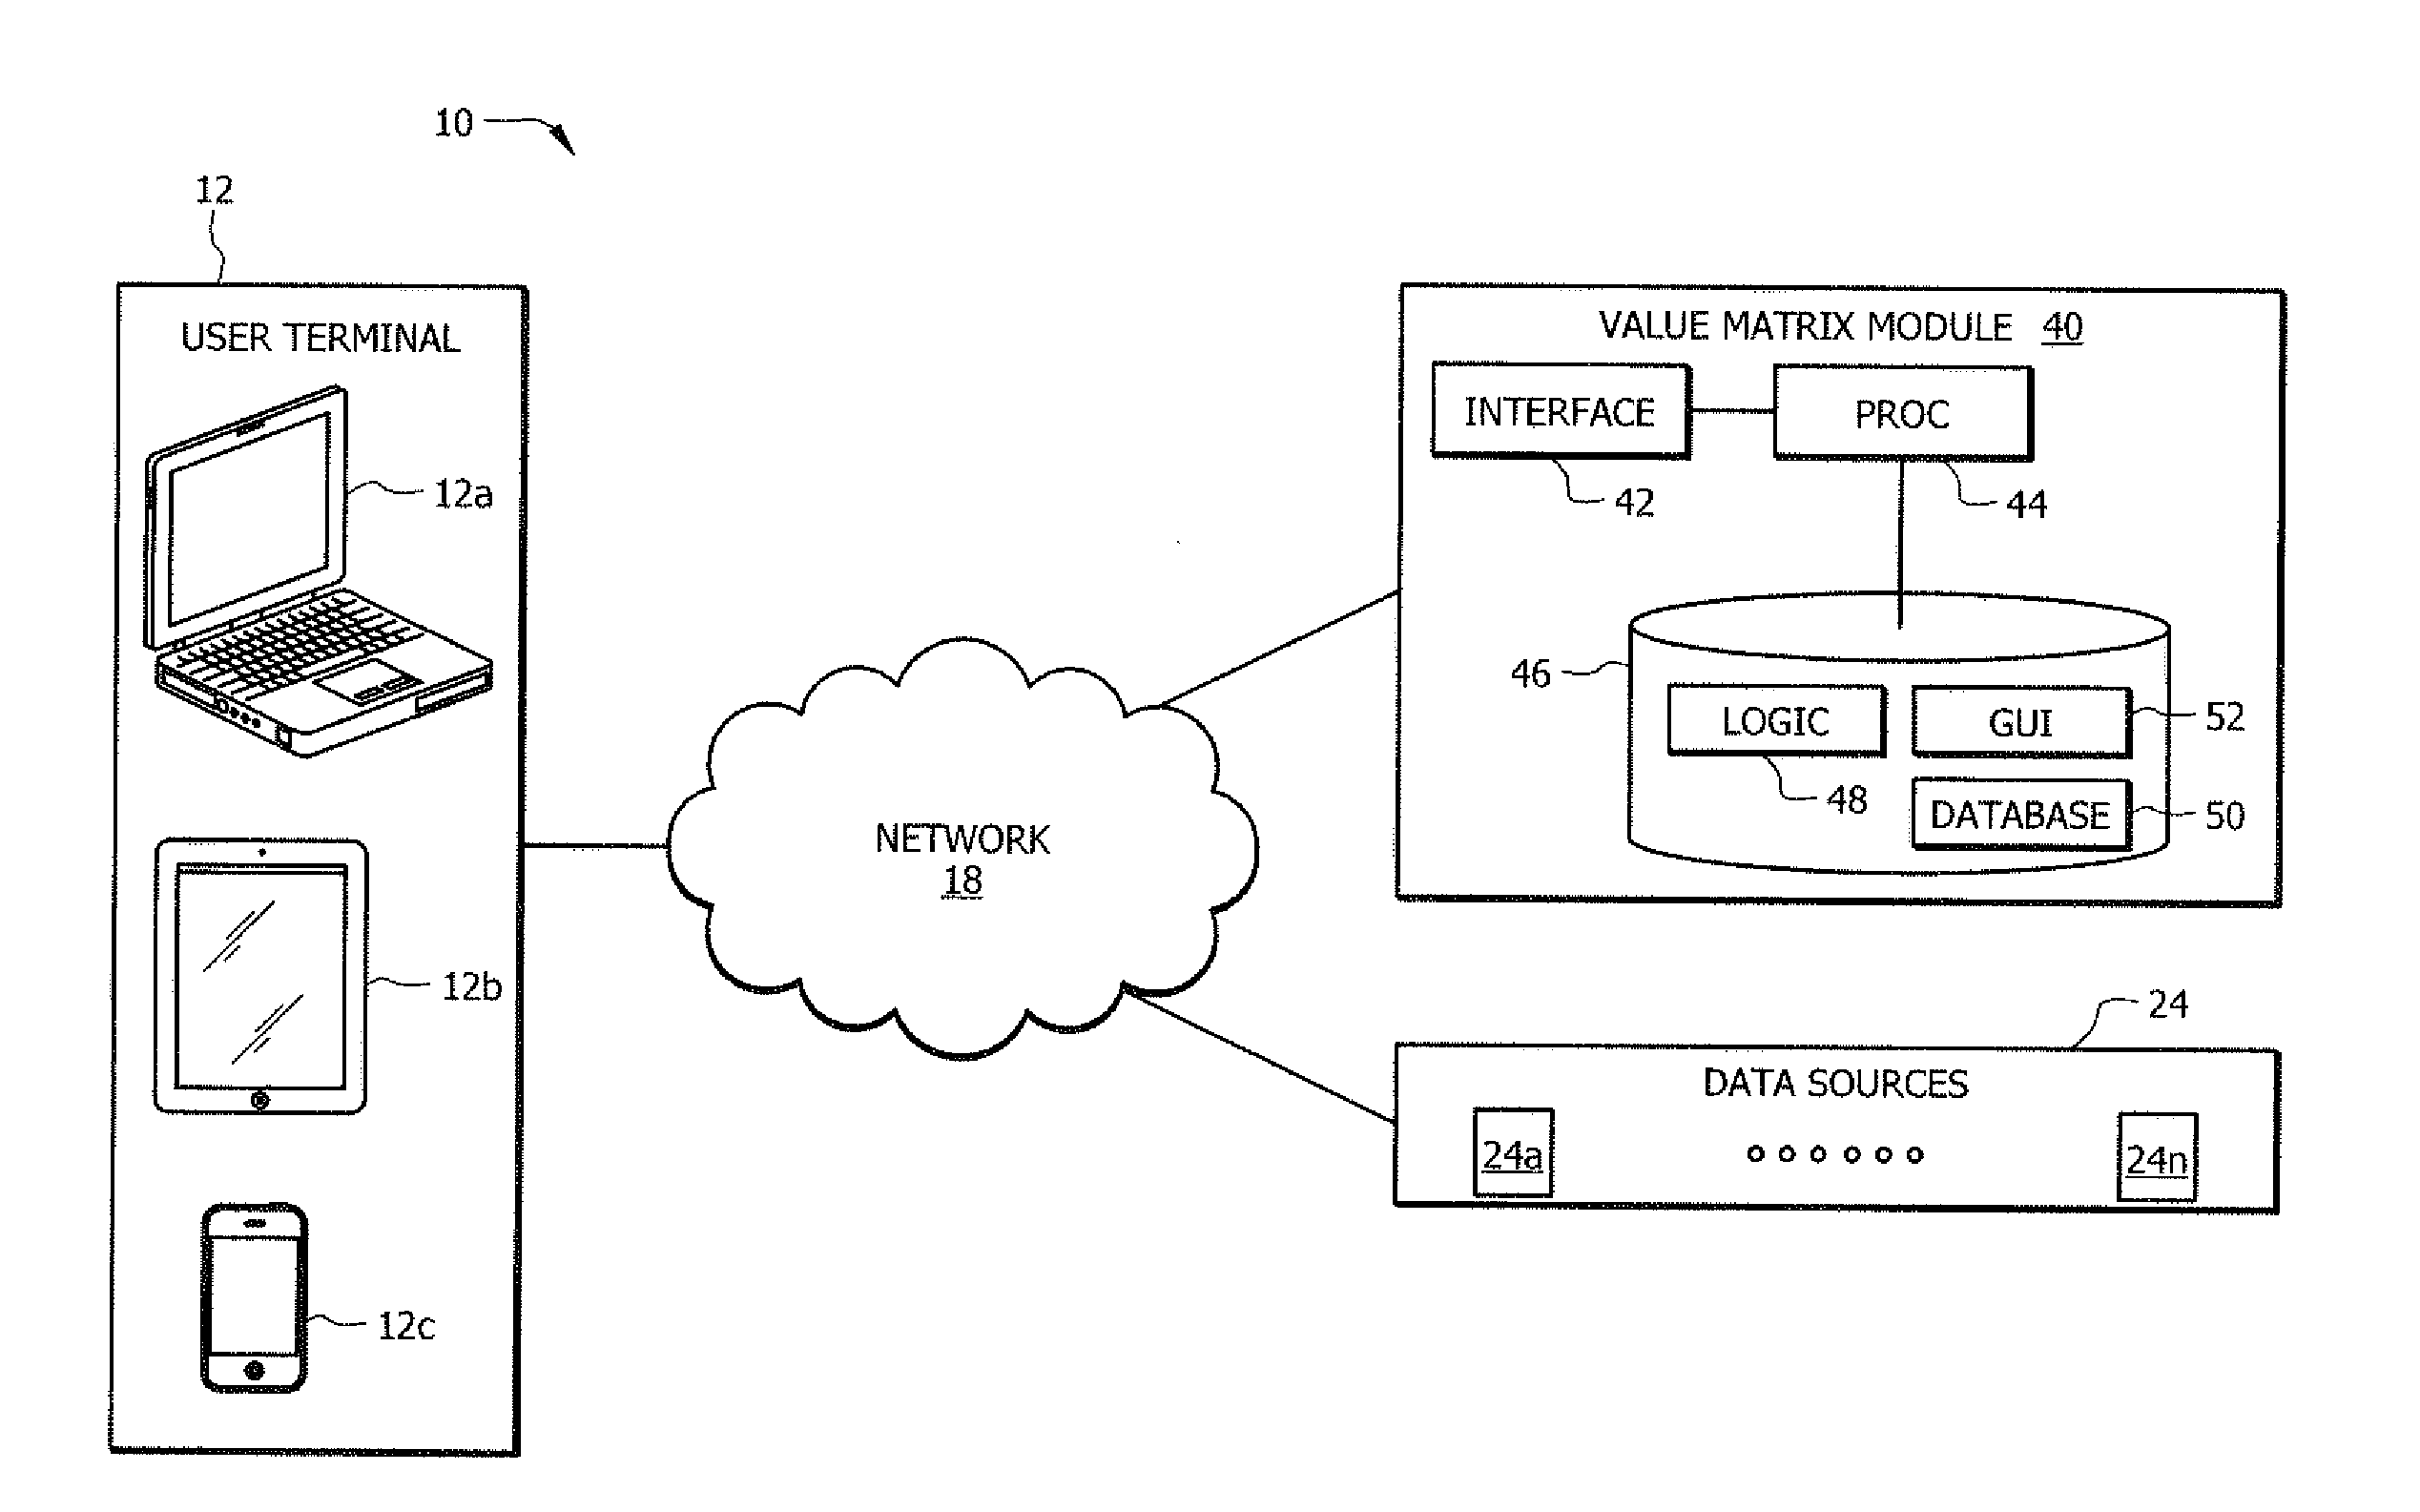
[0012]Embodiments of the present disclosure and their advantages are best understood by referring to FIGS. 1 through 4 of the drawings, like numerals being used for like and corresponding parts of the various drawings.

[0013]Organizations may calculate the profitability of a new card account according to segments of profitability. Profitability may encompass all profit and loss (P&L) components over the lifetime of an account. Generally, a low-level segment of profitability may include various low-level attributes that an organization wishes to forecast towards. A high-level segment of profitability may include various high-level attributes. Low-level attributes are, for example, a more granular attribute than their associated high-level attribute. For example, an “all behavior” high-level attribute may break down into a more granular level, listing each individual behavior as a low-level attribute. Organizations may seek to calculate profitability at the most granular level possible...


PUM


Abstract

Mapping financial data comprises receiving a first set of financial data from internal reporting systems. The first set of financial data is loaded into a database having high-level design segmentation. The first set of financial data is associated with a high-level segment of profitability. An input associated with the high-level segment of profitability is received in a graphical user interface. A second set of financial data is extracted from the first set of financial data according to the high-level segment of profitability received in the graphical user interface. A third set of financial data is extracted from a plurality of business units. A baseline forecast is calculated according to the second set of financial data and at least a portion of the third set of financial data. The baseline forecast is presented in the graphical user interface to determine the profitability of a new card account.

Description

TECHNICAL FIELD OF THE INVENTION[0001]The present disclosure relates generally to mapping systems, and more particularly to mapping financial data.BACKGROUND OF THE INVENTION[0002]Organizations seek to calculate profitability according to a variety of variables. Because organizations are more sophisticated, the number of variables to consider to properly forecast financial positions has increased. Conventional techniques do not consider all possible variables to calculate profitability, which reduces the effectiveness and efficiency of the techniques.SUMMARY OF THE DISCLOSURE[0003]According to embodiments of the present disclosure, disadvantages and problems associated with mapping financial data may be reduced or eliminated.[0004]Mapping financial data comprises receiving a first set of financial data from internal reporting systems. The first set of financial data is loaded into a database having high-level design segmentation. The first set of financial data is associated with a ...

Claims


Application Information

Patent Timeline
IPC IPC(8): G06Q40/00
CPCG06Q40/10
Inventor HATTON, ANDREWGREEN, KEVIN N.LUSTER, JOSHUAMUCCHETTI, THOMASPELLICANE, ANTHONY
Owner BANK OF AMERICA CORP
Learn More