Genetic markers and diagnostic methods for resistance of breast cancer to hormonal therapies
- Summary
- Abstract
- Description
- Claims
- Application Information
AI Technical Summary
Benefits of technology
Problems solved by technology
Method used
Image

Examples
example 1
Gene Pathway Patterns Correlate with Tamoxifen Sensitivity
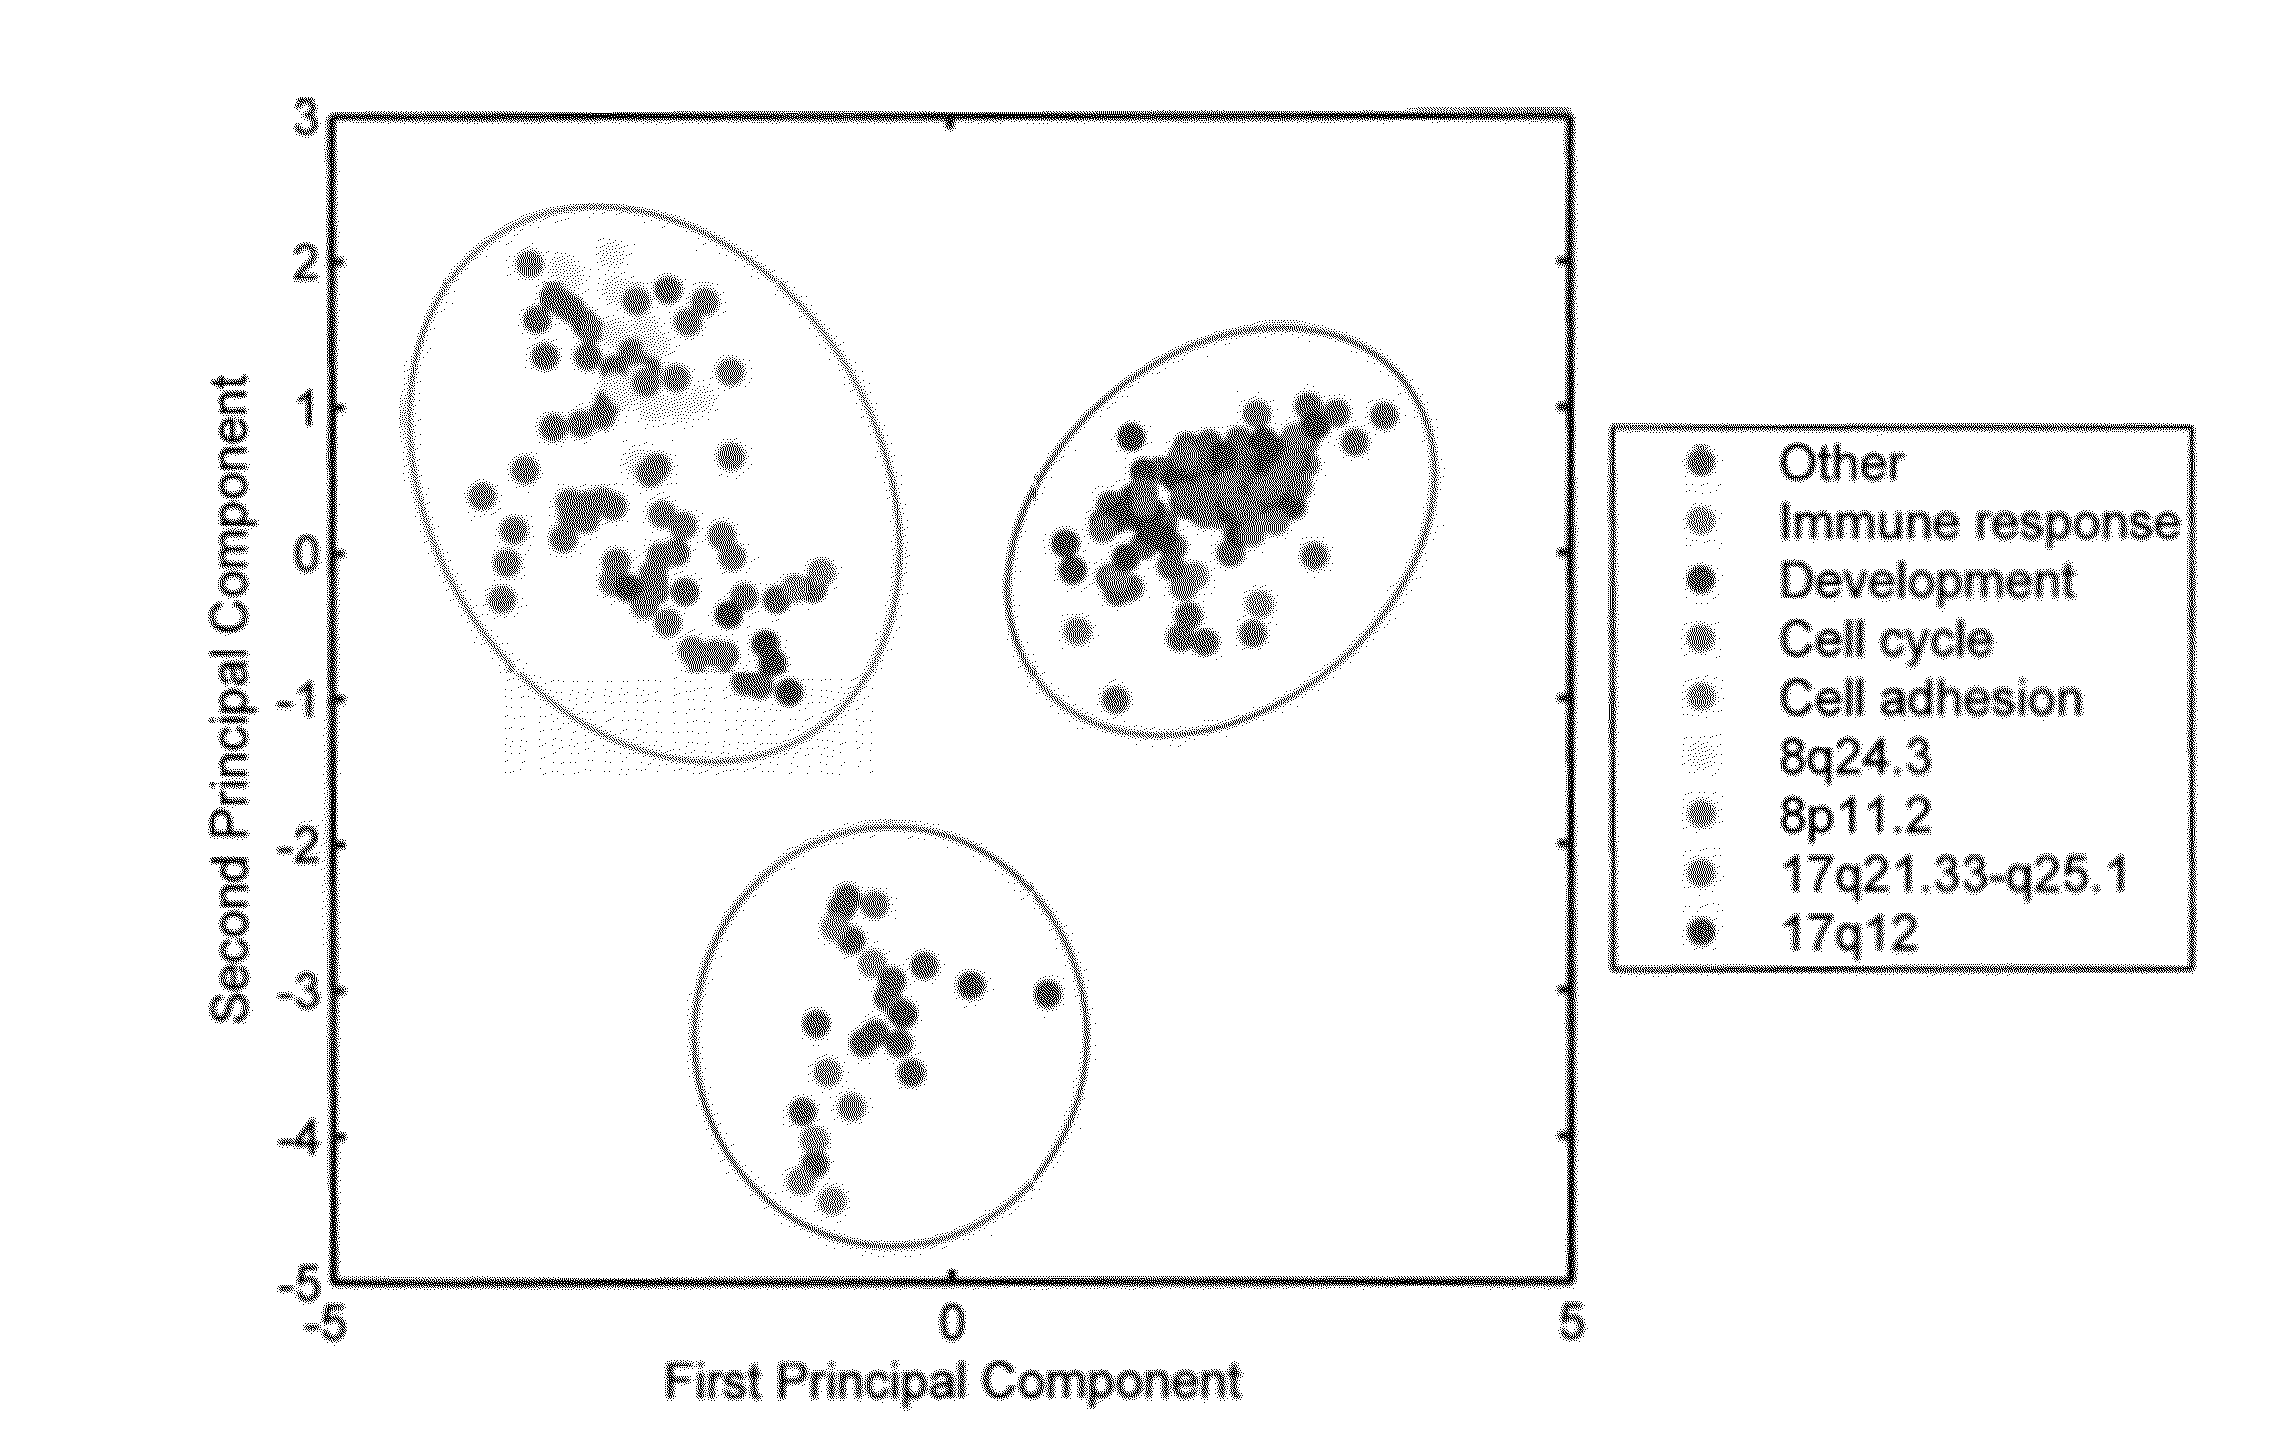
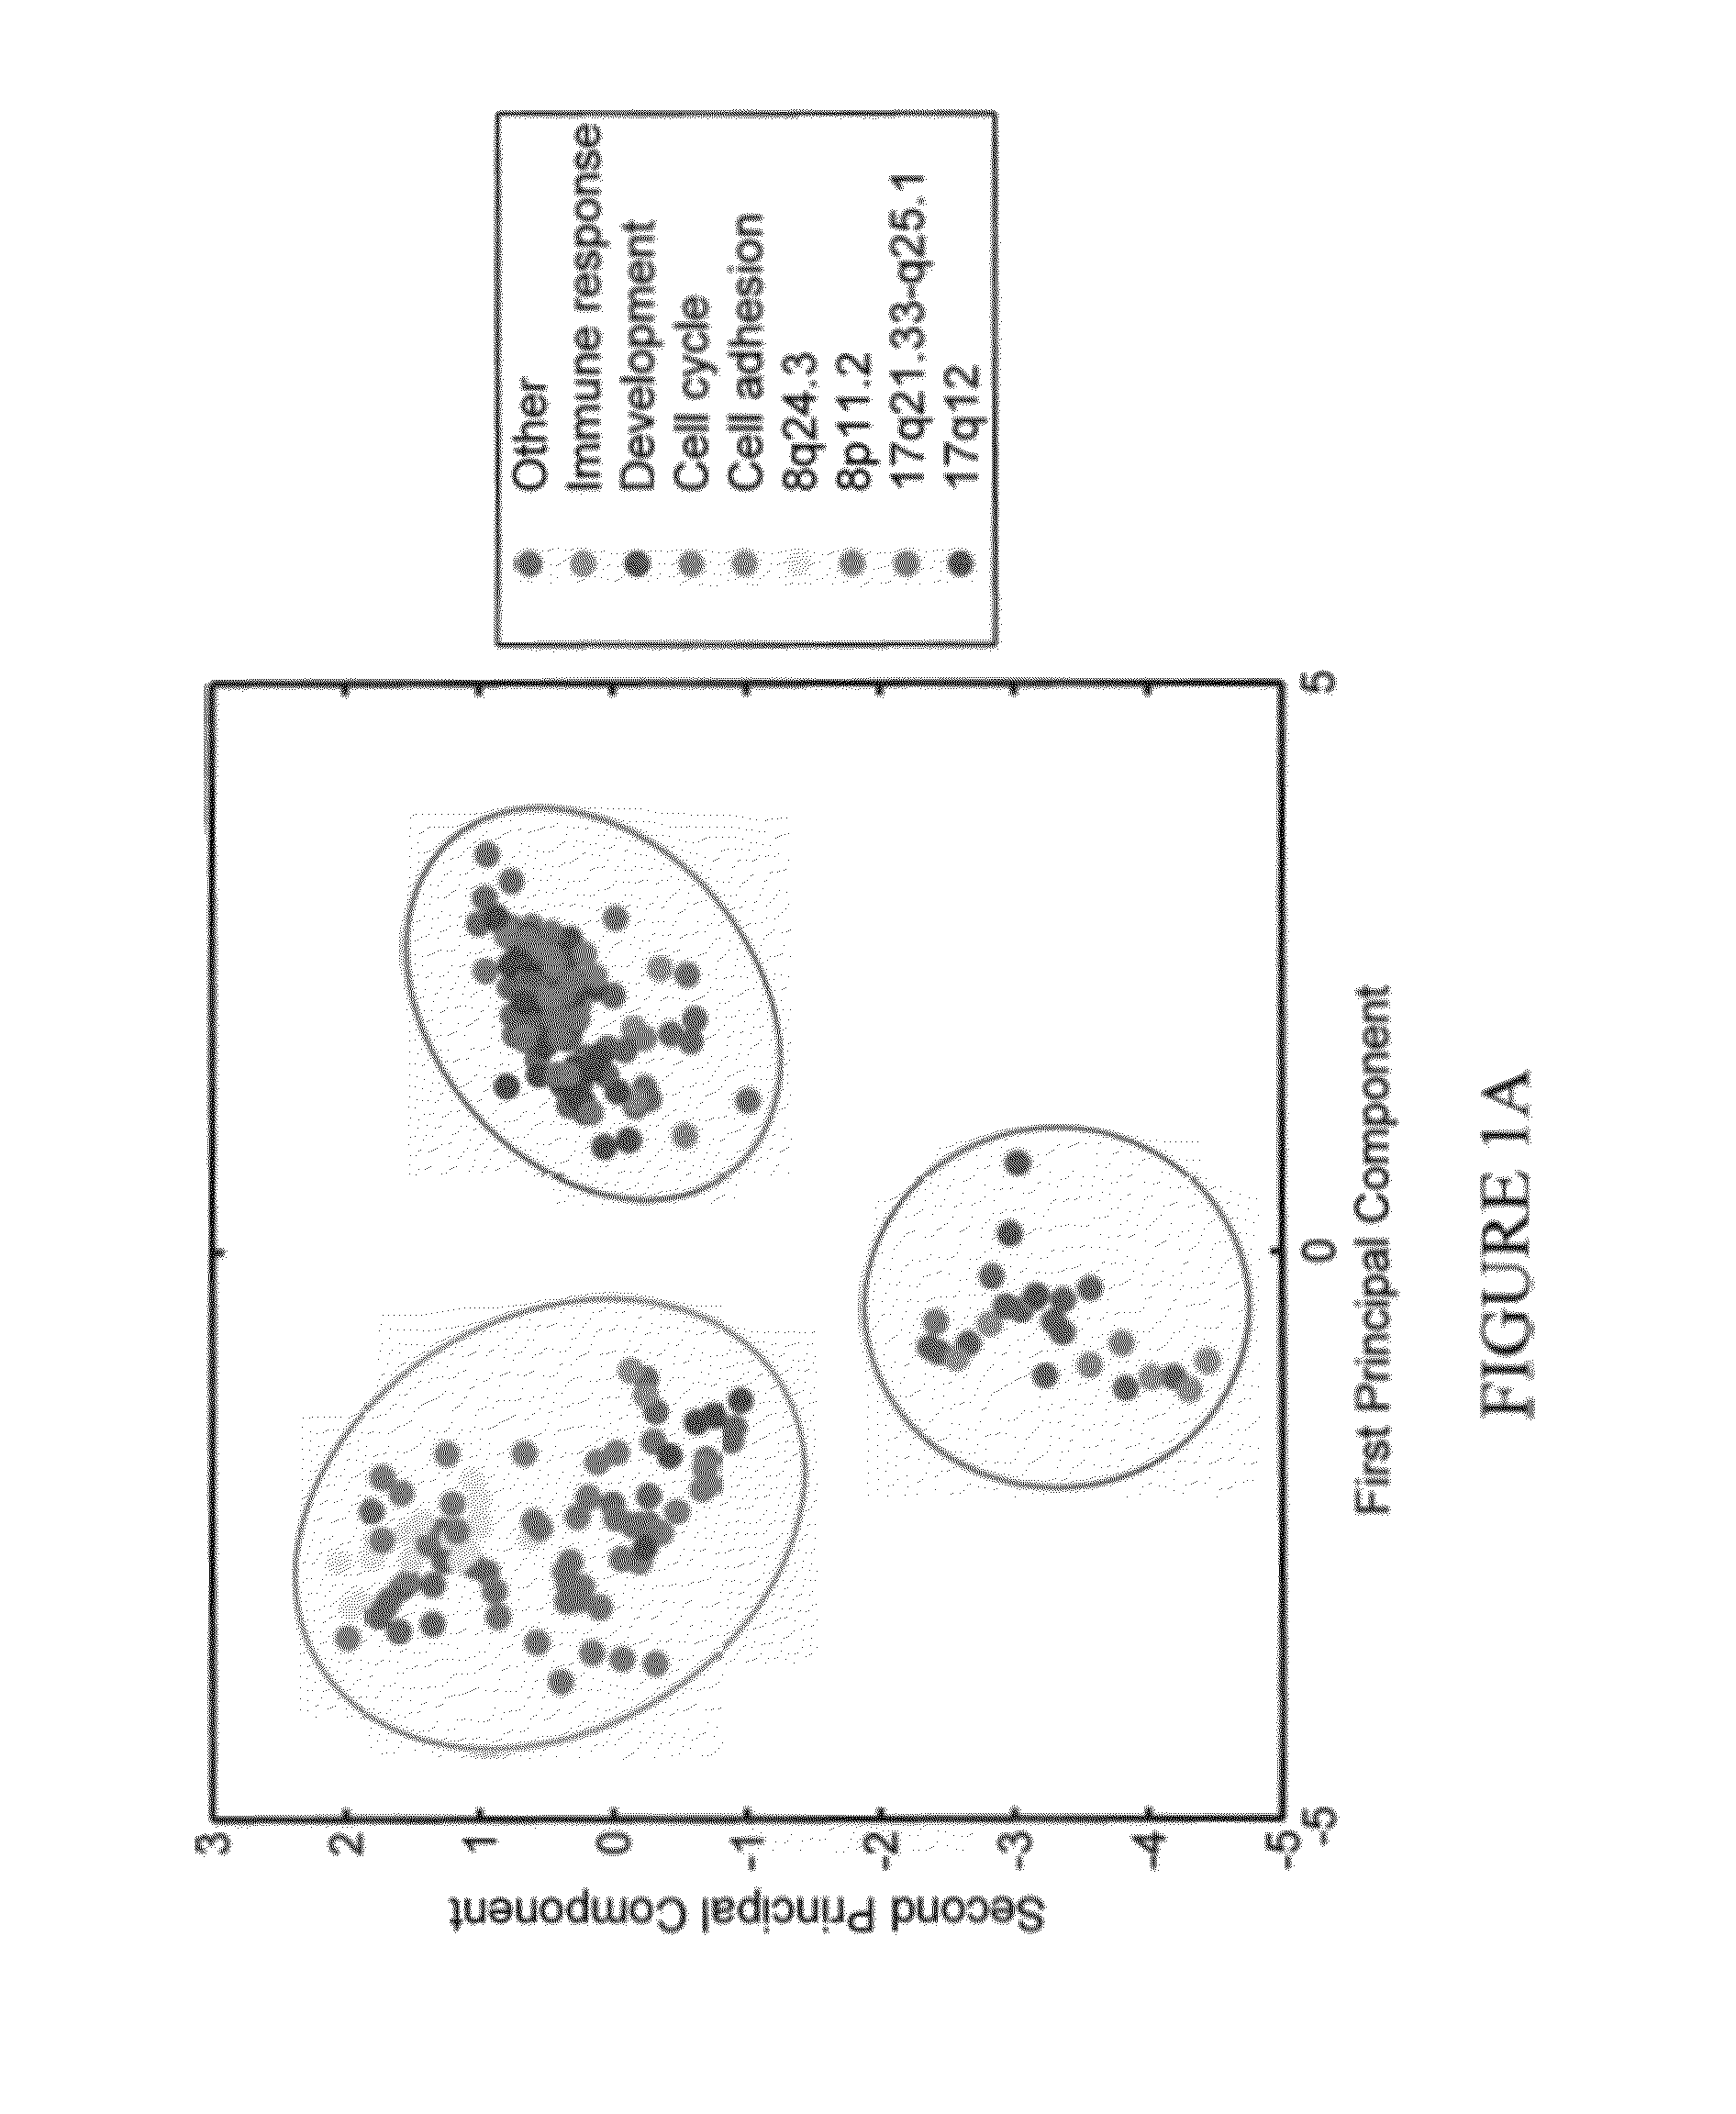
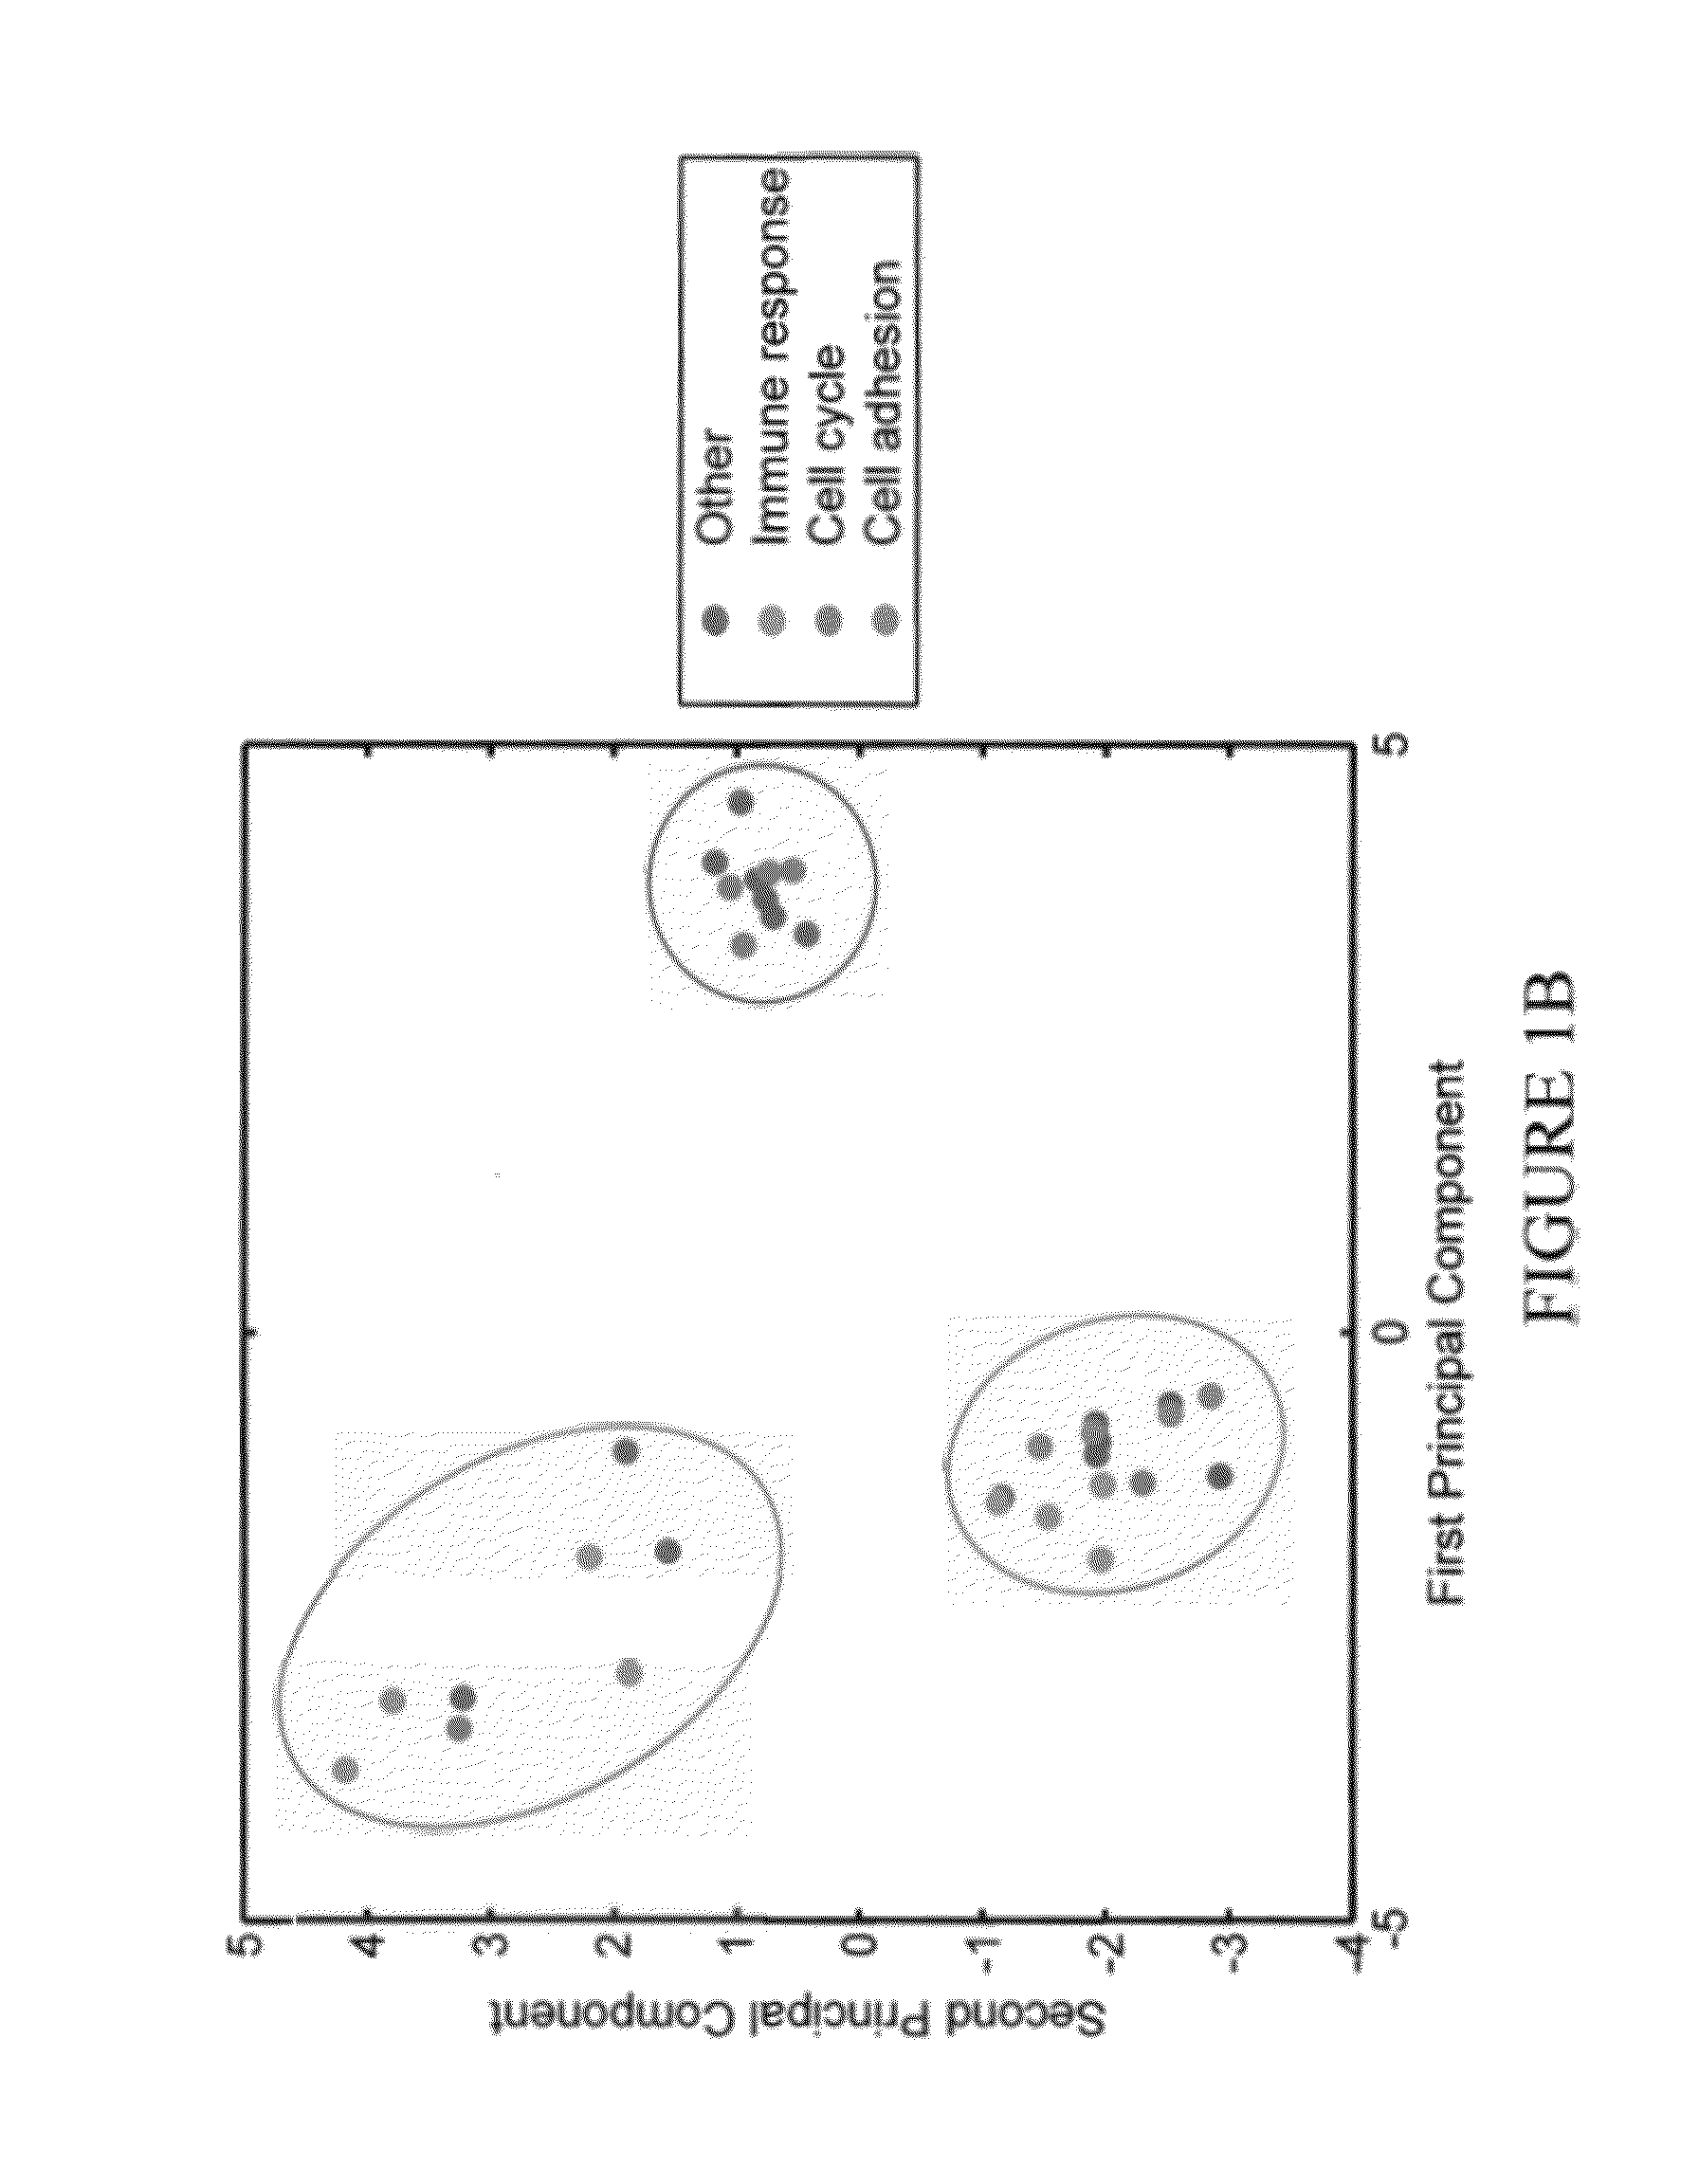
[0053]Outlier profiles of genes associated with differential survival are organized in a binary matrix where 1 indicates the presence of an outlier. FIG. 1 represents the projection of each gene's outlier profile on the first two principal components of the corresponding matrix for high outlier values (A) and respectively, low outlier values (B). The clusters circled in red are correlated with a poor outcome while the ones in blue have a better prognosis. This assignment was performed by examining survival for each individual gene outlier profile as listed in Additional File 1. Enrichment analysis over Gene Ontology (GO) annotations revealed that clusters are enriched with biological pathways and chromosomal regions presented in Table 1 (Nucleic Acids Research, 2008, 36(Database issue):D440-4.). Enrichment was evaluated with a Fisher Exact test and a p-value <0.05 was used as a threshold.
TABLE 1Gene patterns associated with T...
example 2
[0056]Multiple Chromosomal Amplifications Associated with High Grade, Tamoxifen Resistant Breast Tumors
[0057]Oncogenes found in Table 2 are part of known amplified chromosomal regions also listed in Table 1 as gene patterns associated with poor prognosis. We focused on these patterns by clustering the corresponding correlation matrix. This is displayed as a heatmap in FIG. 2 where we can observe that genes from the same pathway / region tend to be more correlated with each other than the rest. The cell cycle pathway correlates partly with all the amplicons, suggesting that any of these amplicons is associated with increased expression of cell cycle pathway genes. However each amplicon is poorly correlated with each other, unless they are on the same chromosome. These data suggests that the presence of each amplicon is functionally independent of each other and can potentially affect treatment response by amplifying selected oncogenes.
[0058]The association between enrichment of the cel...
example 4
Outlier Analysis of Gene Expression Data Sets
[0062]For each gene, the expression values were median centered and then divided by the median absolute deviation (MAD) as described in Tomlins et al (Tomlins, S. A., et al., Science, 2005, 310(5748):644-8). Median and MAD were used here instead of the usual mean and standard deviation because they are less influenced by the presence of outliers. This step was performed separately for KIT, OXFT and GUYT data sets in order to avoid distribution biases that arise from the merger of separate expression array tables.
[0063]After normalization, outliers were separated in high / low groups, corresponding to samples with normalized values bigger / smaller than 90% and respectively 10% quantiles for each array. This result is organized, across all arrays and data sets, into two binary matrices, B1 and B2, corresponding to high and low outliers. For both matrices, B(i,j)=1 if gene i is found as an outlier in sample j while B(i,j)=0 for the rest.
[0064]I...
PUM
| Property | Measurement | Unit |
|---|---|---|
| Electrical resistance | aaaaa | aaaaa |
| Sensitivity | aaaaa | aaaaa |
Abstract
Description
Claims
Application Information
 - R&D
- Intellectual Property
- Life Sciences
- Materials
- Tech Scout
- Unparalleled Data Quality
- Higher Quality Content
- 60% Fewer Hallucinations
Browse by: Latest US Patents, China's latest patents, Technical Efficacy Thesaurus, Application Domain, Technology Topic, Popular Technical Reports.
© 2025 PatSnap. All rights reserved.Legal|Privacy policy|Modern Slavery Act Transparency Statement|Sitemap|About US| Contact US: help@patsnap.com