Use of blood group status i
a technology of blood group and status, applied in the field of probiotic composition, can solve the problems of large amount of study subjects who have not responded, complex ecosystem, difficult prediction of single probiotic or normal flora species functionality, etc., and achieve the effect of reducing the diversity of bifidobacteria and reducing the amoun
- Summary
- Abstract
- Description
- Claims
- Application Information
AI Technical Summary
Benefits of technology
Problems solved by technology
Method used
Image
Examples
example 1
[0047]Secretor status was determined from the blood samples using the standard in-house blood grouping protocols of Finnish Red Cross Blood Service. Secretor status was determined from 59 individual and 48 were secretors and seven were non-secretors. For 4 samples, secretor status was could not be determined.
example 2
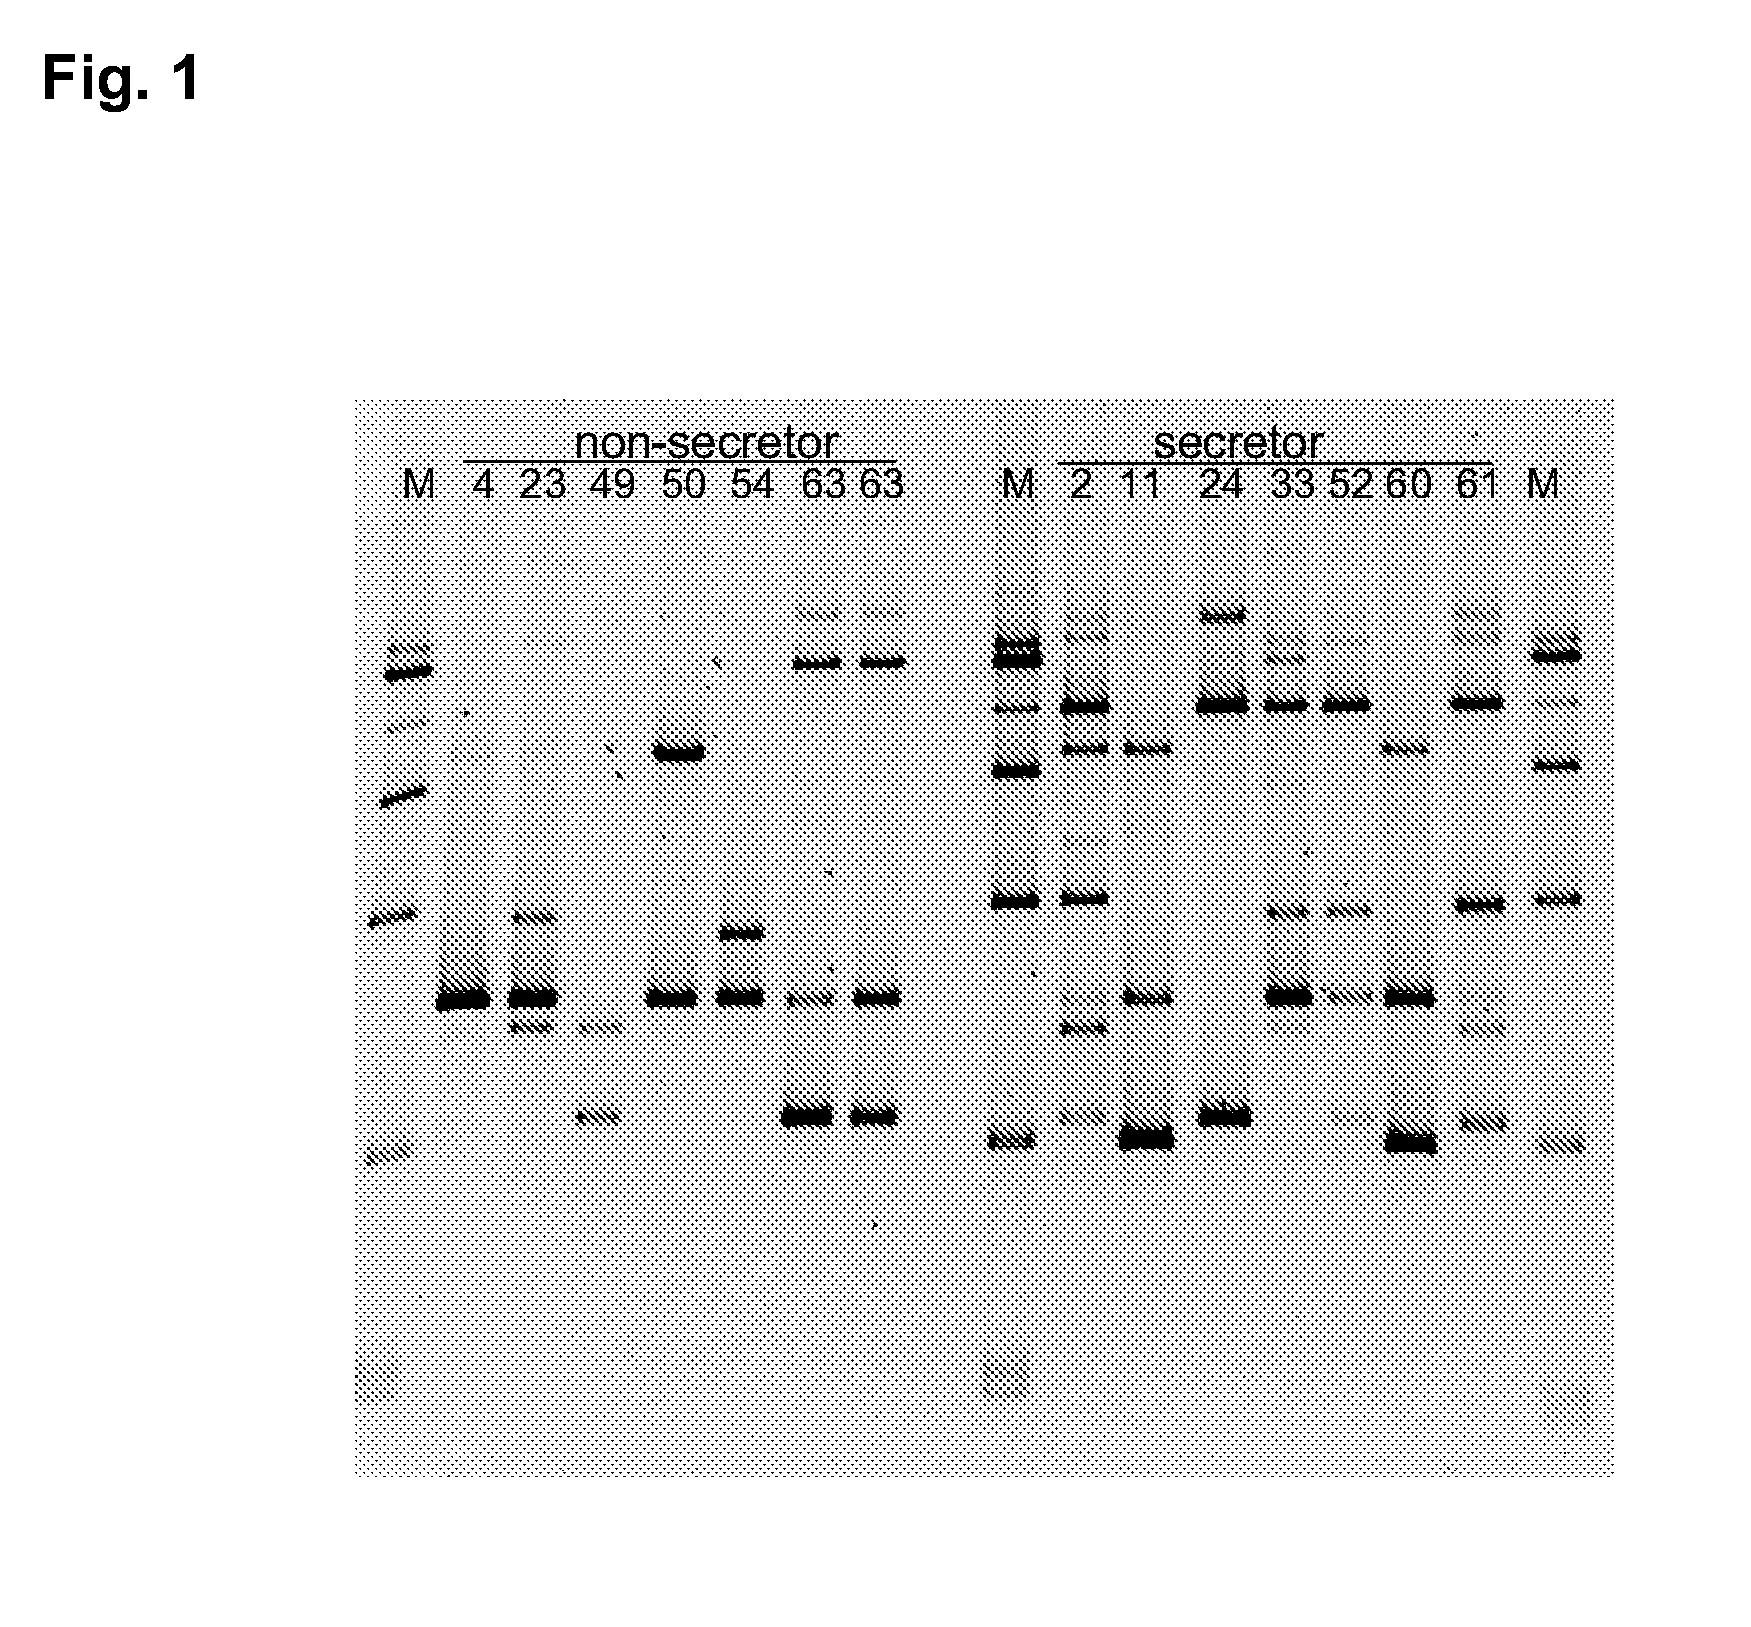
[0048]DGGE analysis targeted for the faecal bifidobacterial population was performed as described above in the material and methods. DGGE gel images showed fewer numbers of bands in the samples obtained from the non-secretor individuals than in the samples from secretor individuals, indicating that fewer bifidobacterial genotypes were present in non-secretor than in secretor individuals. In average, non-secretors had 2.5 (maximum 4) bands and secretors 5.2 bands (maximum 11 bands) in bifidobacterial DGGE profiles. In five samples bifidobacteria were not detected (one non-secretor sample and 4 secretor samples). The Bifidobacterial profiles of all non-secretor individuals and selected bifidobacterial profiles of the secretor individuals are presented in FIG. 1.
example 3
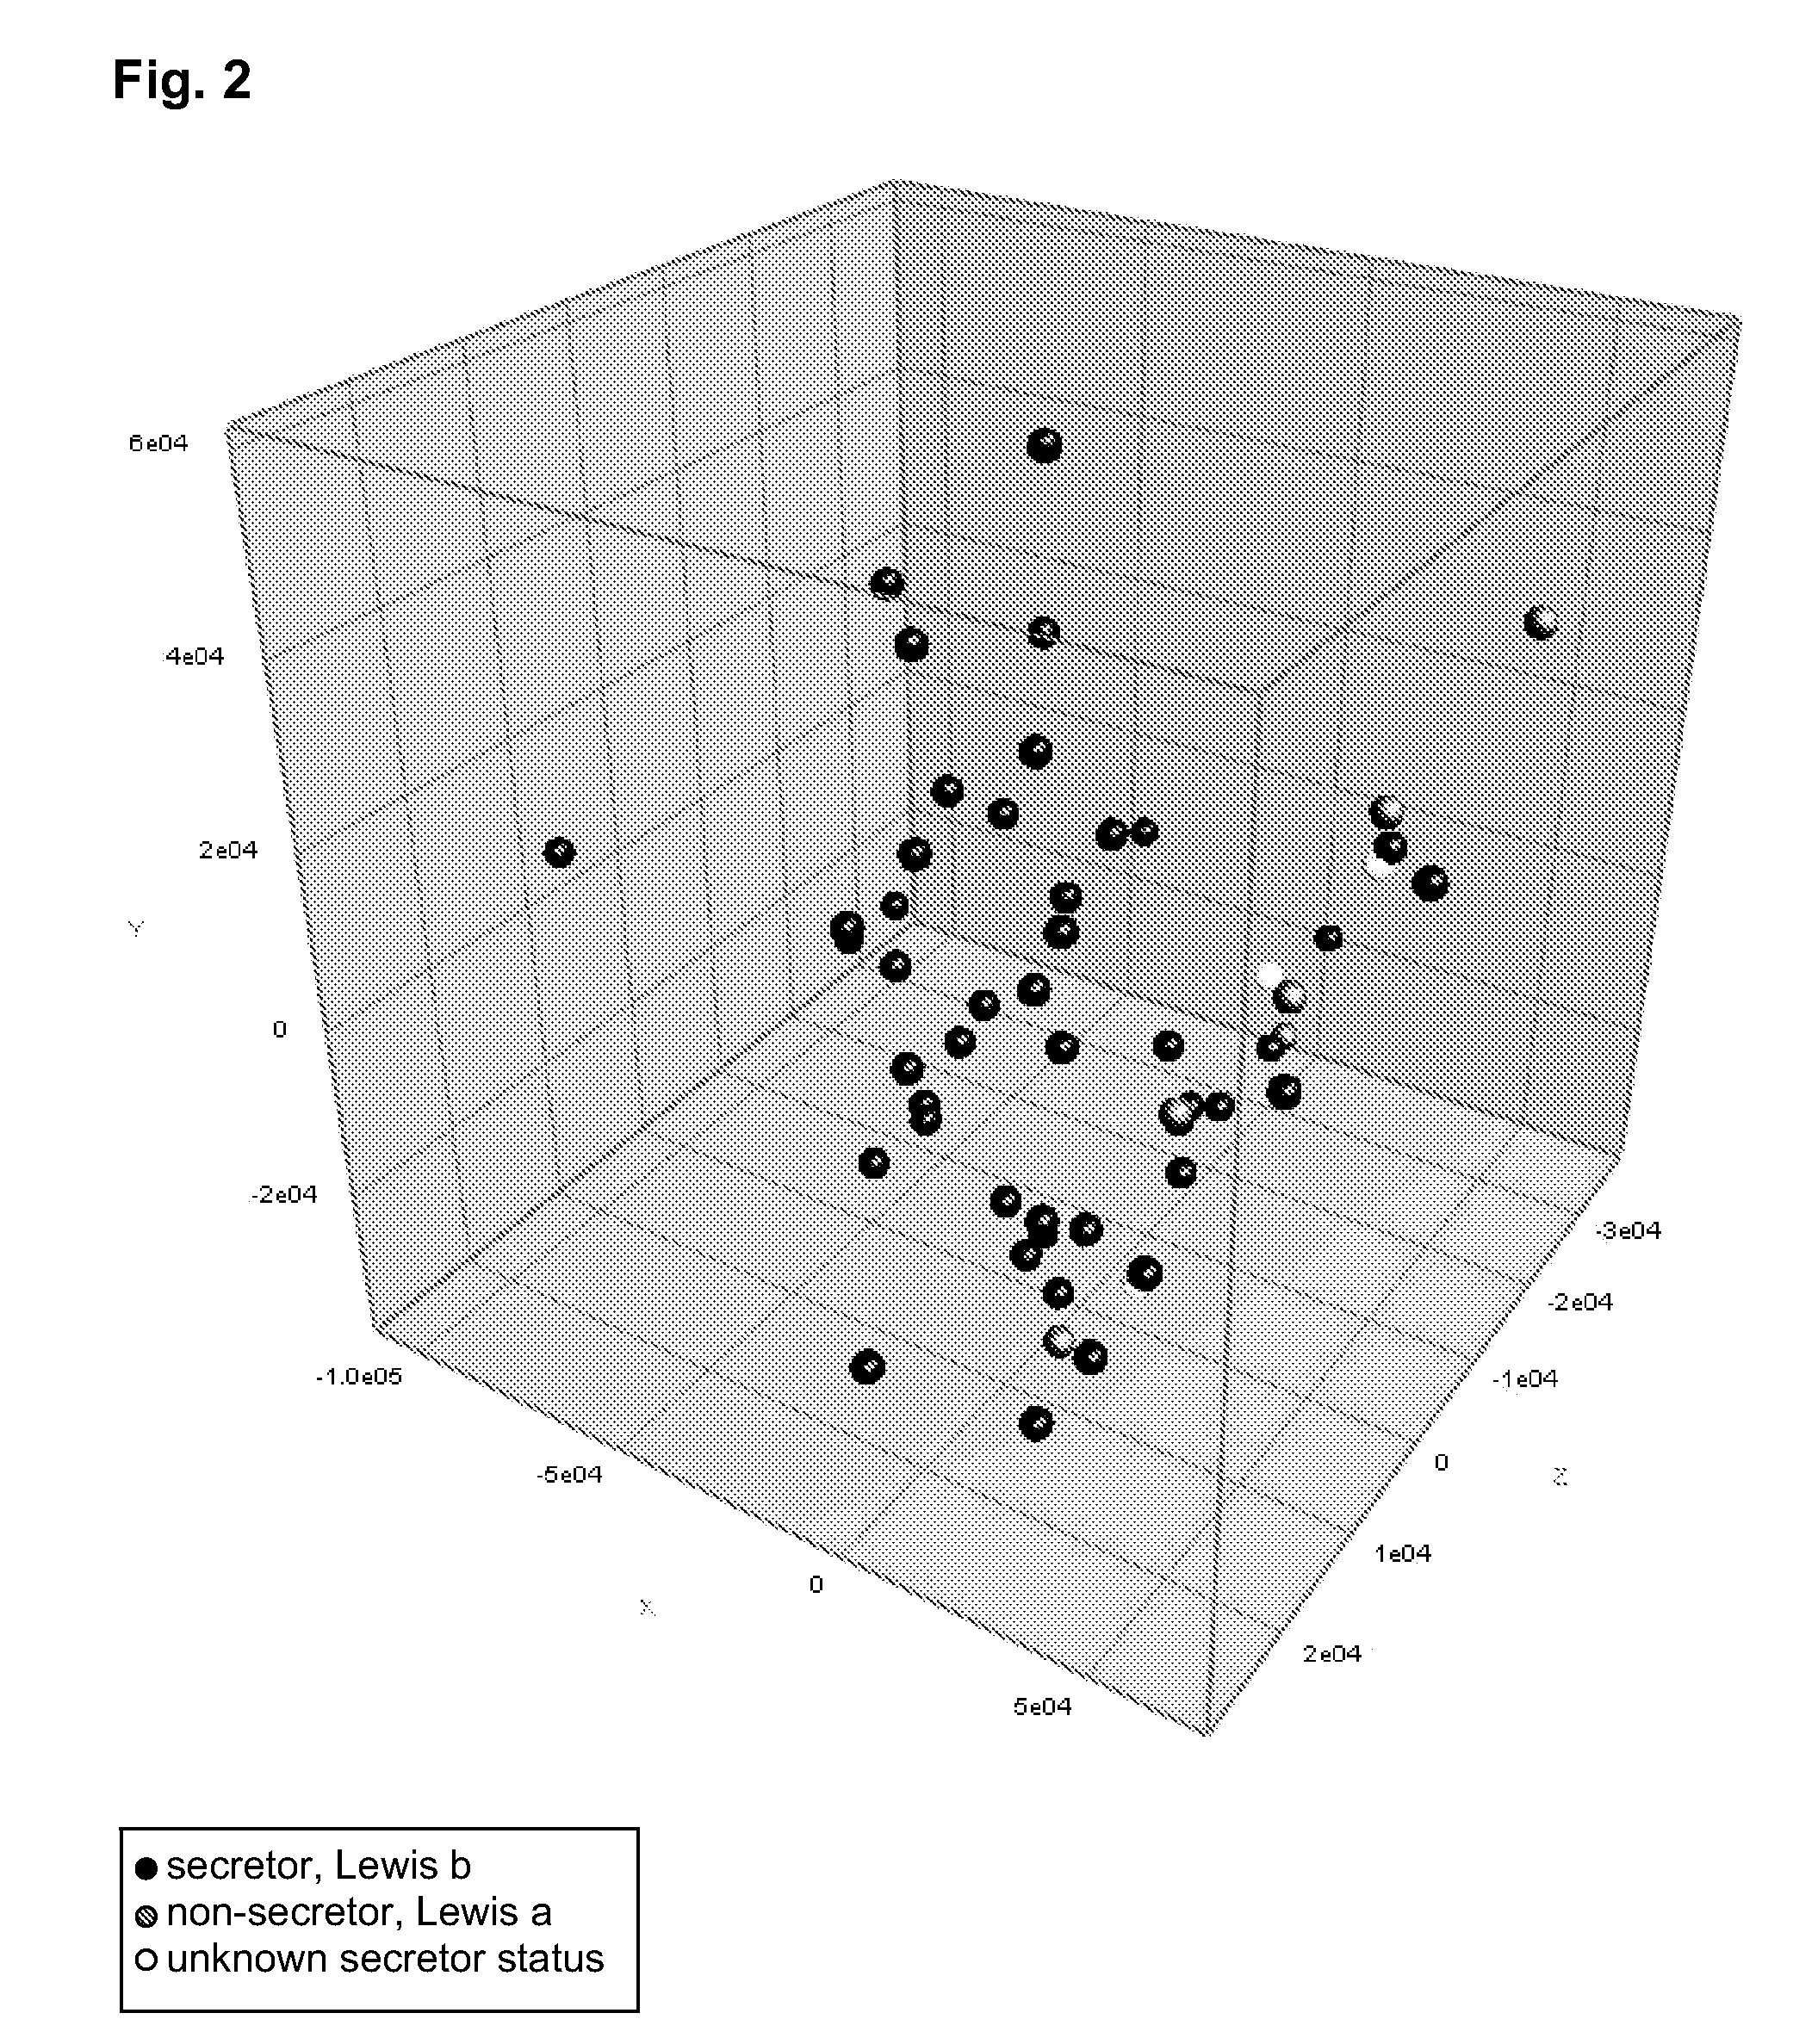
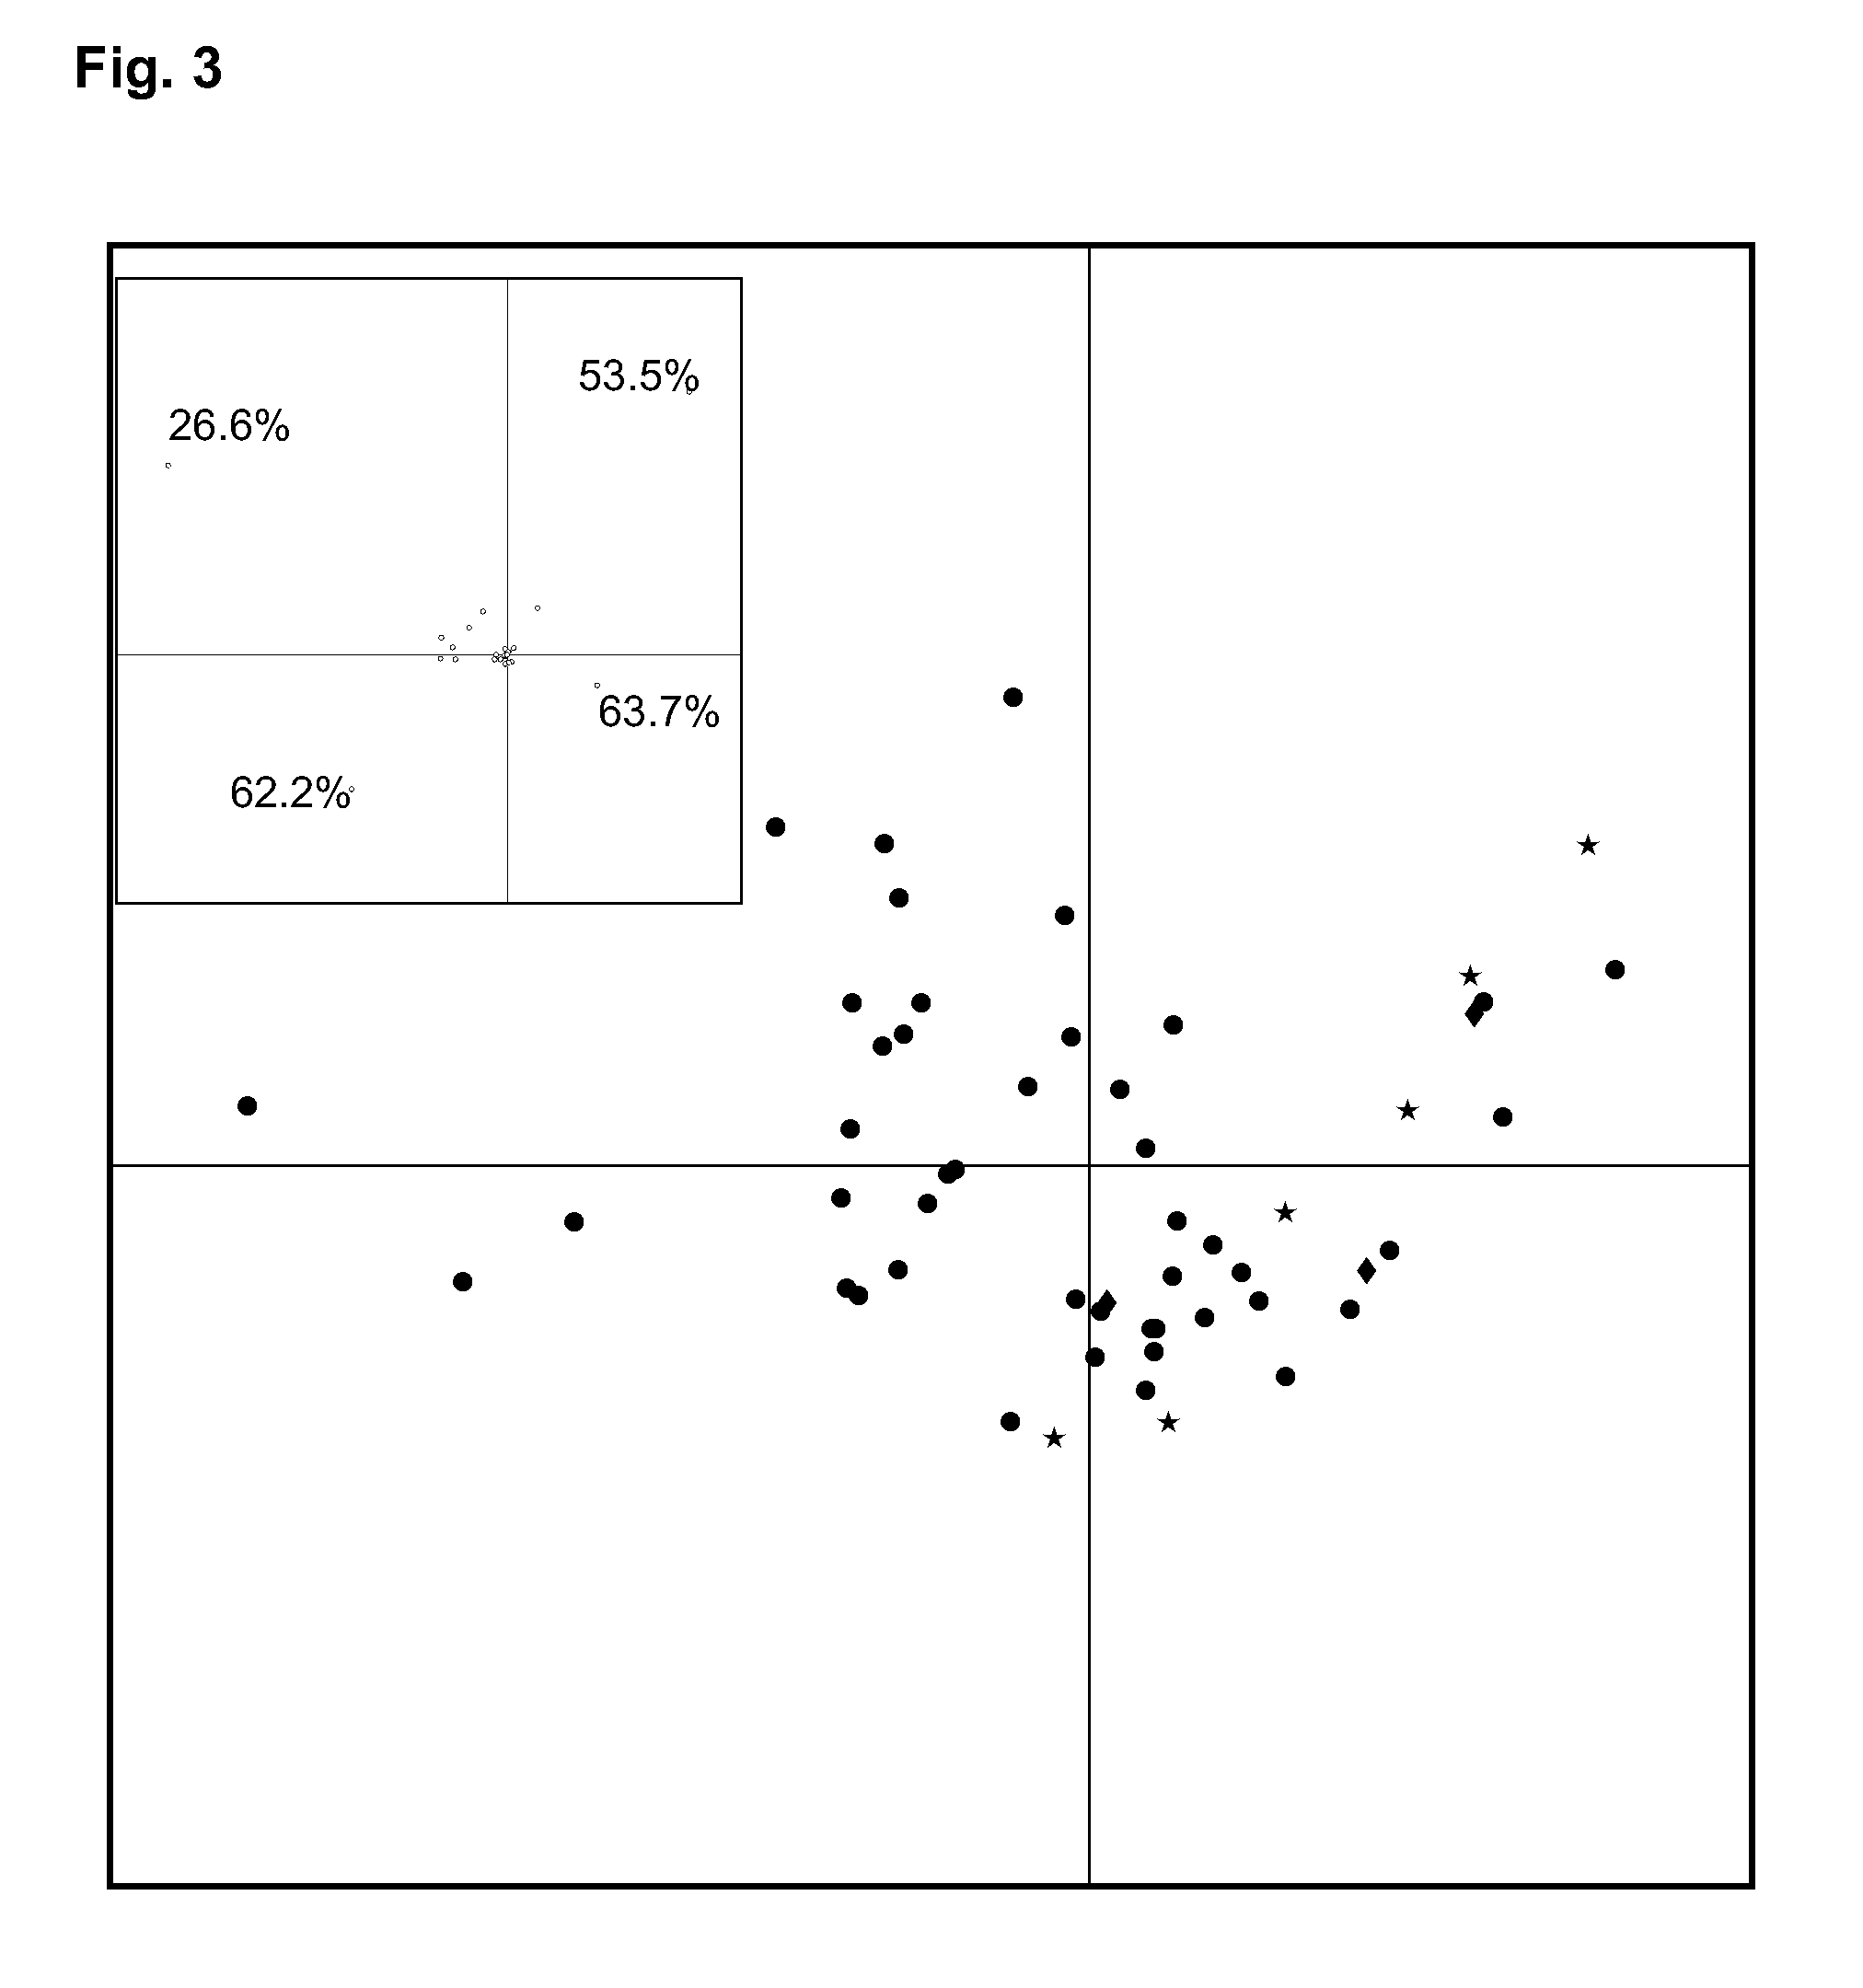
[0049]DGGE analysis targeted for the faecal bifidobacterial population was performed as described above. Principal component analysis (PCA) was performed as implemented in the Bionumerics software package. PCA based on intensities of bands detected by DGGE, was used to ordinate samples and to find out the bands which predominantly contributed to the principal components. Images of DGGE gels were analysed using the Bionumerics to allow statistical analysis between samples. PCA based on intensities of bands in DGGE gels showed grouping of the samples obtained from the non-secretors. The first and second principal component explained of the 56.3% of the total variance. The results are presented in FIG. 2.
PUM
| Property | Measurement | Unit |
|---|---|---|
| composition | aaaaa | aaaaa |
| stability | aaaaa | aaaaa |
| energy | aaaaa | aaaaa |
Abstract
Description
Claims
Application Information
 - R&D Engineer
- R&D Manager
- IP Professional
- Industry Leading Data Capabilities
- Powerful AI technology
- Patent DNA Extraction
Browse by: Latest US Patents, China's latest patents, Technical Efficacy Thesaurus, Application Domain, Technology Topic, Popular Technical Reports.
© 2024 PatSnap. All rights reserved.Legal|Privacy policy|Modern Slavery Act Transparency Statement|Sitemap|About US| Contact US: help@patsnap.com


