
Photoplethysmography device and method

a technology of photoplethysmography and in vivo measurement, applied in the field of system and method for in vivo measurement, can solve problems such as random intensity fluctuations and confusion of values

Inactive Publication Date: 2011-04-07
OXITONE MEDICAL
View PDF4 Cites 62 Cited by
  • Summary
  • Abstract
  • Description
  • Claims
  • Application Information

AI Technical Summary

Benefits of technology

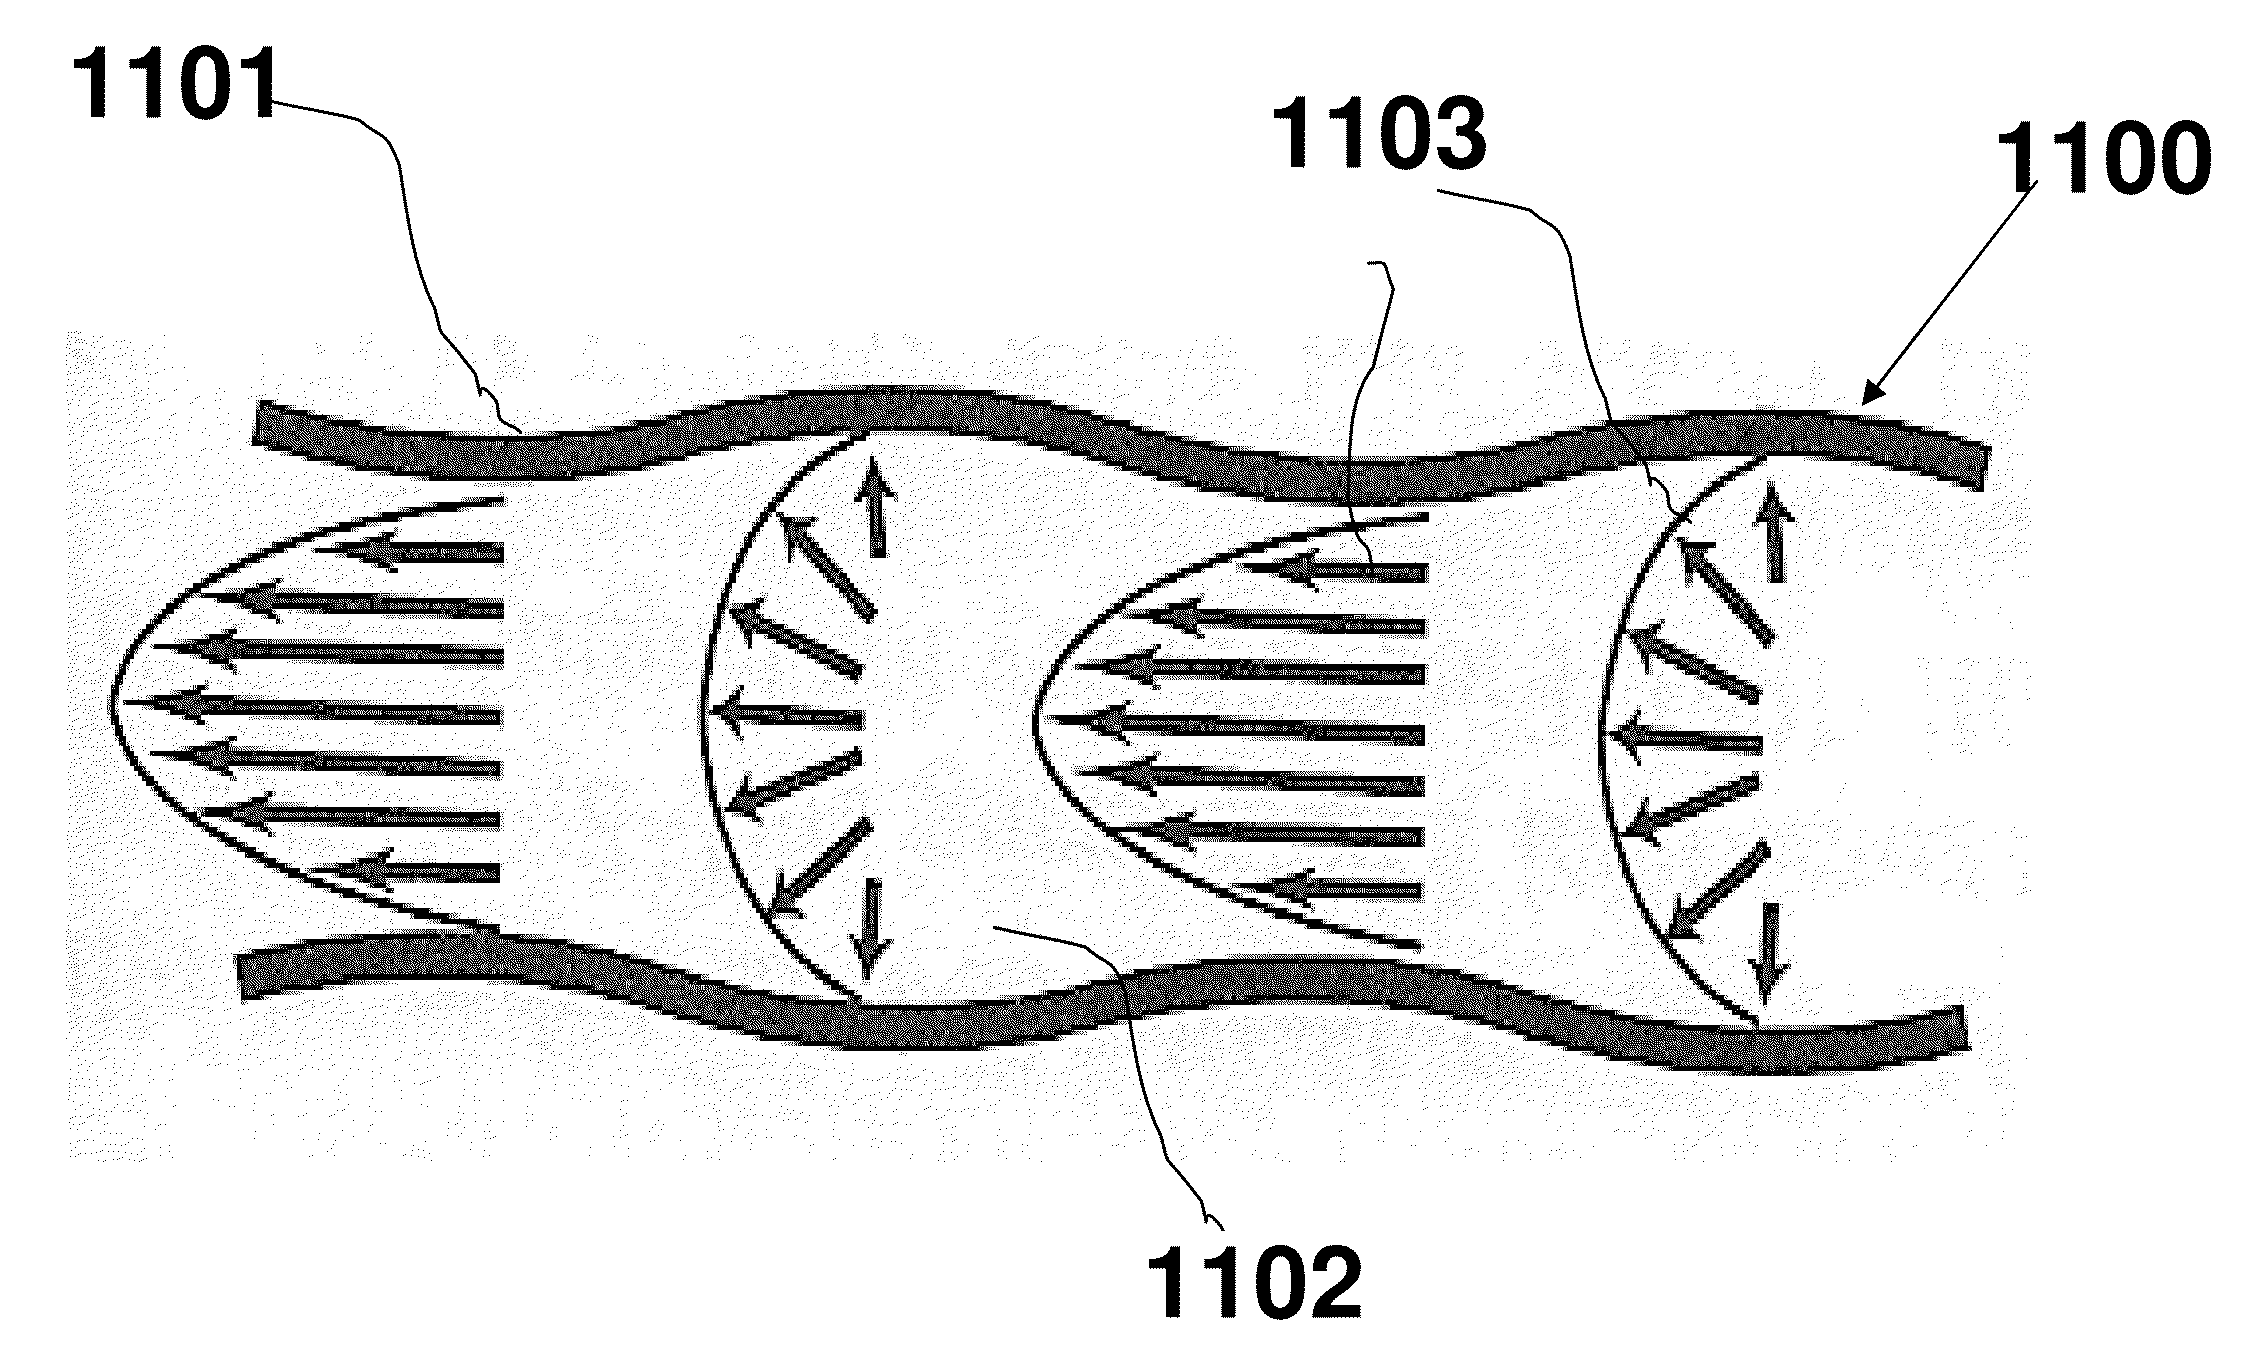
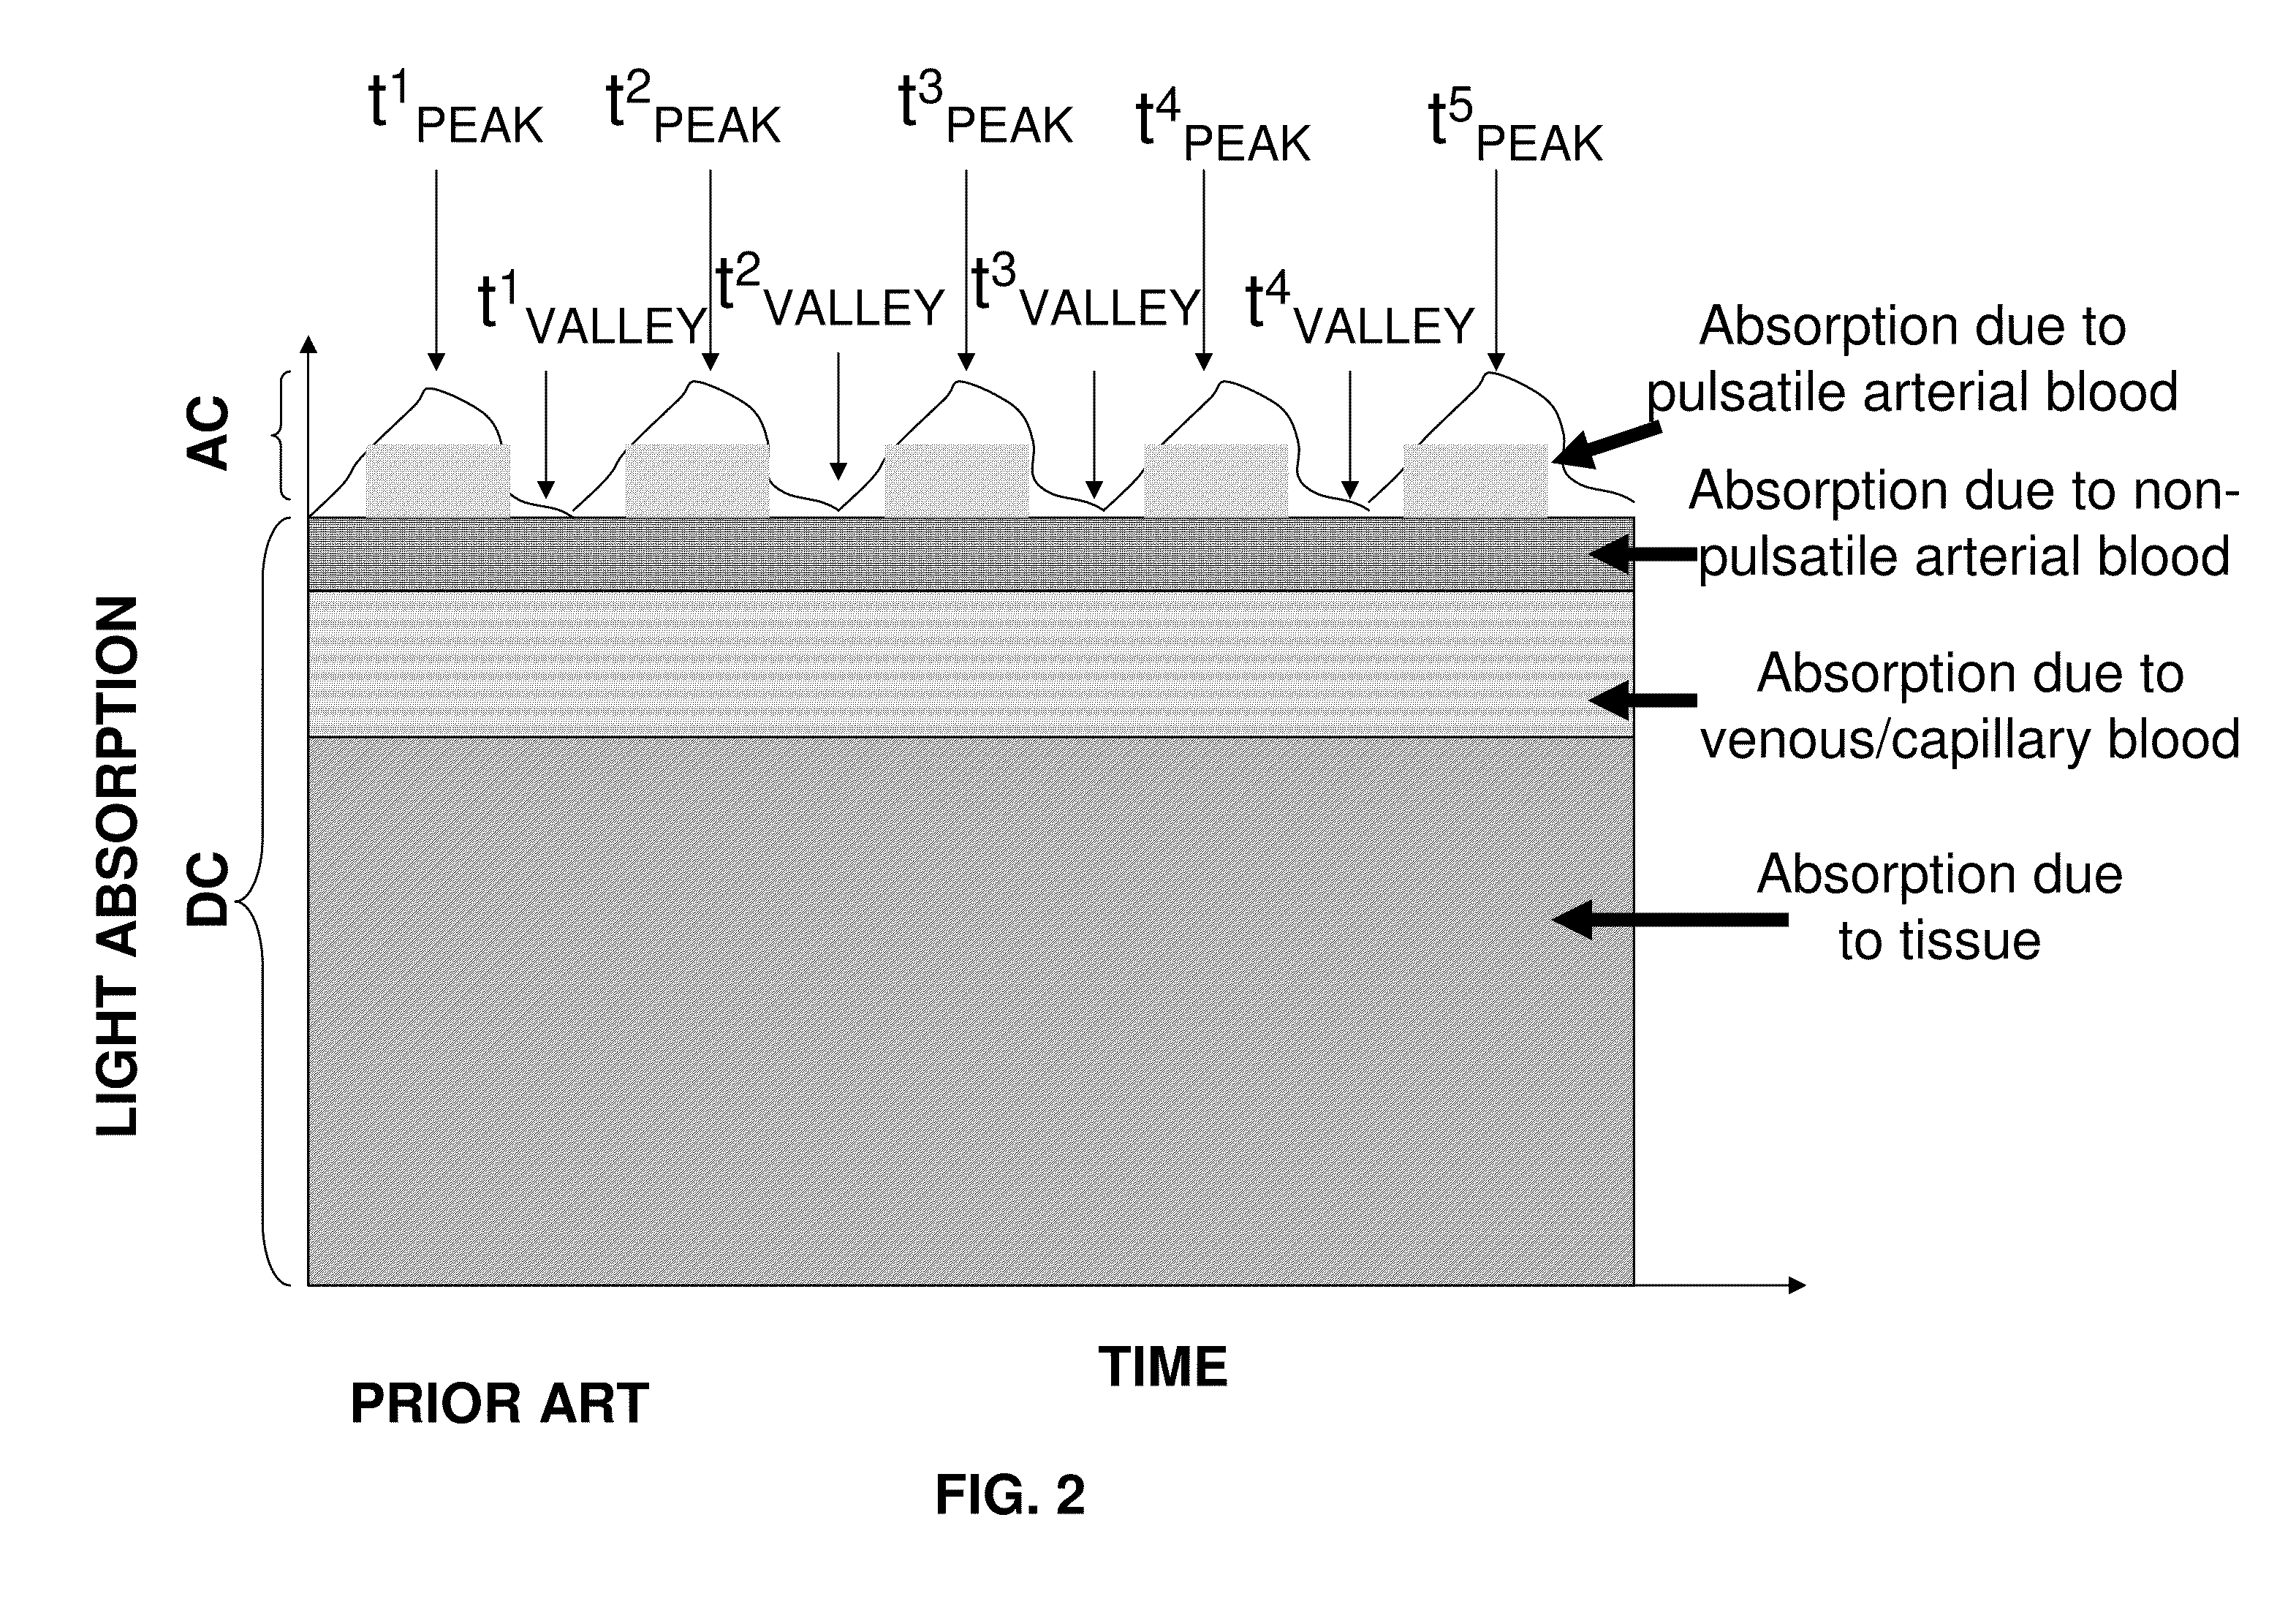
"The present invention relates to a method and apparatus for accurately measuring the concentration of blood analytes, such as oxyhemoglobin and carboxyhemoglobin, in a person's blood. This is achieved by using a technique called DLS (dispersed laser spectroscopy) to measure the flow of blood within small blood vessels in the peripheral blood vessels. The invention is able to determine the timing and wave form of the pulse-induced pressure wave within the peripheral blood vessels, which is accurate and robust to noisy data. This allows for a more accurate interpretation of the pulse-induced local pressure wave and the relative contributions of the AC and DC components to the absorption signal measured by the photoplethysmography device. The invention also suggests a way to synchronize the photoplethysmography data with the DLS data to improve the accuracy of the measurements. Overall, the invention provides a reliable and accurate method for measuring blood analyte concentrations in a person's blood."

Problems solved by technology

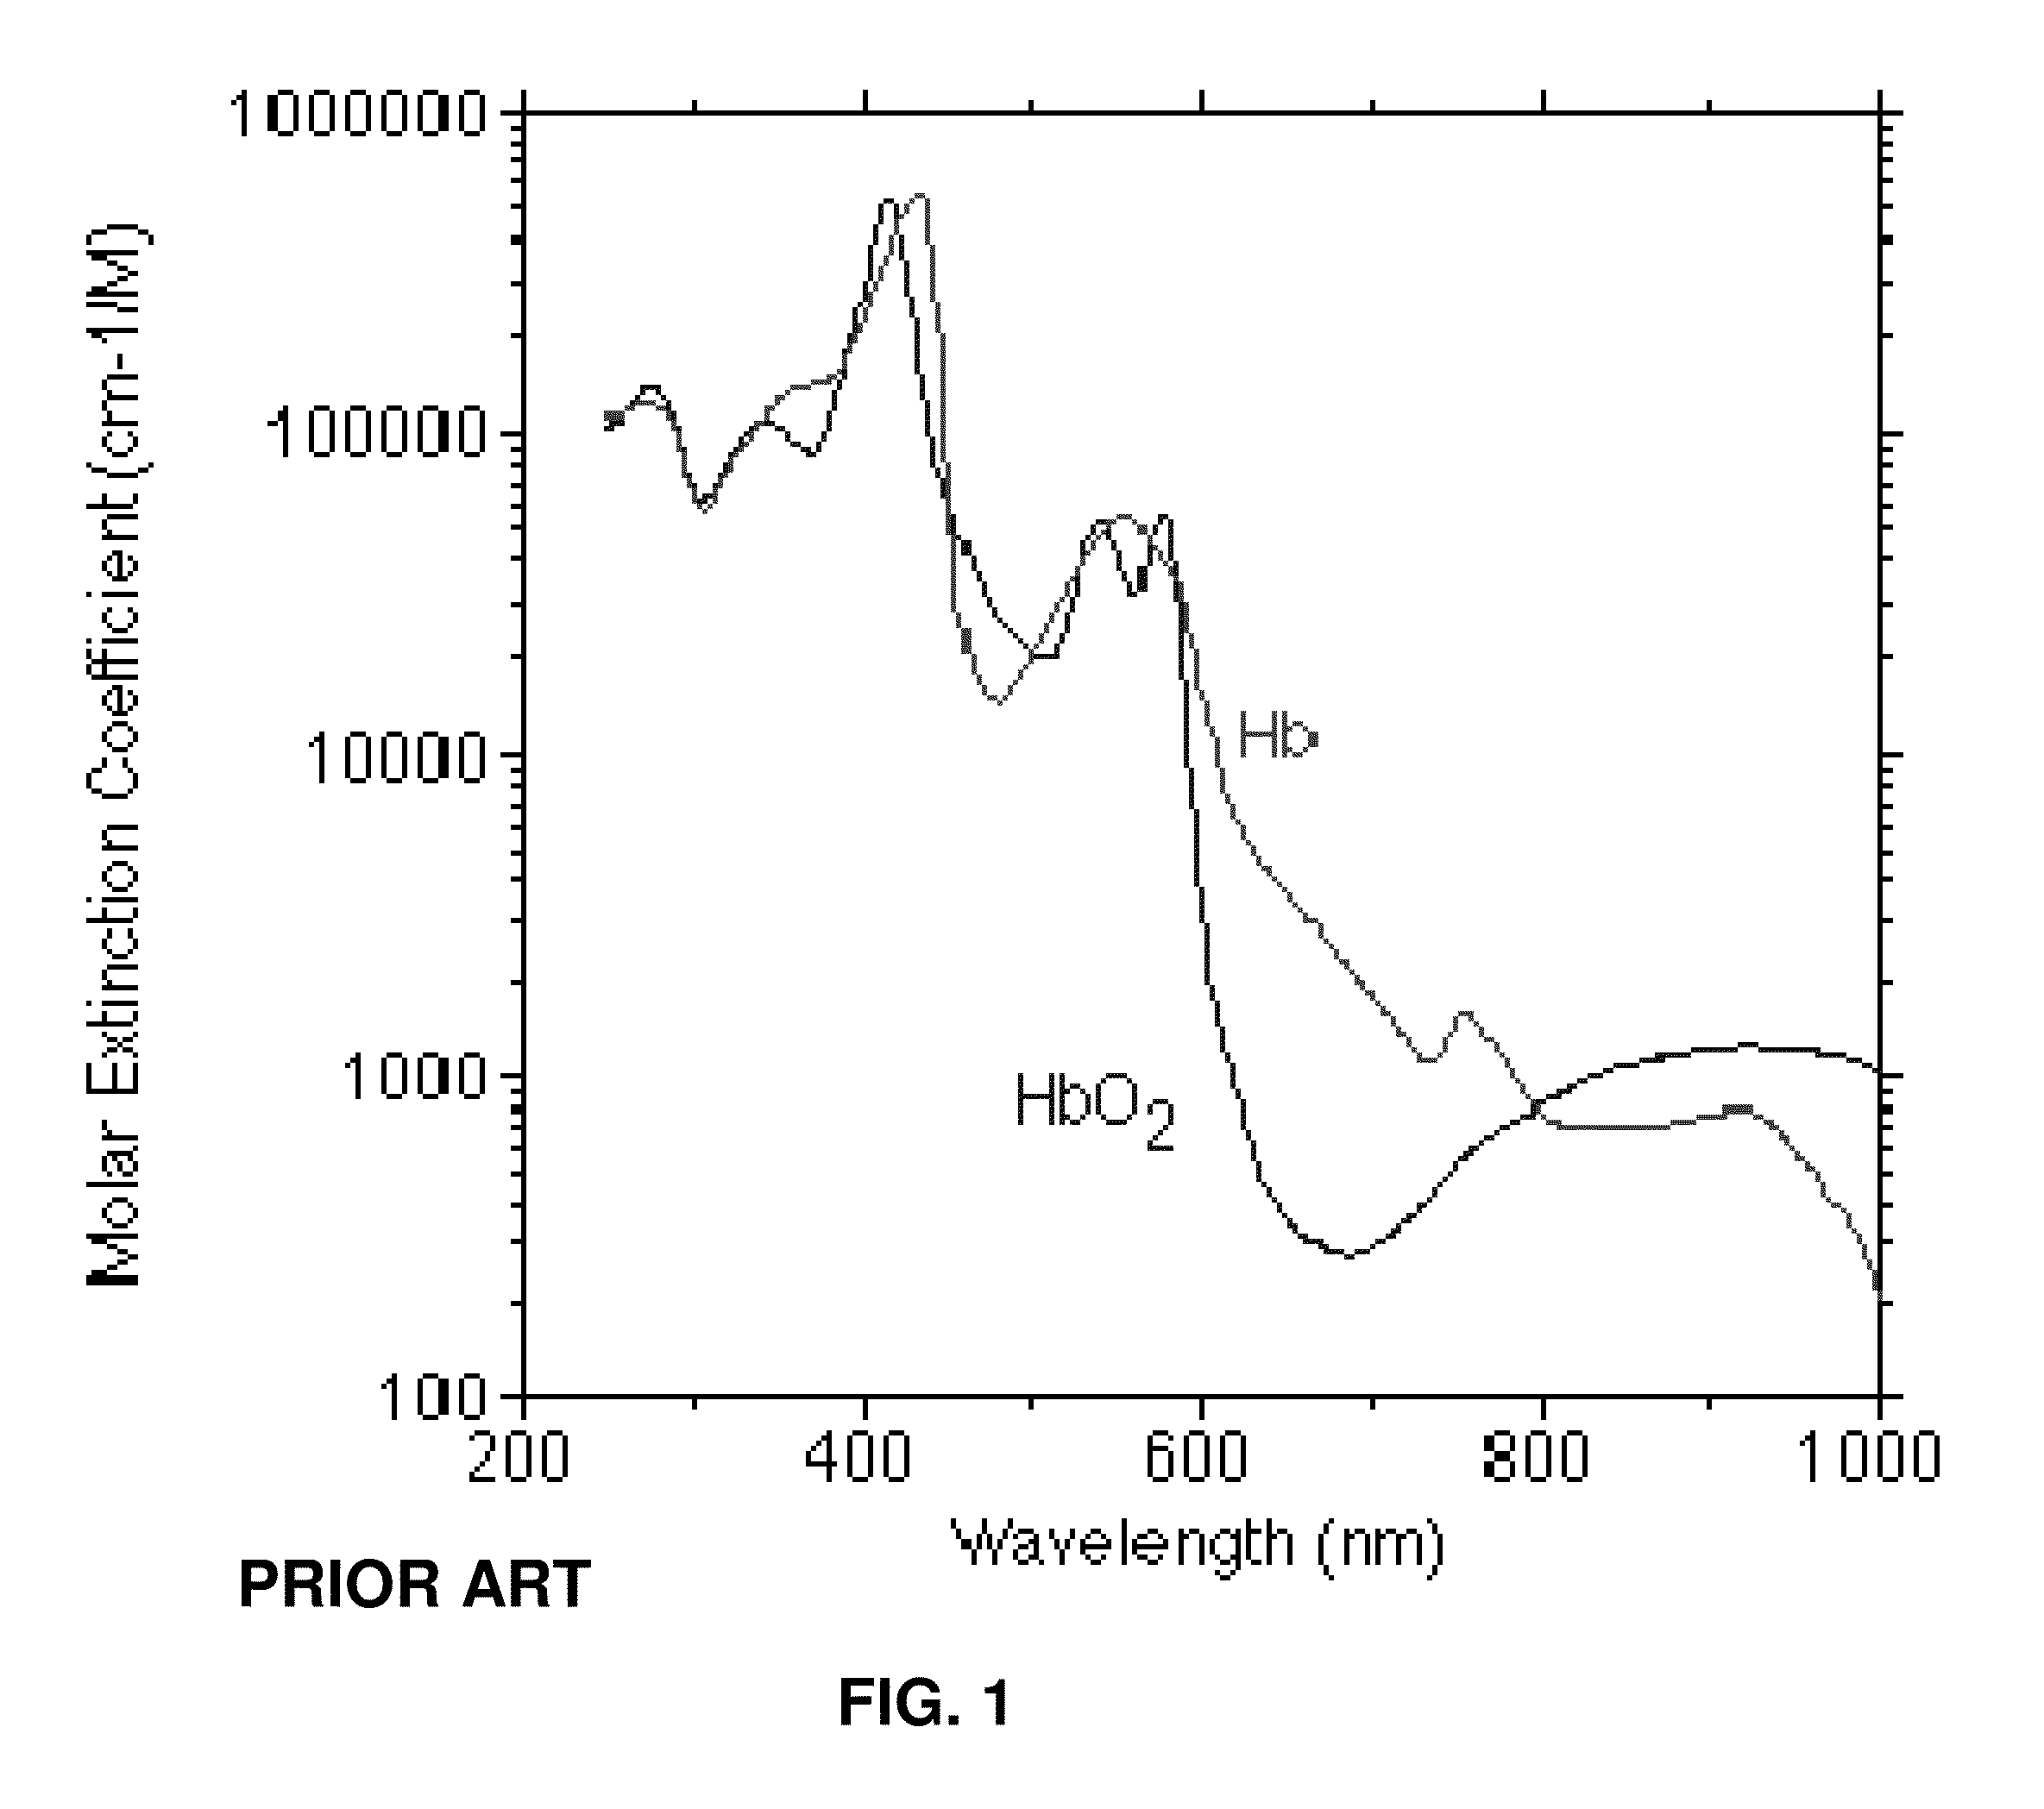
There are several technical problems in accurately estimating oxygen saturation by this method, as scatter, reflection and absorbance of light by other tissue and blood components could confound the values.
This scattered light then undergoes either constructive or destructive interference with the light scattered by surrounding particles that results in the random intensity fluctuations.

Method used


Image

  • Photoplethysmography device and method
  • Photoplethysmography device and method
  • Photoplethysmography device and method

Examples


example 1

Computing a Blood Oxygen Saturation parameter in the Presence of Venous Blood

[0099]The present inventors have constructed a ‘wrist hybrid PPG-DLS’ device and have collected data from this device.

[0100]In FIG. 5 illustrates the results under relatively ‘low motion artifacts’ conditions. Although there is indeed a good correlation between the PPG and the DLS signal, it is nevertheless possible to employ the DLS device to remove the ‘noise’ of the venous blood. This technique may also be used to compute a arterial / venous blood concentration parameter relating the absolute and / or relative concentrations of arterial and venous blood.

[0101]FIGS. 11A-11C relate to the differentiation between venous and arterial components of the measured signal by using the DLS. One important calculated parameter in the pulse-oximetry is the so called Gamma (referred to as a ‘R’ in the background section).

Gamma=(AC(red) / DC(red)) / (AC(infrared) / DC(infrared).

[0102]Where AC is the pulsatile component of the si...

example 2

Computing a Blood Oxygen Saturation Parameter in the Presence of Motion Artifacts

[0111]This example relates to an experiment where motion artifact where introduced (i.e. the subject moved his hand) after about 10 seconds. It is possible to see the strong change of the signal affects the PPG signal after 10 seconds (see FIG. 12A). The same signal may also be shown plotted together with DSL.

[0112]FIG. 12B shows this plot for the first 6 seconds (not many motion artifacts). FIG. 12C is the corresponding histogram plot for the case of the first 6 seconds FIGS. 12D-12E relate to the last 10 seconds during motion of the arm In FIG. 12E, certain PPG measurements are rejected (see, for example, step S365 of FIG. 8B)—the histogram is ‘weighted’

[0113]After taking into consideration the DLS signal by rejected all uncorrelated with PPG values and by choosing an appropriated regions of PPG according to the predetermined limits of DLS value we get in the interval 10-20 second the gamma histogram ...


PUM


Abstract

A system and method for measuring one or more light-absorption related blood analyte concentration parameters of a mammalian subject, is disclosed. In some embodiments, the system comprises: a) a photoplethysmography (PPG) device configured to effect a PPG measurement by illuminating skin of the subject with at least two distinct wavelengths of light and determining relative absorbance at each of the wavelengths; b) a dynamic light scattering measurement (DLS) device configured to effect a DLS measurement of the subject to rheologically measure a pulse parameter of the subject; and c) electronic circuitry configured to: i) temporally correlating the results of the PPG and DLS measurements; and ii) accordance with the temporal correlation between the PPG and DLS measurements, assessing value(s) of the one or more light-absorption related blood analyte concentration parameter(s).

Description

RELATED APPLICATION INFORMATION[0001]This application claims priority from U.S. Provisional Application Ser. No. 61 / 229,741 filed on Jul. 30, 2009.FIELD OF THE INVENTION[0002]The present invention relates to a system and method for in vivo measurement measurements of blood parameters (for example, a light-absorption related blood analyte concentration parameter such as blood oxygen saturation) according to one or more detected biological light response signals.BACKGROUND AND RELATED ARTPulse Oximetry[0003]Pulse oximeter devices based on photoplethysmography techniques are well known in the art. Wikipedia defines pulse oximetry as “a non-invasive method allowing the monitoring of the oxygenation of a patient's hemoglobin.”[0004]Wikipedia describes usage of pulse oximeter devices as follows:[0005]A sensor is placed on a thin part of the patient's body, usually a fingertip or earlobe, or in the case of a neonate, across a foot, and a light containing both red and infrared wavelengths i...

Claims


Application Information

Patent Timeline
Patent Type & Authority Applications(United States)
IPC IPC(8): A61B5/1455
CPCA61B5/14551A61B5/7239A61B5/7285A61B5/7207
Inventor EISEN, LEONKAMISNKY, ALEXANDERFINE, ILYA
Owner OXITONE MEDICAL
Learn More