
Spectroscopy having correction for broadband distortion for analyzing multi-component samples

a multi-component sample and broadband distortion technology, applied in the field of spectroscopy, can solve the problems of non-measurable non-corrective algorithm, non-measurable non-corrective algorithm, and general non-use of ftir spectroscopic systems for online sensing,

Active Publication Date: 2010-09-30
HONEYWELL ASCA INC
View PDF4 Cites 9 Cited by
  • Summary
  • Abstract
  • Description
  • Claims
  • Application Information

AI Technical Summary

Benefits of technology

[0006]The Present Inventors have discovered that using spectral information from one or more reference wavebands which are away from absorption peaks of the first chemical component along with the conventional measure waveband information which is proximate to an absorption peak of the first chemical component, provides the ability to correct for undesirable measurement effects that cause broadband distortion of an absorption spectrum. Such effects include, but are not limited to, optical scattering, broadband absorption, scattering due to surface morphology and / or topology. The multi-component sample can be a liquid, gas or a solid, or be a mixed phase sample (e.g. moisture in a powder).

Problems solved by technology

However, FTIR spectroscopic systems are generally not used for online sensing due to their known environmental sensitivity (e.g. vibration, temperature swing, etc).
In comparison, the moisture measurement of the same material performed using a standard, non-corrective algorithm was found not to be measurable (i.e. a measurement error of over 100% (2-sigma) for each grade of powder.
In comparison, the total thickness of the same material performed using a standard non-corrective algorithm was found not to be measurable (i.e. a measurement error of over 100% (2-sigma).

Method used

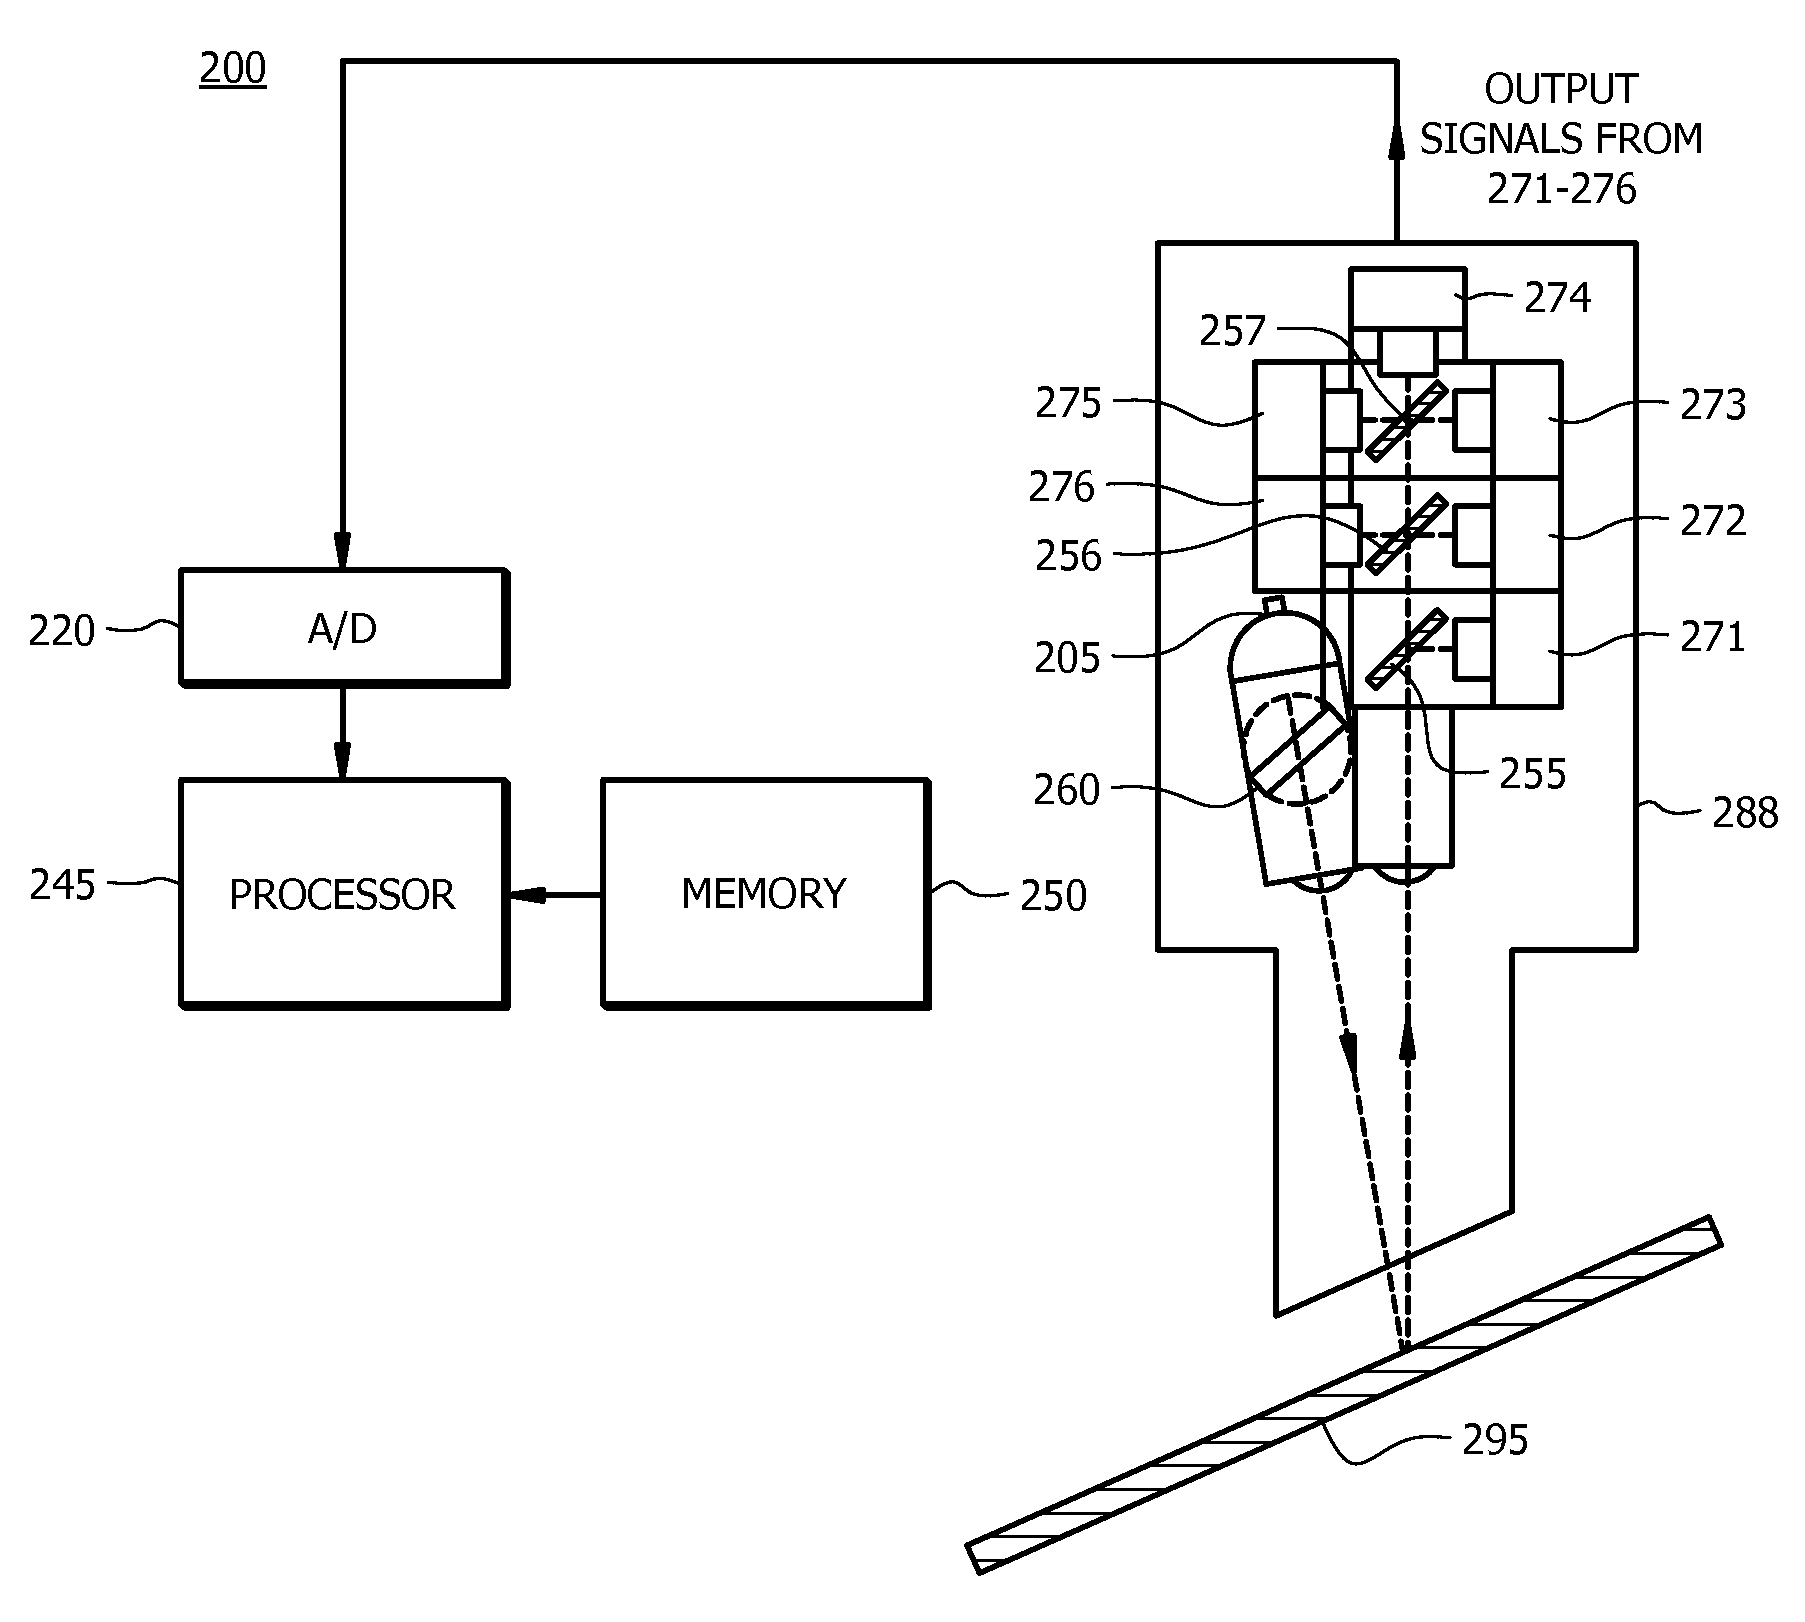
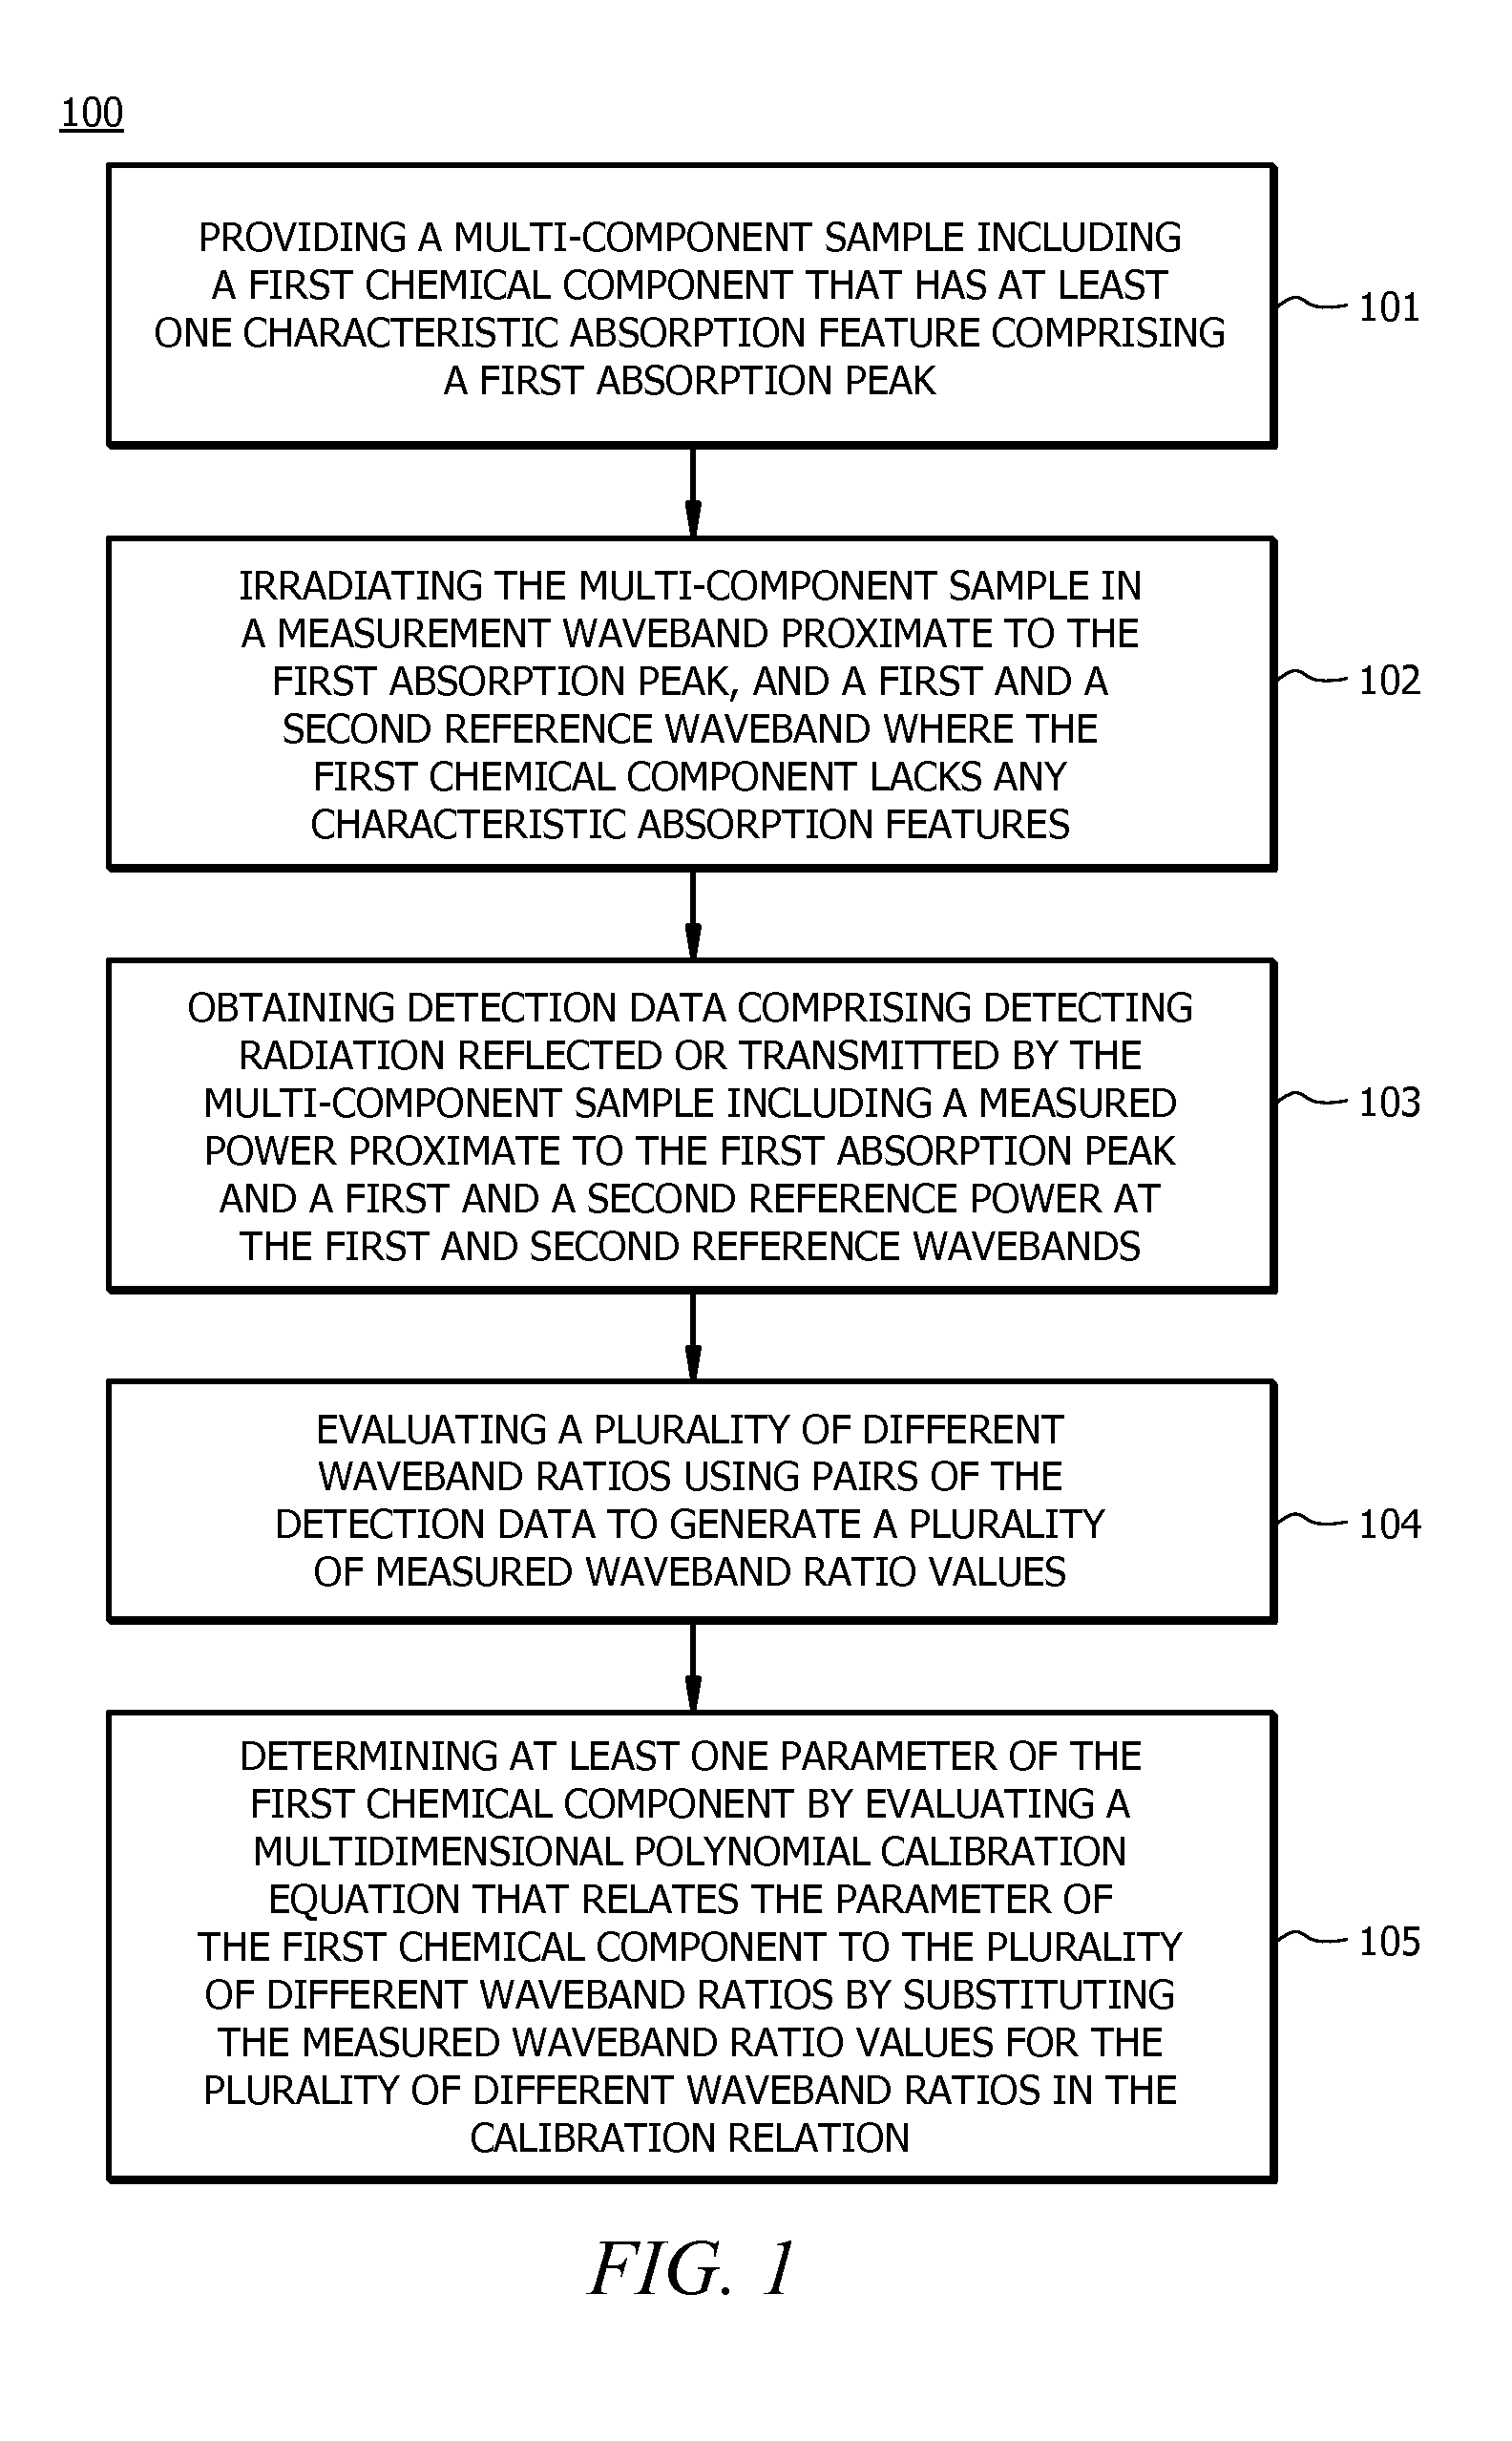
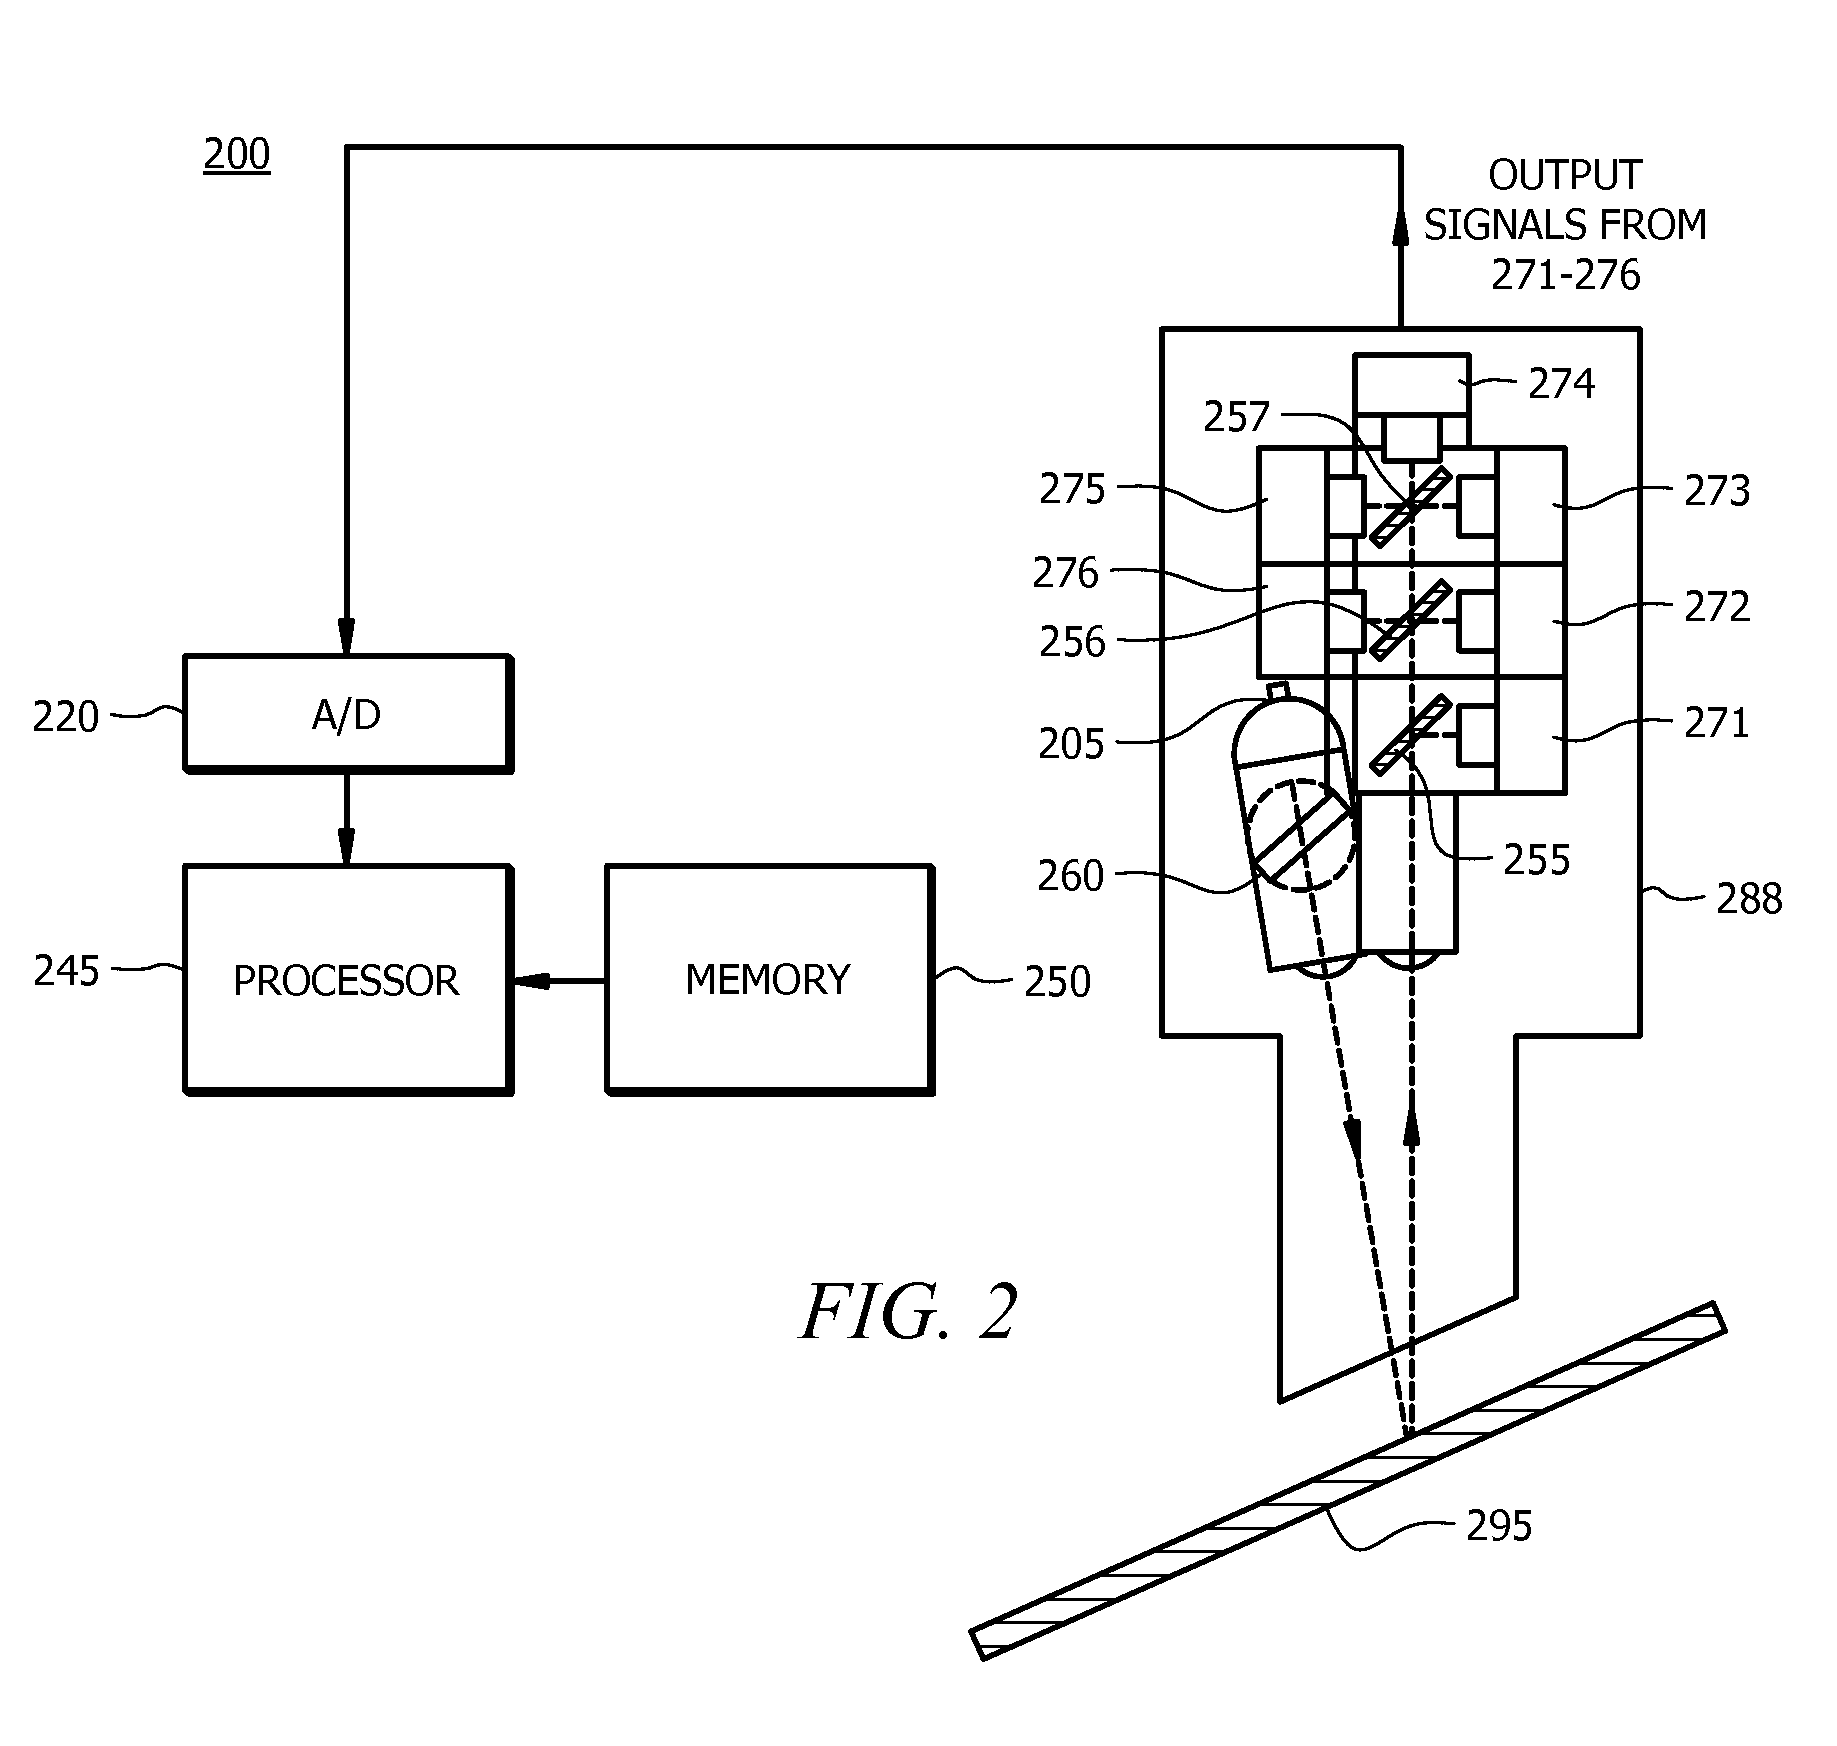

Image

  • Spectroscopy having correction for broadband distortion for analyzing multi-component samples
  • Spectroscopy having correction for broadband distortion for analyzing multi-component samples
  • Spectroscopy having correction for broadband distortion for analyzing multi-component samples

Examples


example 1

Measurement of Moisture in White Mineral-Based Powder

[0032]In this example, moisture was measured for three (3) different types of powder using a fixed-filter, non-dispersive, reflection mode spectroscopic sensor. The exact nature of the differences between the types of powder are not material to this example, but each led to different scattering behavior, and hence different functional forms of the calibration equation. All data was collected simultaneously at two (2) reference wavelengths (1.3 and 1.8 μm), as well as at the 1.4 μm and 1.9 μm water absorption peaks (measure wavelengths). A three (3) dimensional 2nd order fit was defined by the following general equation:

M=aX+bY+cZ+dX2+eY2+fZ2+g

[0033]where M is the moisture content (e.g. wt. % moisture) as measured by the sensor, a, b, c, d, e, f and g are calibration parameters, and X, Y, Z are the WRs (variables). The above equation is 3-dimensional due to the use of three (3) WRs (X, Y and Z), and the equation is second order du...

example 2

Measurement of Thickness of TiO2-Doped PET

[0034]In this example, the total thickness of polyethylene terephthalate sheet, doped with a mineral whitener (TiO2), was measured using a fixed-filter, non-dispersive, transmission mode spectroscopic sensor. The mineral whitener leads to scattering of the near-infrared light and consequent deformation of the absorption spectrum. This scattering was corrected using an algorithm according to an embodiment of the invention. After establishing a calibration relation using samples of known thickness, the total thickness in the range from 25 to 70 microns was measured in random samples with an accuracy of less than 1 micron, generally being within 1.0% (2-sigma). In comparison, the total thickness of the same material performed using a standard non-corrective algorithm was found not to be measurable (i.e. a measurement error of over 100% (2-sigma).

[0035]As known in the art, the thickness parameter may be obtained from a mass-per-unit-area paramet...


PUM


Abstract

A spectroscopic method and spectroscopy system therefrom for analyzing samples. A sample includes a first chemical component that has a characteristic first absorption peak is provided. The sample is irradiated in a measurement waveband proximate to the first absorption peak, and at a first and a second reference waveband where the first chemical component lacks characteristic absorption features. Reflected or transmitted detection data is obtained including a measured power proximate to the first absorption peak and first and second reference powers at the reference wavebands. A plurality of different waveband ratios are evaluated using pairs of detection data to generate a plurality of measured waveband ratio values. A parameter of the first chemical component is then determined by evaluating a multidimensional polynomial calibration equation that relates the parameter of the first chemical component to the plurality of different waveband ratios by substituting the measured waveband ratio values into the calibration relation.

Description

FIELD OF THE INVENTION[0001]Embodiments of the invention relate to spectroscopy, and in particular to correction of distortion effects when measuring the absorption spectrum for multi-component samples.BACKGROUND[0002]Spectroscopy refers to the measurement of a quantity based on the interaction between radiation and matter as a function of wavelength or frequency of the radiation. An optical spectrometer is a device that irradiates a sample and analyzes reflected / scattered or transmitted radiation by frequency (or wavelength) components and by their power or intensities. In general, there are two types of spectrometers, dispersive and non-dispersive (e.g. discrete filter or interferometric).[0003]As known in the art of spectroscopy, there are a variety of effects that can cause broadband distortion of the absorption spectrum. Such effects can include, but are not limited to, optical scattering, broadband absorption, scattering due to surface morphology and / or topology.SUMMARY[0004]T...

Claims


Application Information

Patent Timeline
Patent Type & Authority Applications(United States)
IPC IPC(8): G01J5/02G01J1/42G01J3/00
CPCG01J3/02G01J3/0208G01J3/027G01J3/0297G01J3/36G01J3/427G01N2201/1293G01N21/3554G01N21/3563G01N21/359G01N2021/3137G01N2021/3166G01N2021/3188G01N21/274G01J3/28
Inventor HARAN, FRANK M.DREES, REENA MEIJERTIXIER, SEBASTIEN
Owner HONEYWELL ASCA INC
Learn More