
Use of biomarkers for the diagnosis and prognosis of lung cancer

a biomarker and lung cancer technology, applied in the field of lung cancer diagnosis and prognosis, can solve the problems of high mortality, no reliable early detection method, and concomitant changes in protein expression

Inactive Publication Date: 2010-09-23
THE HONG KONG POLYTECHNIC UNIV
View PDF2 Cites 17 Cited by
  • Summary
  • Abstract
  • Description
  • Claims
  • Application Information

AI Technical Summary

Benefits of technology

[0006]According to another aspect, a method of determining the effectiveness of a treatment diagnosed with cancerous lung tissues may include measuring the expression of at least one biomarker in a first biological sample from the patient before treatment, measuring the expression of the at least one biomarker in a second biological sample from the same patient taken during the treatment, comparing the expression of the first sample against a normal value, and comparing the expression of the second sample after treatment against the normal value. When a differential expression of the at least one biomarker between the first sample and the normal value is more than 1.5-fold than a differential expression of the at least one biomarker between the second sample and the normal value, the treatment is effective.

Problems solved by technology

These manifestations may bring about concomitant changes in expression of proteins, including their formation, concentrations and interactions with other molecules in the cancerous tissues.
Occurrence of NSCLC is usually diagnosed at a late stage, resulting in high mortality.
While early detection of NSCLC is a crucial step to decrease the high mortality rate, there are currently no reliable methods for early detection.
However, these tests can only detect the occurrence of lung cancer at a relatively late stage.
Furthermore, because of the limitations imposed on equipment and the establishments required, these methods are not suitable for large-scale diagnostic screening.

Method used


Image

  • Use of biomarkers for the diagnosis and prognosis of lung cancer
  • Use of biomarkers for the diagnosis and prognosis of lung cancer
  • Use of biomarkers for the diagnosis and prognosis of lung cancer

Examples


examples 1

Expression of Amyloid P Component in NSCLC Tissues and its Adjacent Non-Tumor Tissues

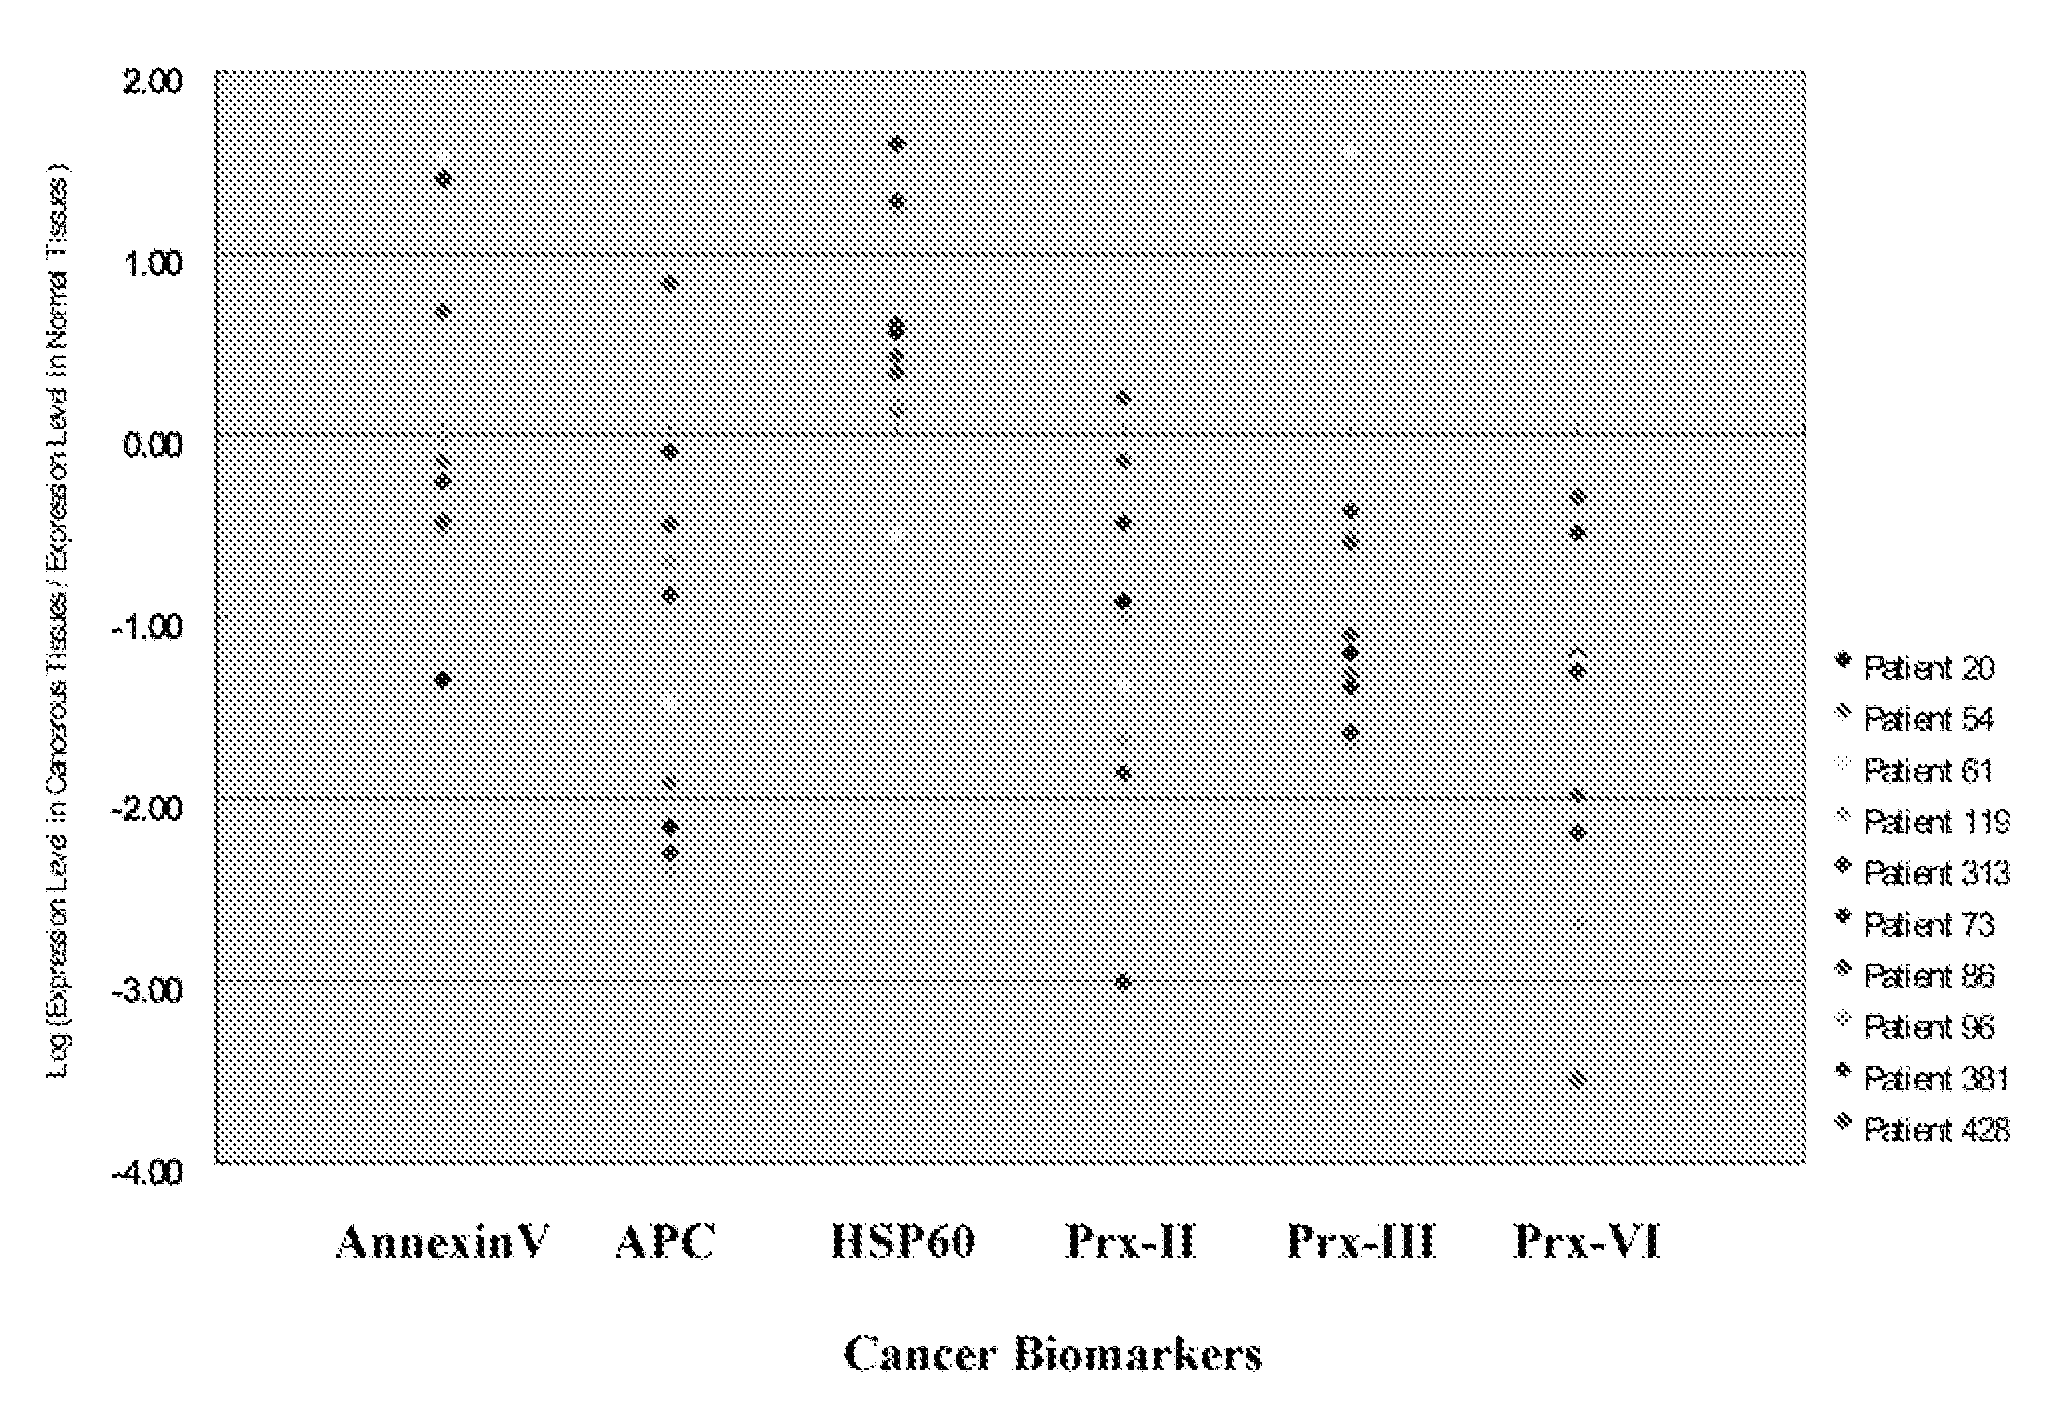
[0183]An immunoreactive band for amyloid P component (APC) with an apparent molecular weight of about 25 kDa was specifically detected in tumor (T) and non-tumor tissues (N), as shown in FIG. 21A. The band intensities were quantified by their black light units (BLU). The relative expression level of amyloid P component was normalized equally by the internal control, β-actin in either tumor tissues or the paired non-tumor tissues prior to comparison. This was because the lung tissue samples had various degrees of haemolysis, and the amounts of stable expressed tissue protein, β-actin, may vary greatly in the analyzed tissue samples.

[0184]After normalizing with β-actin, the relative expression level of amyloid P component was reduced with more than 1.5-fold in eight of out ten tumors analyzed when compared to the adjacent non-tumor tissues, as depicted in FIG. 21B. Only one of the samples, patient no....

example 2

Expression of Chaperonin in NSCLC Tissues and its Adjacent Non-Tumor Tissues

[0186]An immunoreactive band for chaperonin with an apparent molecular weight of about 60 kDa was specifically detected in tumor (T) and non-tumor tissues (N), as shown in FIG. 22A. The relative expression level of chaperonin was normalized equally by the internal control, β-actin in either tumor tissues or the paired non-tumor tissues prior to comparison.

[0187]The relative expression level of chaperonin was increased with more than 1.5-fold in seven out of ten tumors analyzed when compared to the adjacent non-tumor tissues, as depicted in FIG. 22B. A decreased expression was only found in one of the samples, patient no. 61. No significant changes were observed in patient nos. 54 and 96.

[0188]The data has therefore shown that chaperonin may be used as a biomarker for identifying, diagnosing, and monitoring cancerous lung tissues.

example 3

Expression of Peroxiredoxin II in NSCLC Tissues and its Adjacent Non-Tumor Tissues

[0189]An immunoreactive band for peroxiredoxin II with an apparent molecular weight of about 25 kDa was specifically detected in tumor (T) and non-tumor tissues (N), as shown in FIG. 23A. The relative expression level of peroxiredoxin II was normalized equally by the internal control, β-actin in either tumor tissues or the paired non-tumor tissues prior to comparison.

[0190]The relative expression level of peroxiredoxin II was decreased with more than 1.5-fold in eight out of ten tumors analyzed when compared to the adjacent non-tumor tissues, as depicted in FIG. 23B. No significant changes were observed in patient nos. 86 and 428.

[0191]The data has therefore shown that peroxiredoxin II may be used as a biomarker for identifying, diagnosing, and monitoring cancerous lung tissues.


PUM

PropertyMeasurementUnit
molecular weightaaaaaaaaaa

Abstract

A method for identifying, diagnosing, and monitoring cancerous lung tissues in a subject may include measuring the expression of at least one biomarker in a biological sample in the subject, and comparing the expression against a normal value. When a differential expression of the at least one biomarker between the biological sample and the normal value is more than 1.5-fold, the lung tissue sample is cancerous. The at least one biomarker is selected from the group consisting of peroxiredoxin I, peroxiredoxin II, peroxiredoxin III, peroxiredoxin IV, peroxiredoxin VI, chaperonin, amyloid-P-component, annexin V, dihydropyrimidinase-like 2 protein, glutamate carboxypeptidase, 2,3-bisphosphoglycerate mutase, thymidine phosphorylase, prolyl-4 hydroxylase, selenium binding protein 1, β-mitochondrial ATP synthase H+ transporting F1 complex, laminin-binding protein, minichromosome maintenance deficient protein 5 variant, keratin 9, keratin 10, napsin A aspartic peptidase, M2-type pyruvate kinase, and apolipoprotein A-I.

Description

BACKGROUND[0001]Lung cancer is the leading cause of cancer deaths worldwide, and non-small cell lung carcinoma (NSCLC) accounts for nearly 85% of all cases of lung cancers. The progression of cancer is usually manifested as uncontrolled growth in cancerous tissues, construction of new blood vessels and invasion into adjacent tissues. These manifestations may bring about concomitant changes in expression of proteins, including their formation, concentrations and interactions with other molecules in the cancerous tissues.[0002]Occurrence of NSCLC is usually diagnosed at a late stage, resulting in high mortality. While early detection of NSCLC is a crucial step to decrease the high mortality rate, there are currently no reliable methods for early detection.[0003]Current diagnostic tests for lung cancer may include chest X-ray, sputum cytology, bronchoscopy, image scans and biopsy. However, these tests can only detect the occurrence of lung cancer at a relatively late stage. Furthermore...

Claims


Application Information

Patent Timeline
Patent Type & Authority Applications(United States)
IPC IPC(8): C40B30/04C12Q1/28C12Q1/37C12Q1/48C12Q1/34G01N33/68C12Q1/02G01N33/566G01N33/573G01N33/53
CPCG01N33/57423G01N2333/4718G01N2800/52G01N2333/912G01N2333/95G01N2333/908
Inventor LO, SAMUEL CHUN LAPBUTT, YOKI KWOK CHULEUNG, WALLACE WOON FONG
Owner THE HONG KONG POLYTECHNIC UNIV
Learn More