Polymer membranes for continuous analyte sensors
a technology of analyte sensor and polymer membrane, which is applied in the field of polymer membrane for continuous analyte sensor, can solve the problems of short-term or less-than-accurate blood glucose sensing, many transcutaneous and intravascular sensors have problems in accurately sensing and reporting back glucose values continuously
- Summary
- Abstract
- Description
- Claims
- Application Information
AI Technical Summary
Benefits of technology
Problems solved by technology
Method used
Image
Examples
example 1
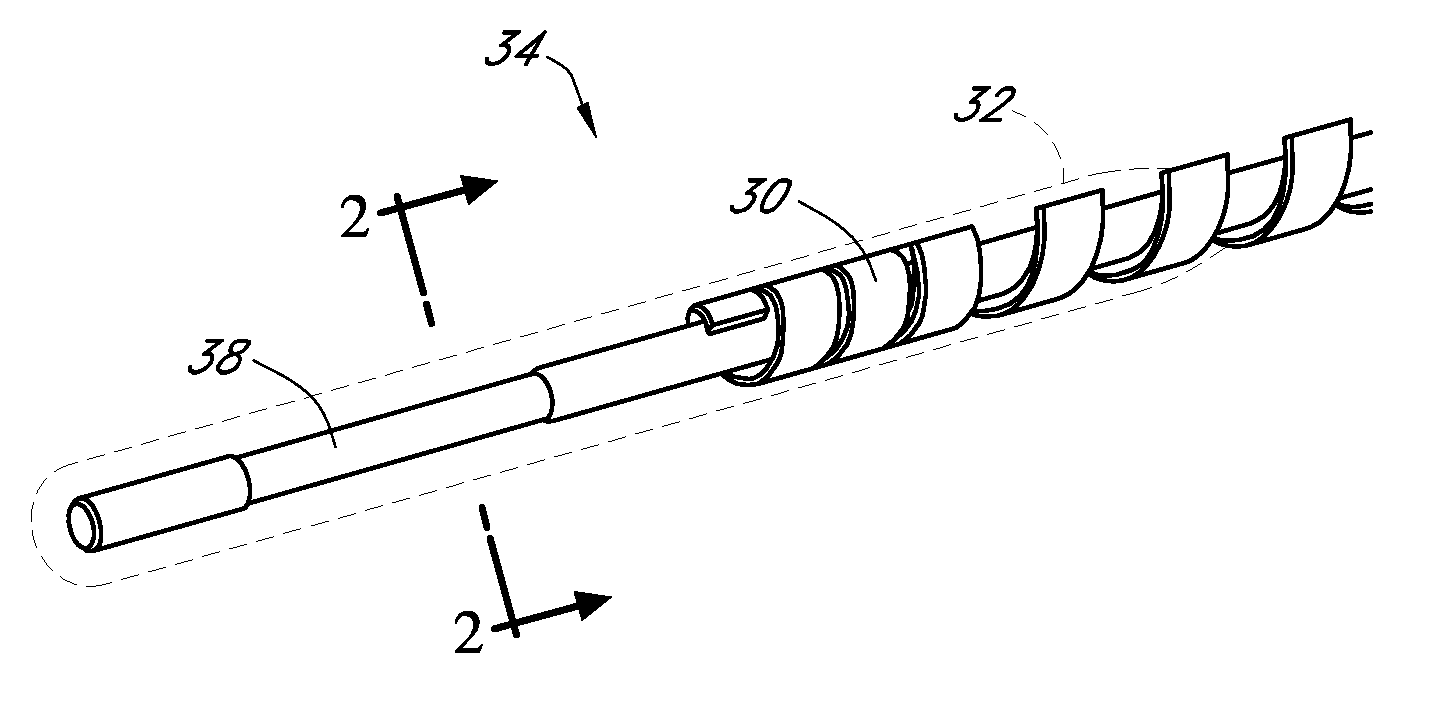
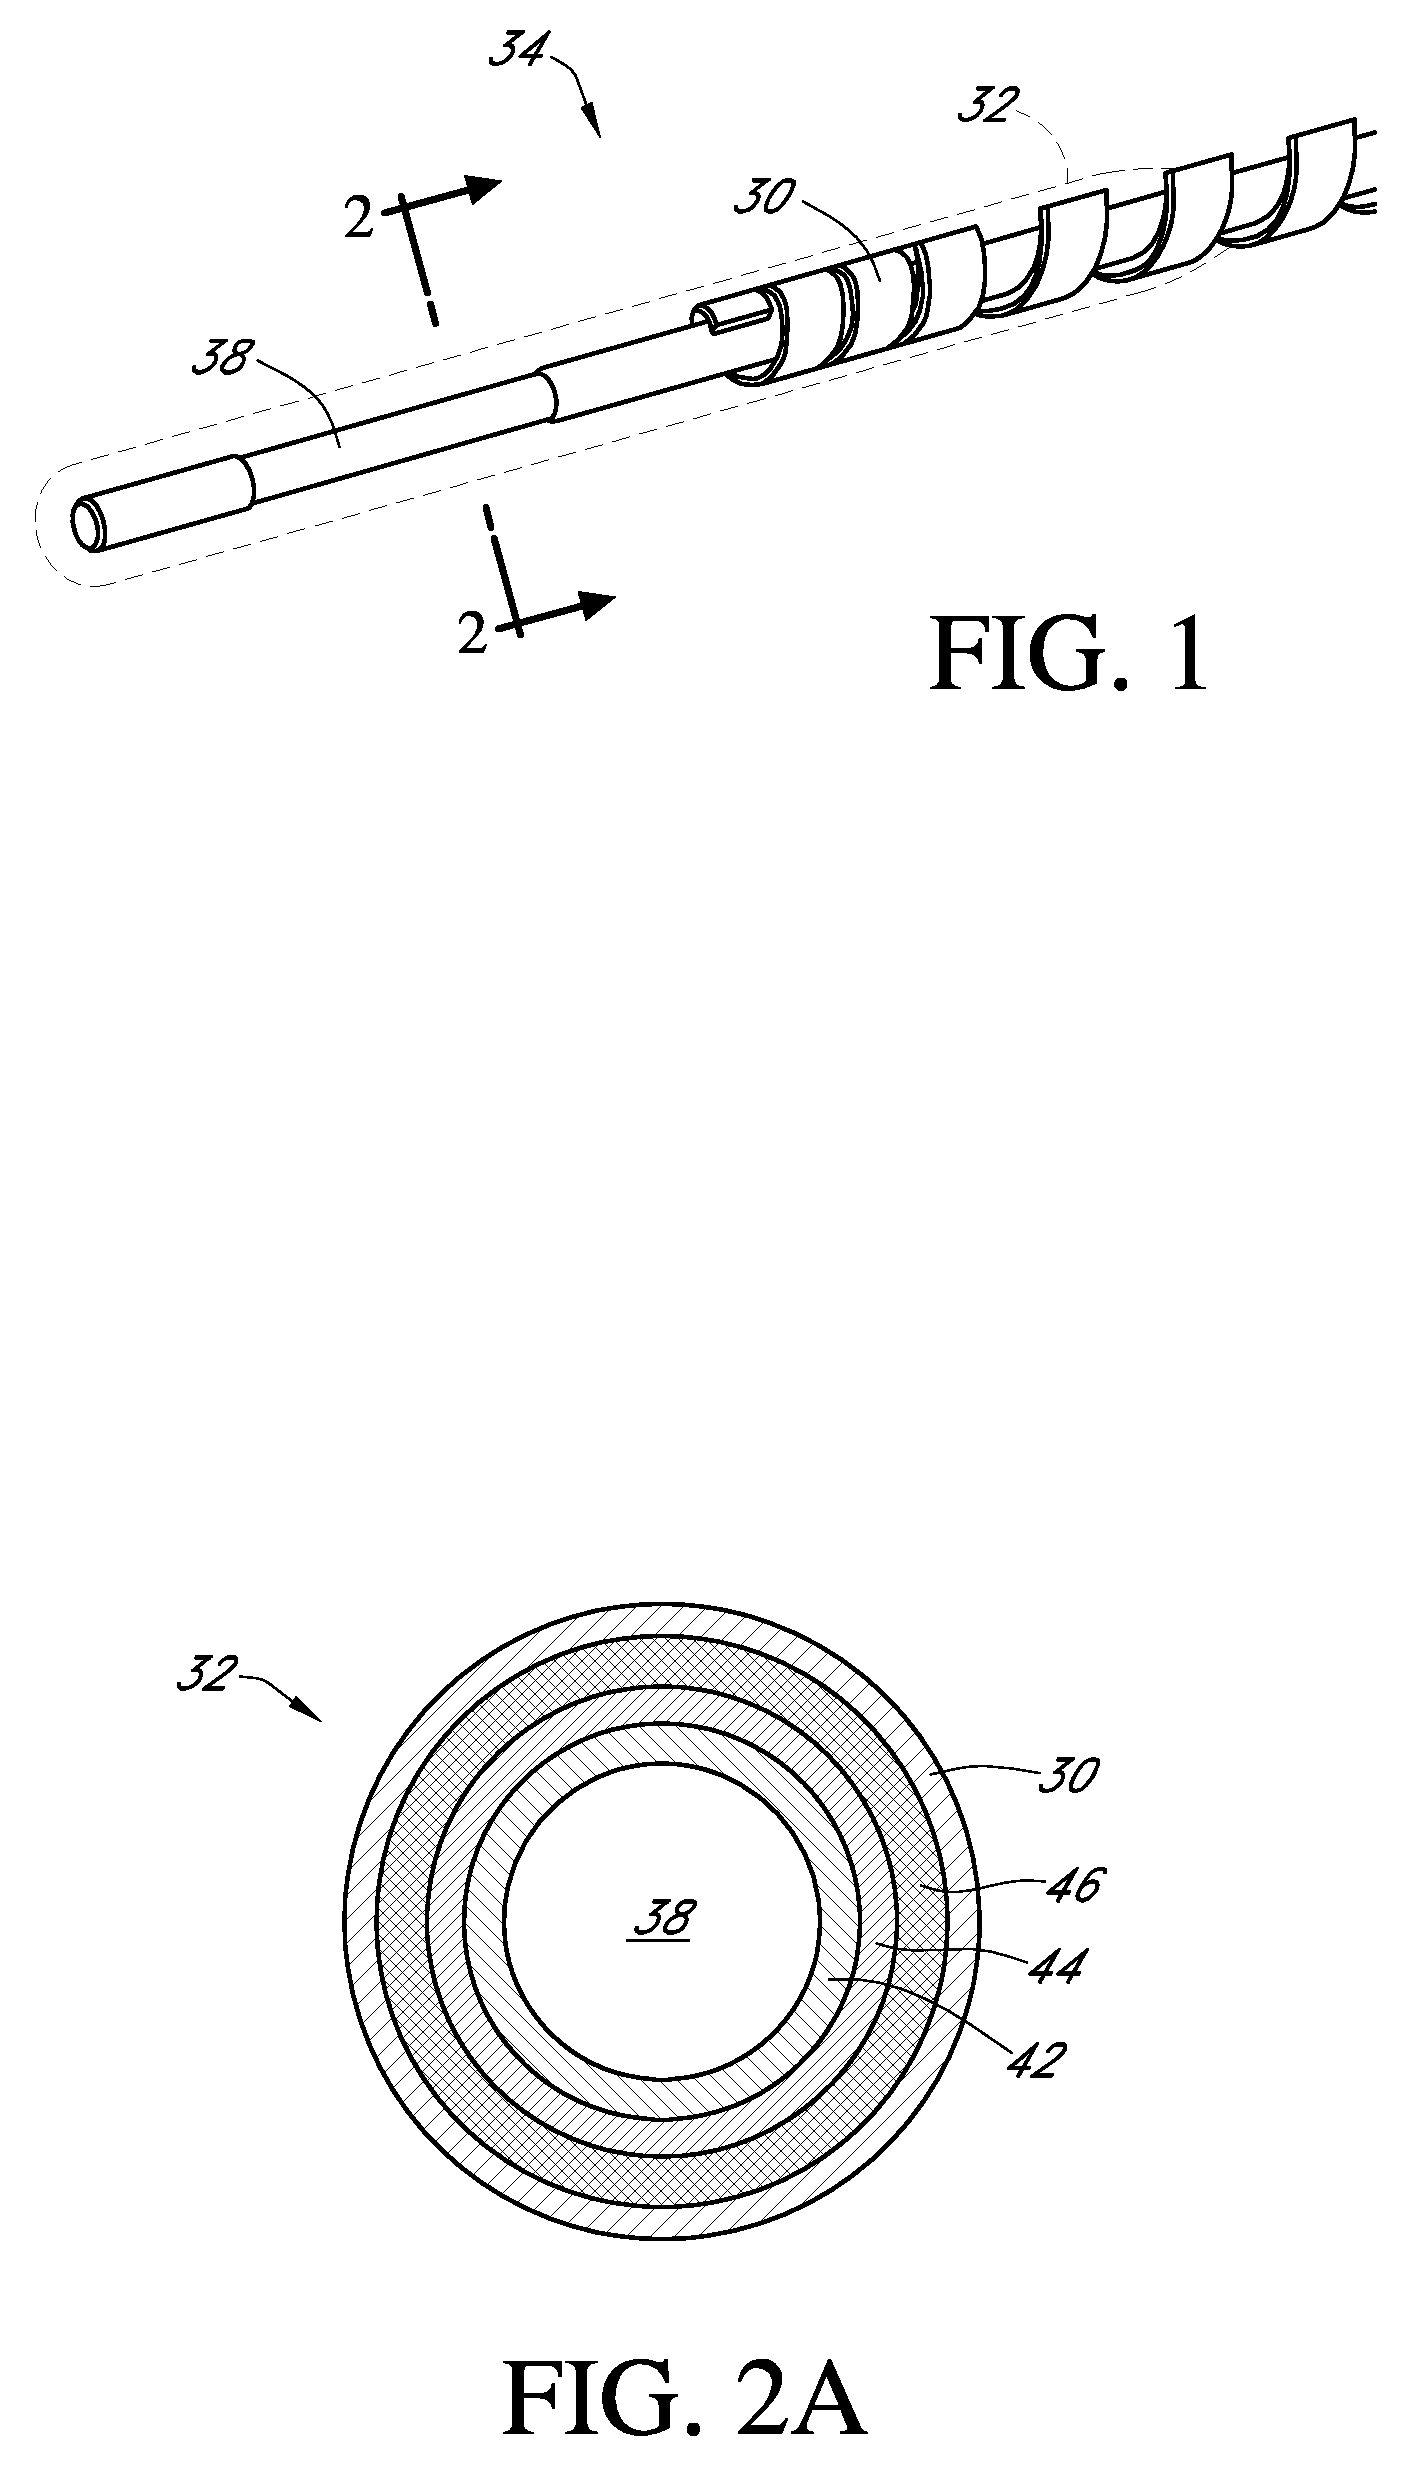
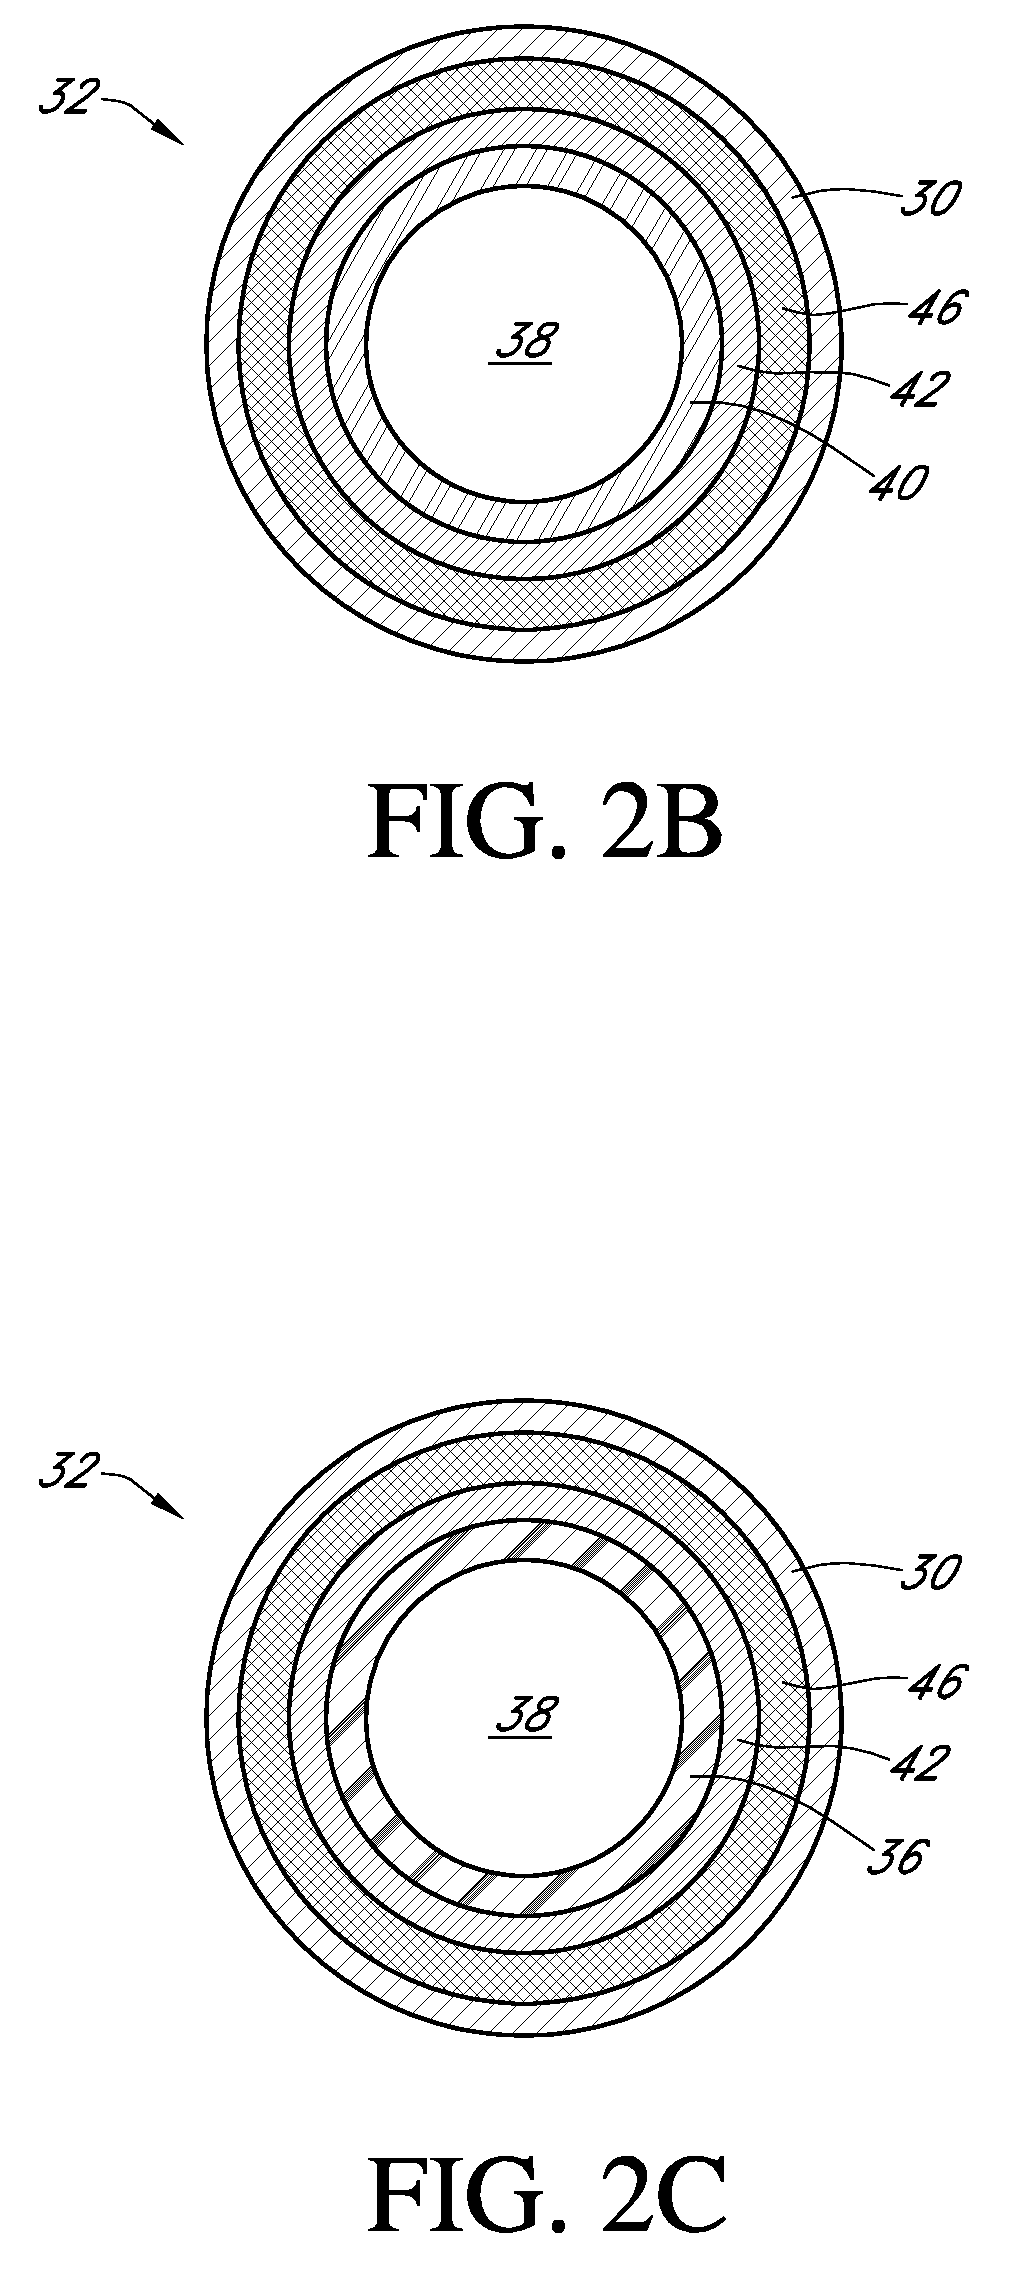
[0258]Sensors were built to test the ability of a silicone end group-containing polyurethane to reduce or block non-constant noise on a glucose sensor signal. Transcutaneous sensors, with electrode, enzyme and bioprotective domains, were built and tested. The control and test sensors were built as described in the section entitled ‘Exemplary Glucose Sensor Configuration,’ including an electrode domain, an enzyme domain and an integral bioprotective domain with one difference: the test sensors were built with a bioprotective domain comprising a silicone-polycarbonate-urethane including about 19% silicone by weight, and further including PVP added thereto (about 25% by weight to provide glucose permeability to the membrane); and the control sensors were built with a bioprotective domain comprising a polyurethane membrane with both hydrophilic and hydrophobic regions to control the diffusion of glucose and oxygen to the glucose sensor. Namely, the bioprotective domain of the test senso...
example 2
[0260]Test and Control sensors as described with reference to Example 1, above, were implanted bilaterally in humans and the signal evaluated. FIG. 5 is a graph illustrating the continuous glucose sensor data from the bilaterally implanted sensors in one human host over about two days. The x-axis represents time; the y-axis represents signal amplitude in counts. Circles represent the data set obtained from a control sensor with the configuration of Example 1 implanted on a first side of the host. The squares represent the data set obtained from a test sensor with the configuration of Example 1 implanted on the other side of the same host. It can be seen that the control sensor exemplified a much higher level of (non-constant) noise than the test sensor, as evidenced by the sporadic rises and falls seen in the control sensor data during the first 24 hours, for example. These rises and falls are non-physiological in nature, as evidenced by their rate of change being above known physio...
example 3
[0261]Test and Control sensors as described with reference to Example 1, above, were implanted bilaterally in diabetic rats for more than about 2 days. FIGS. 6A and 6B illustrate exemplary test results from a control sensor (FIG. 6A) and test sensor (FIG. 6B) implanted bilaterally in one rat, over a period more than about 2 days, after sensor break-in. The Y-axis represents signal amplitude (in counts). The X-axis represents time. Double-headed arrows approximately indicate the days of the study. The total signal detected by the test glucose sensor is shown as filled diamonds. To determine the signal components, the total signal, for each of the test and control data sets, was analyzed in the following manner. First, the total signal was filtered using an IIR filter to obtain the filtered signal (open diamonds). The non-constant noise component (filled circles) was obtained by subtracting the filtered signal from the total signal. Next, the filtered signal was calibrated using gluco...
PUM
 Abstract
Description
Claims
Application Information
 - R&D
- Intellectual Property
- Life Sciences
- Materials
- Tech Scout
- Unparalleled Data Quality
- Higher Quality Content
- 60% Fewer Hallucinations
Browse by: Latest US Patents, China's latest patents, Technical Efficacy Thesaurus, Application Domain, Technology Topic, Popular Technical Reports.
© 2025 PatSnap. All rights reserved.Legal|Privacy policy|Modern Slavery Act Transparency Statement|Sitemap|About US| Contact US: help@patsnap.com


