
Generation of test specifications based on measured data points

a technology of measurement data points and test specifications, applied in the direction of measurement devices, measurement arrangements for variables, instruments, etc., can solve the problems of reducing the utilization rate of memory and processing resources, reducing or minimizing the use of resources in implementation, and reducing or minimizing the use of resources

Inactive Publication Date: 2009-04-02
AGILENT TECH INC
View PDF4 Cites 11 Cited by
  • Summary
  • Abstract
  • Description
  • Claims
  • Application Information

AI Technical Summary

Benefits of technology

[0013]Test specifications generated according to embodiments of the present invention are typically adapted to minimize or optimize the use resources in implementing the test specifications. Embodiments of the invention, as discussed above, utilize a single data set or trace in providing a test specification or limit line, thereby reducing or minimizing the resources needed in the generation of the test specification. A data set or trace utilized in providing a test specification or limit line according to embodiments of the invention may be generated using a single data set or trace derived from one input stimuli to output response test or derived from multiple input stimuli to output response tests. For example, multiple “known good” traces may be consolidated into a single input testing stimuli to output response data set or trace, such as by selecting the maximum value from all of these traces at each corresponding data point or bucket (e.g., applying a “maximum hold” method), used in generating a test specification or limit line.
[0014]Additionally or alternatively, to facilitate reduced utilization of memory and processing resources, test specifications generated according to embodiments of the invention are piece-wise linear (e.g., when associated with a two dimensional test data set) or piece-wise planar (e.g., when associated with a three dimensional test data set), although other contours may be utilized according to embodiments of the invention. A difference, or threshold value, between the test specification and corresponding trace for each piece-wise linear portion of such a test specification is typically selected so as to accommodate expected measurement variations, such as due to noise or noise-like results, which are not significant to the determination of acceptability of the DUT, while detecting significant differences in operation due to fundamental DUT characteristics. Embodiments of the invention further operate to reduce or minimize the number of piece-wise portions (e.g., line segments, plane segments, etc.) in the resulting test specification. According to preferred embodiment, a method used in generating the test specification operates to lengthen and / or consolidate piece-wise portions in the test specification after initially generating such piece-wise portions.

Problems solved by technology

A test specification used in determining the acceptability of a device under test (DUT) may be relatively complex.
However, establishing a limit line which provides useful acceptance / rejection of DUTs is more complicated than simply testing a device and directly establishing a limit line from the results.
Accordingly, establishing a useful limit line is not as simple as testing a device and extrapolating a limit line therefrom.
Such a testing method requires appreciable time to conduct testing of multiple devices and compile data therefrom.
Likewise, appreciable time and computational power is required to compile the statistical data.
Moreover, creating a limit line (which is generally quite complex), and implementing the limit line in an instrument or other test facility used for testing, based upon the resulting data sets provided by such a method typically require substantial effort to extract the data, create one or more database of limit line data, manipulate the limit line data for use by a selected instrument, and import the information into the instrument.
Such simulations are generally time consuming and require appreciable computational power.
As with the testing method discussed above, the statistical analysis applied to the data sets to derive a limit line require appreciable time and computational power.
Moreover, the data sets provided thereby may not accurately reflect actual operational results, such as due to erroneous assumptions etc.
Additionally, creating a limit line (which is generally quite complex), and implementing the limit line in an instrument used for testing, based upon the resulting data sets provided by such a method typically require substantial effort to extract the data, create one or more database of limit line data, manipulate the limit line data for use by a selected instrument, and importing the information into the instrument.
Although computationally complex and relatively time consuming and difficult to implement in an instrument, the foregoing methods have been generally preferred due to their approaches resulting in a limit line which is less likely to provide false negatives and false positives due to slight differences in measured results.
Accordingly, the generally computationally intensive and time consuming process of either simulating or empirically testing a device in different test conditions and / or simulating or empirically testing multiple devices is widely believed to be necessary to provide limit lines which do not result in excessively large numbers of DUTs being rejected due to noise and noise-like responses.
Not only does this process can take a significant amount of time, but the resulting limit line is susceptible to transcription and other errors.
Moreover, a user is often unable to accurately predict the variations in the test results which are insignificant to a determination as to whether a DUT is performing as desired.
Accordingly, such limit lines are prone to provide false negatives and / or false positives.

Method used


Image

  • Generation of test specifications based on measured data points
  • Generation of test specifications based on measured data points
  • Generation of test specifications based on measured data points

Examples


Embodiment Construction

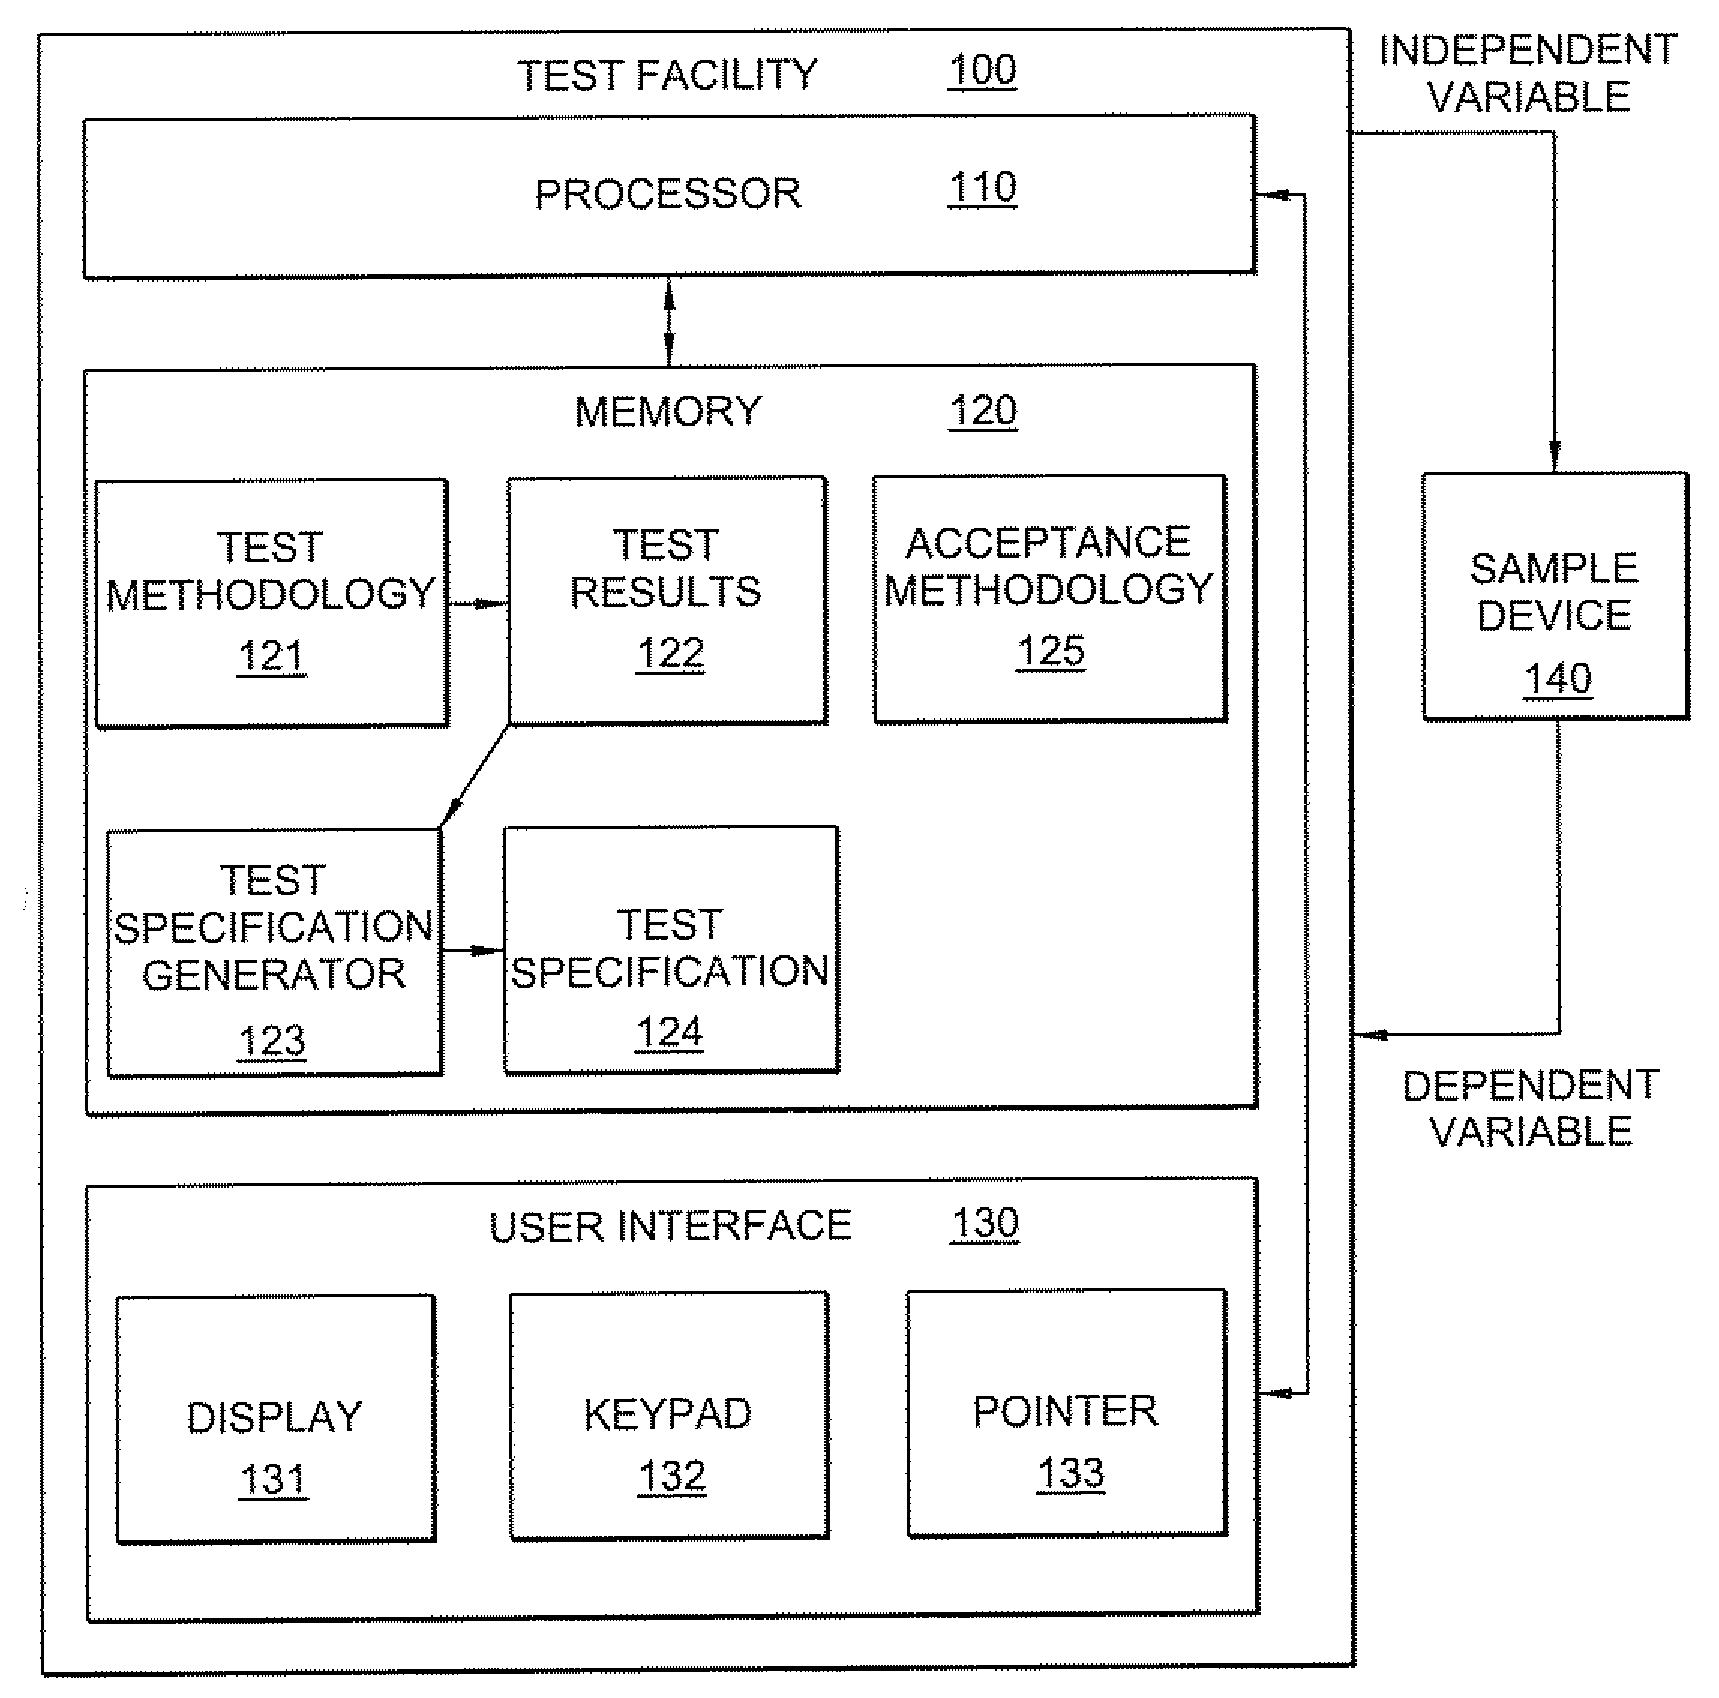
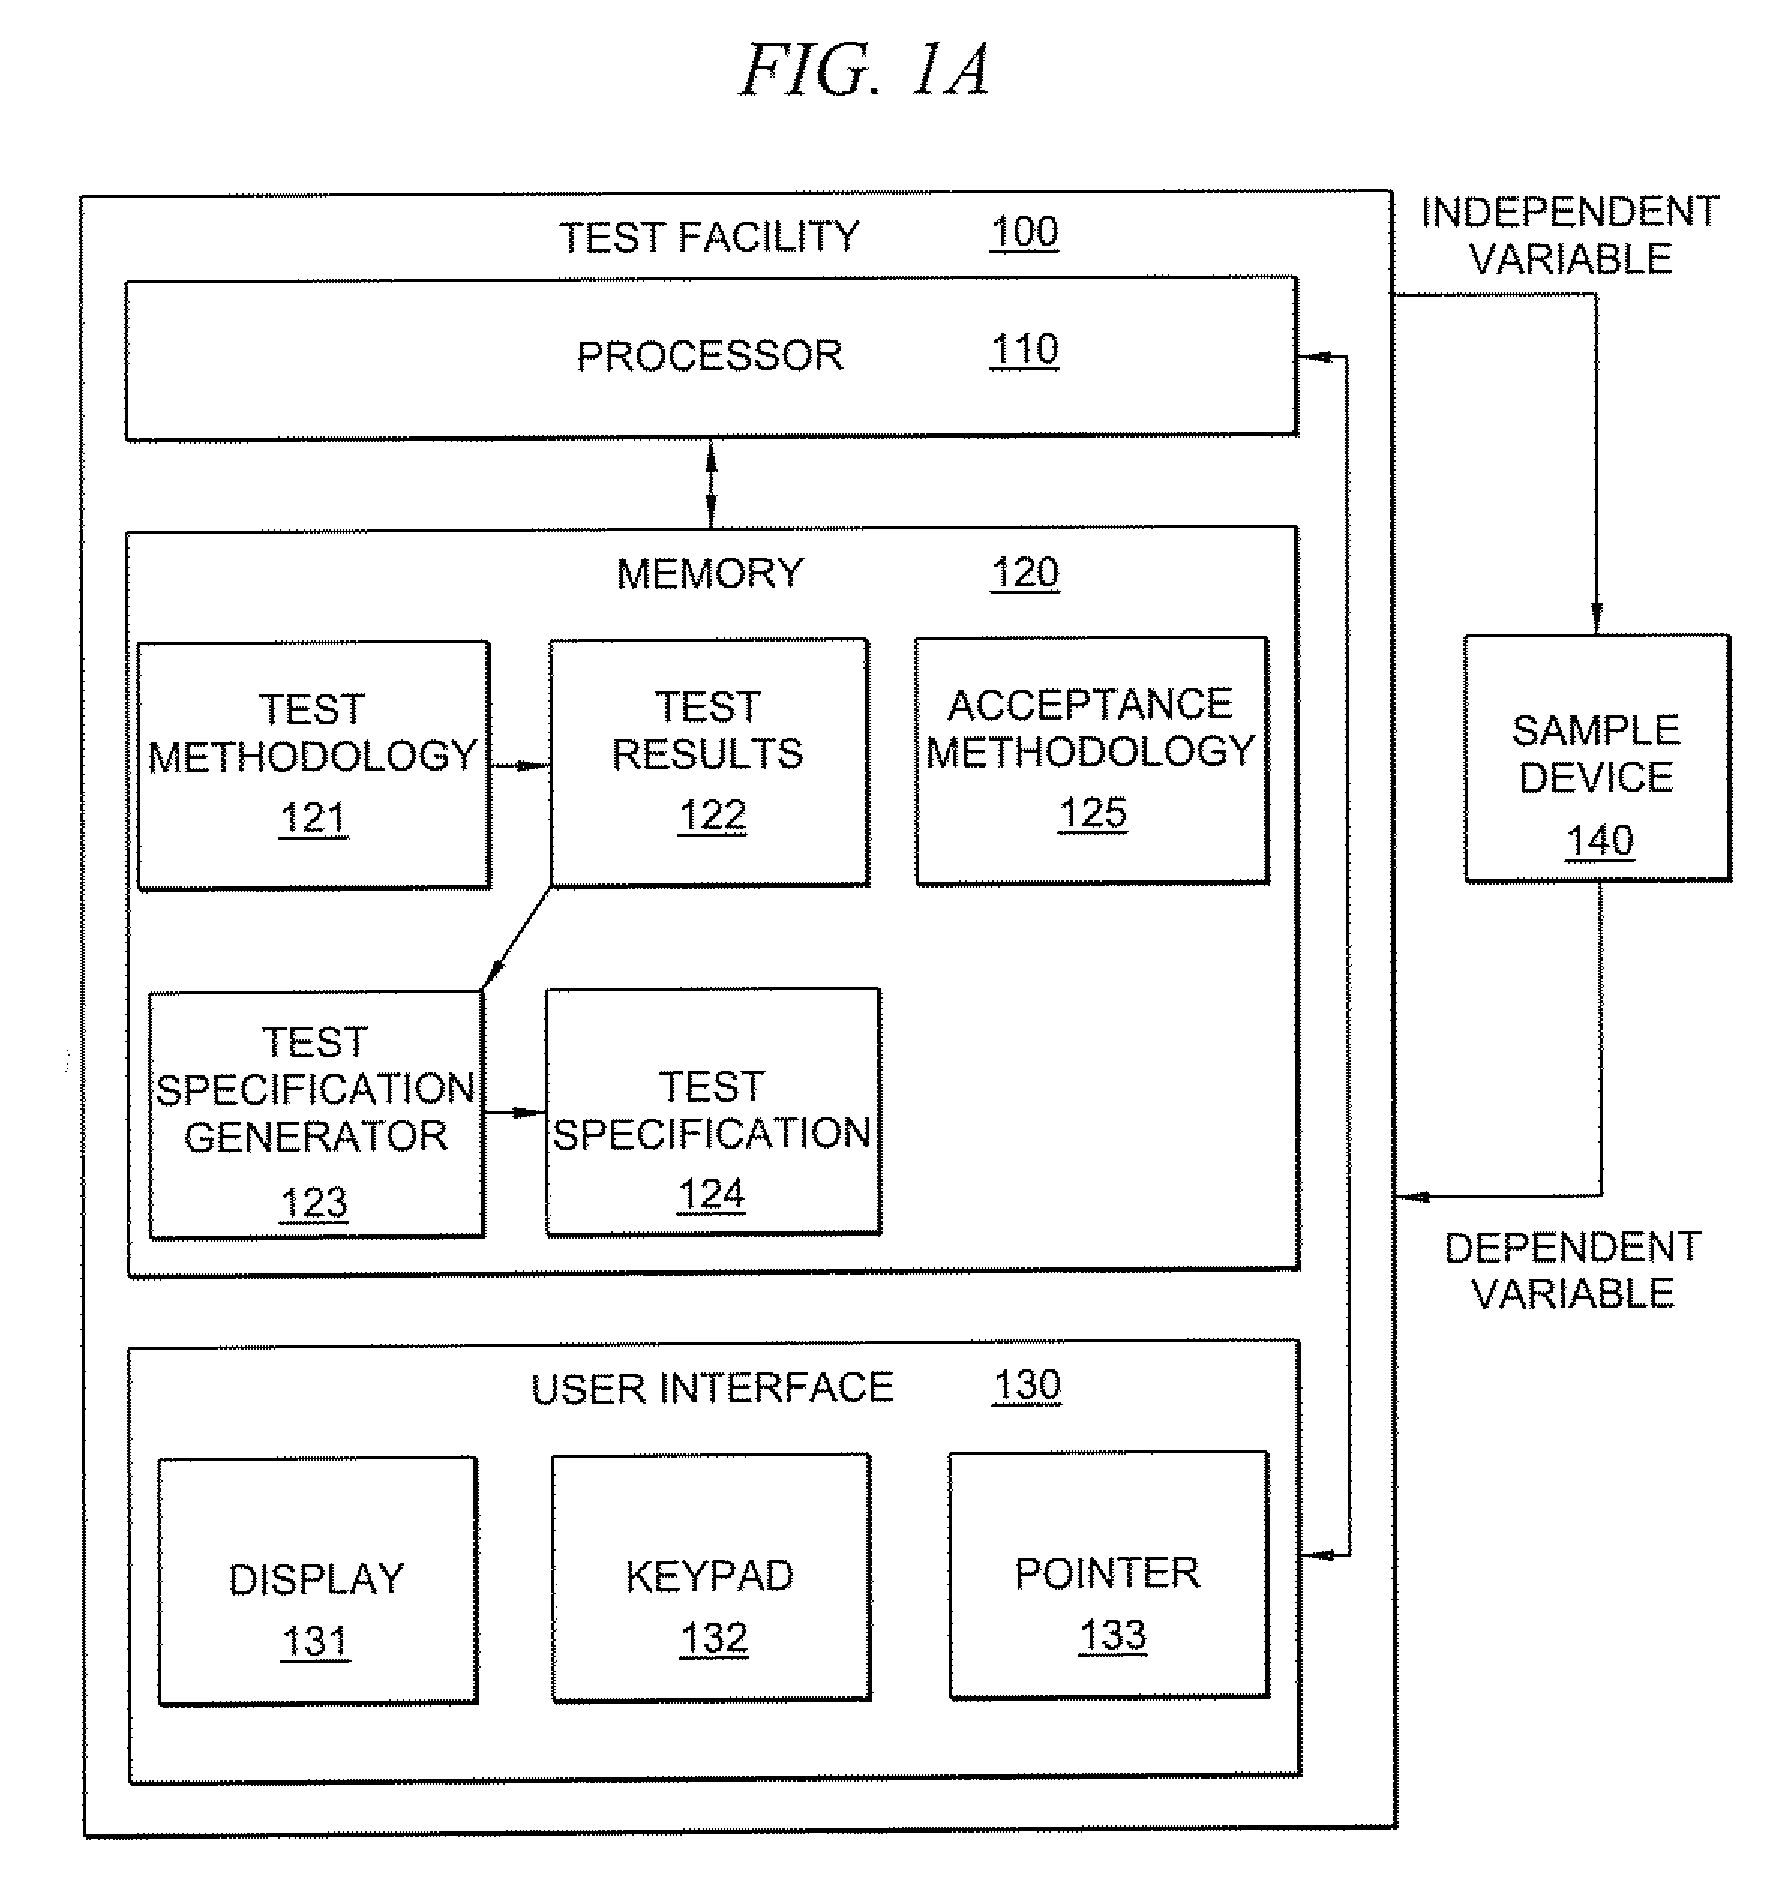
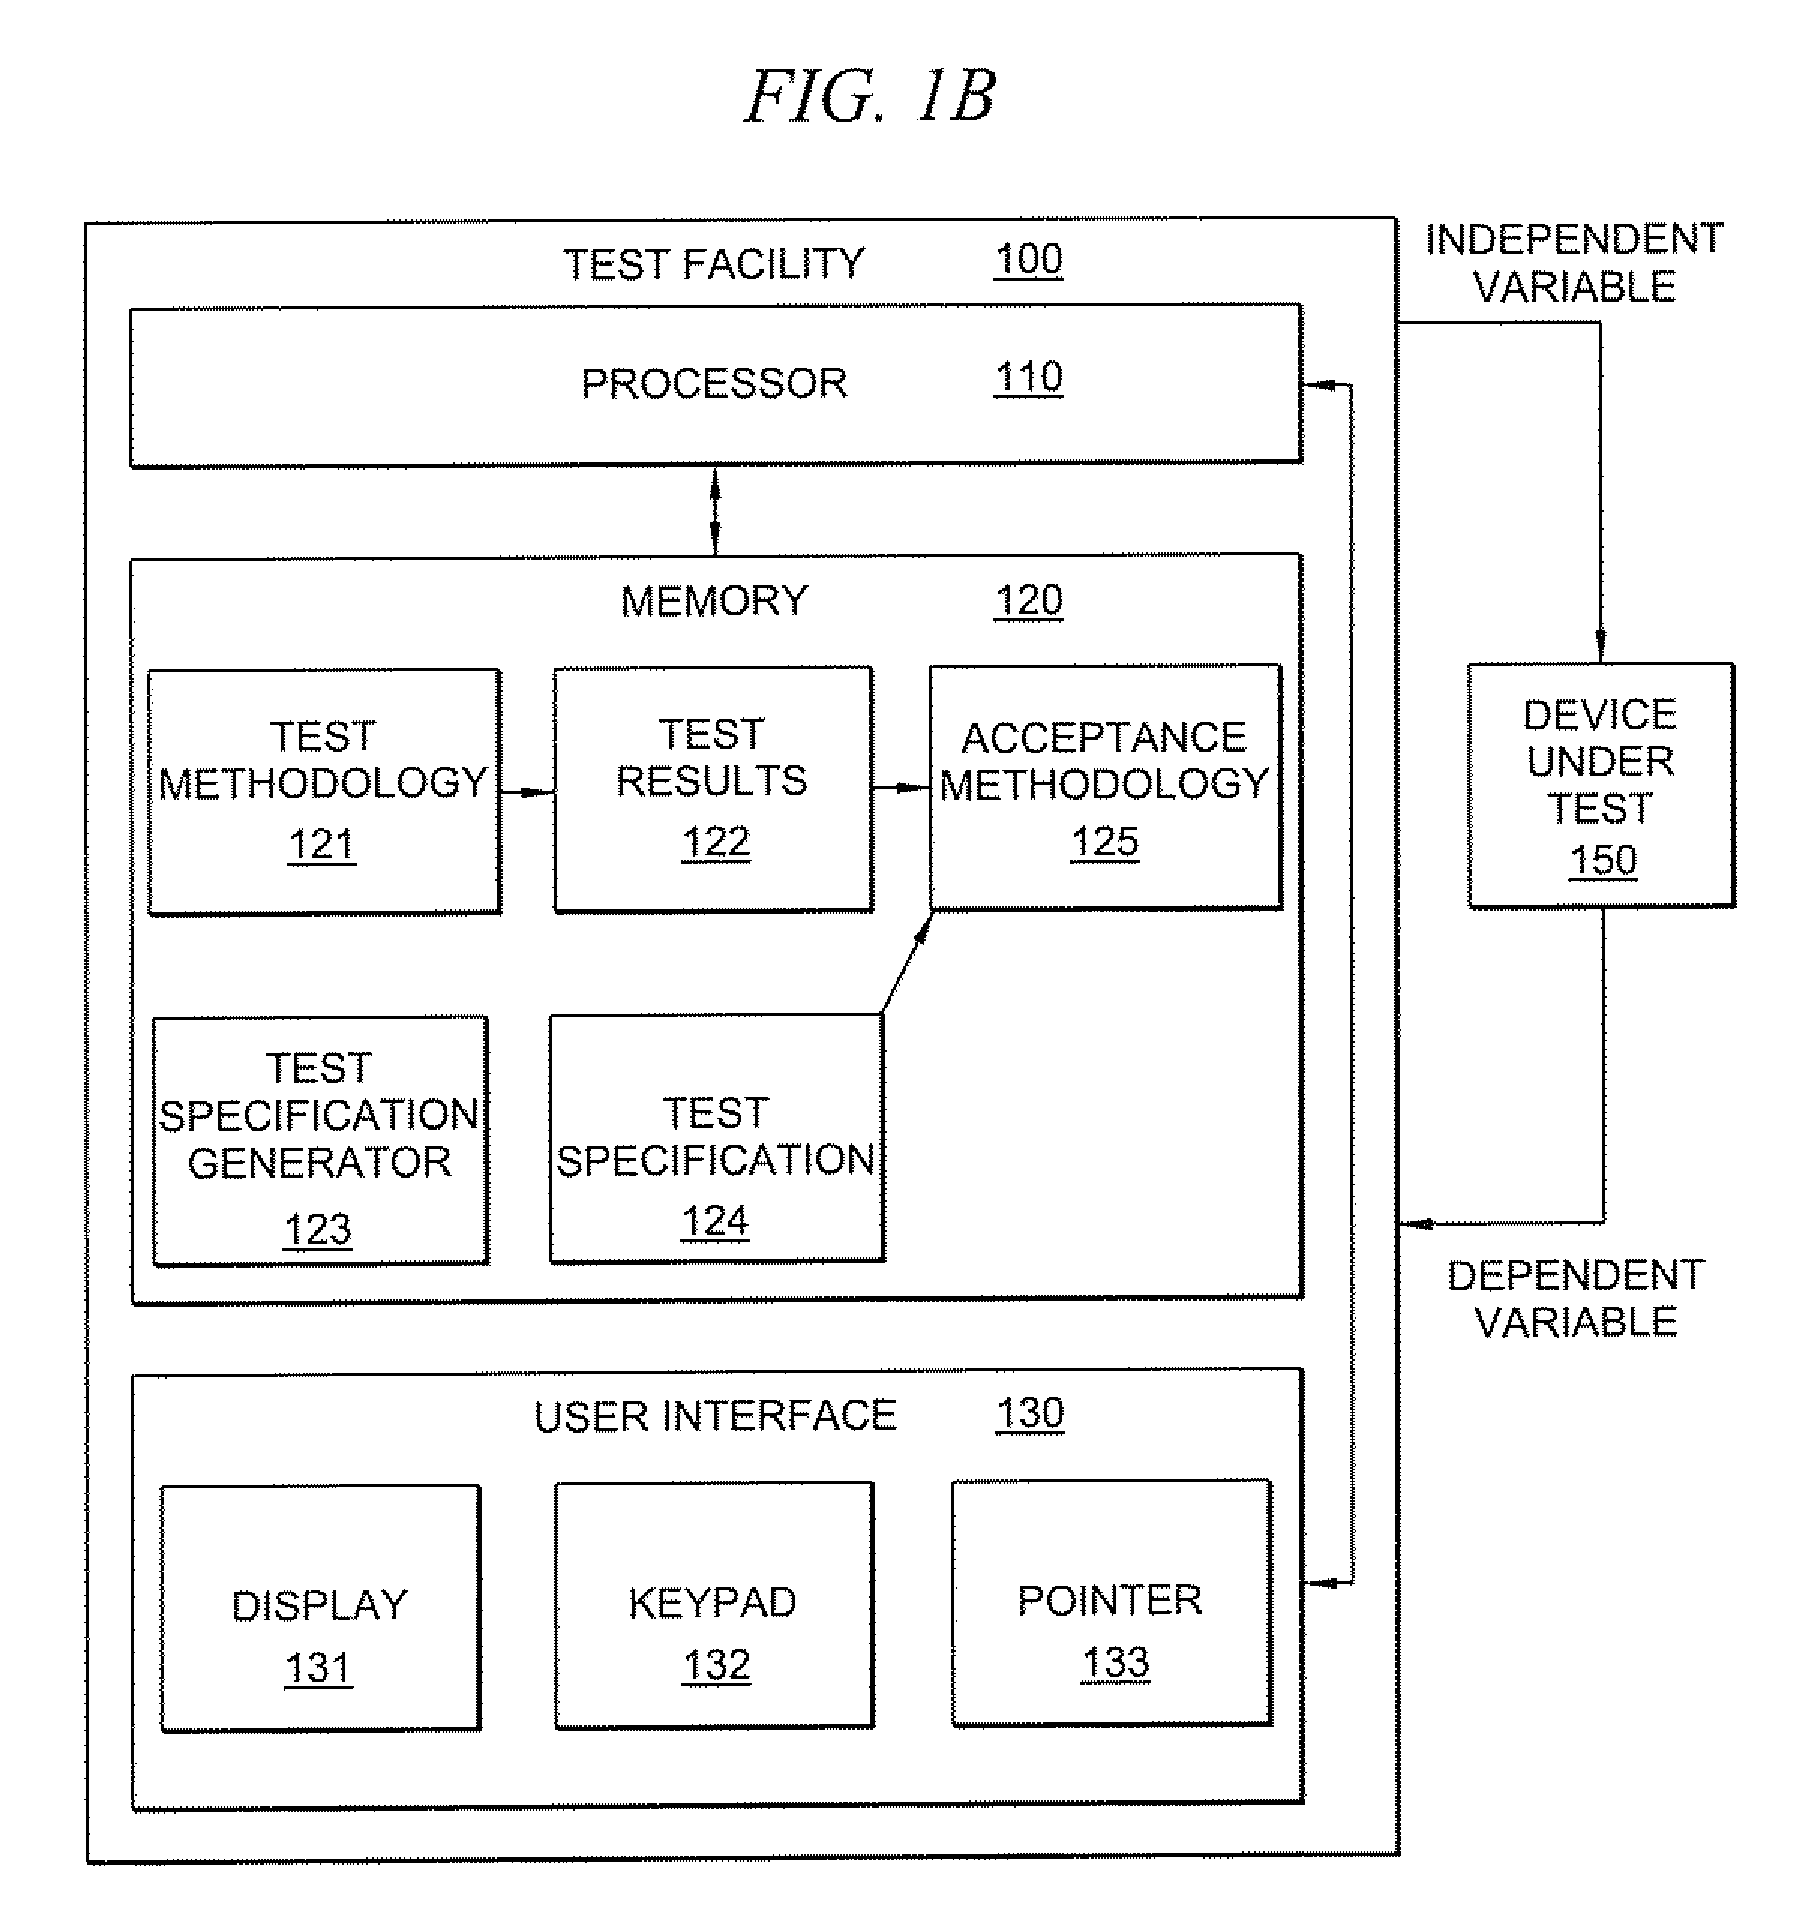
[0023]FIGS. 1A and 1B show an instrument or test facility adapted according to an embodiment of the present invention. Test facility 100 of the illustrated embodiment, such as may comprise any number of instruments and instrument configurations (e.g., a spectrum analyzer, an oscilloscope, a network analyzer, and / or the like), includes processor 110, memory 120, and user interface 130. Of course, test facility 100 may include additional functional blocks, such as test signal generation, test response capture, peripheral input / output, report generation, diagnostics, etc. However, to simplify the discussion of test facility 100 in order to facilitate the understanding of the present invention, such additional functional blocks have been omitted from the illustrated embodiment. It should be appreciated that the foregoing functional blocks, as well as additional or alternative functional blocks, my be incorporated in a test facility adapted according to embodiments of the invention. More...


PUM


Abstract

Autonomous or machine generation of test specifications can be achieved by capturing the measured test data of a device and then using the captured test data to build a test specification, such as a limit line, for subsequent testing of similar devices. The generated test specification is typically adapted for use with respect to limited resources, such as through use of a piece-wise linear configuration. In an embodiment, the number of piece-wise linear portions of the generated test specification is minimized or otherwise optimized. In embodiments, the generated test specification is adjusted to accommodate expected measurement variation, such as thermal noise, device process variation, random jitter, etc., and, if desired, adjusted to allow for changes in test accuracy of subsequent tests. In one embodiment, one or more test measurement inaccuracies are eliminated in the construction of the limit line.

Description

TECHNICAL FIELD[0001]This disclosure relates to test specification generation and more specifically to systems and methods for building a test specification limit line based upon measured data taken from a sample device.BACKGROUND OF TILE INVENTION[0002]It is common that when a device is being tested the resultant measured data is compared against a test specification to determine if the device is performing, properly. For example, a test specification may be established which defines one or more test limit wherein tested devices having measured test data falling below or above, as the case may be, the test limit may be considered acceptable.[0003]A test specification used in determining the acceptability of a device under test (DUT) may be relatively complex. For example where operation of a device with respect to an input variable (independent variable or input testing stimuli) over a range and an output variable dependent therefrom (dependent variable) is tested over an operating...

Claims


Application Information

Patent Timeline
IPC IPC(8): G06F19/00
CPCG01R31/31908G01R31/31718
Inventor HOPCRAFT, GEOFFGORIN, JOSEPH M.
Owner AGILENT TECH INC
Learn More