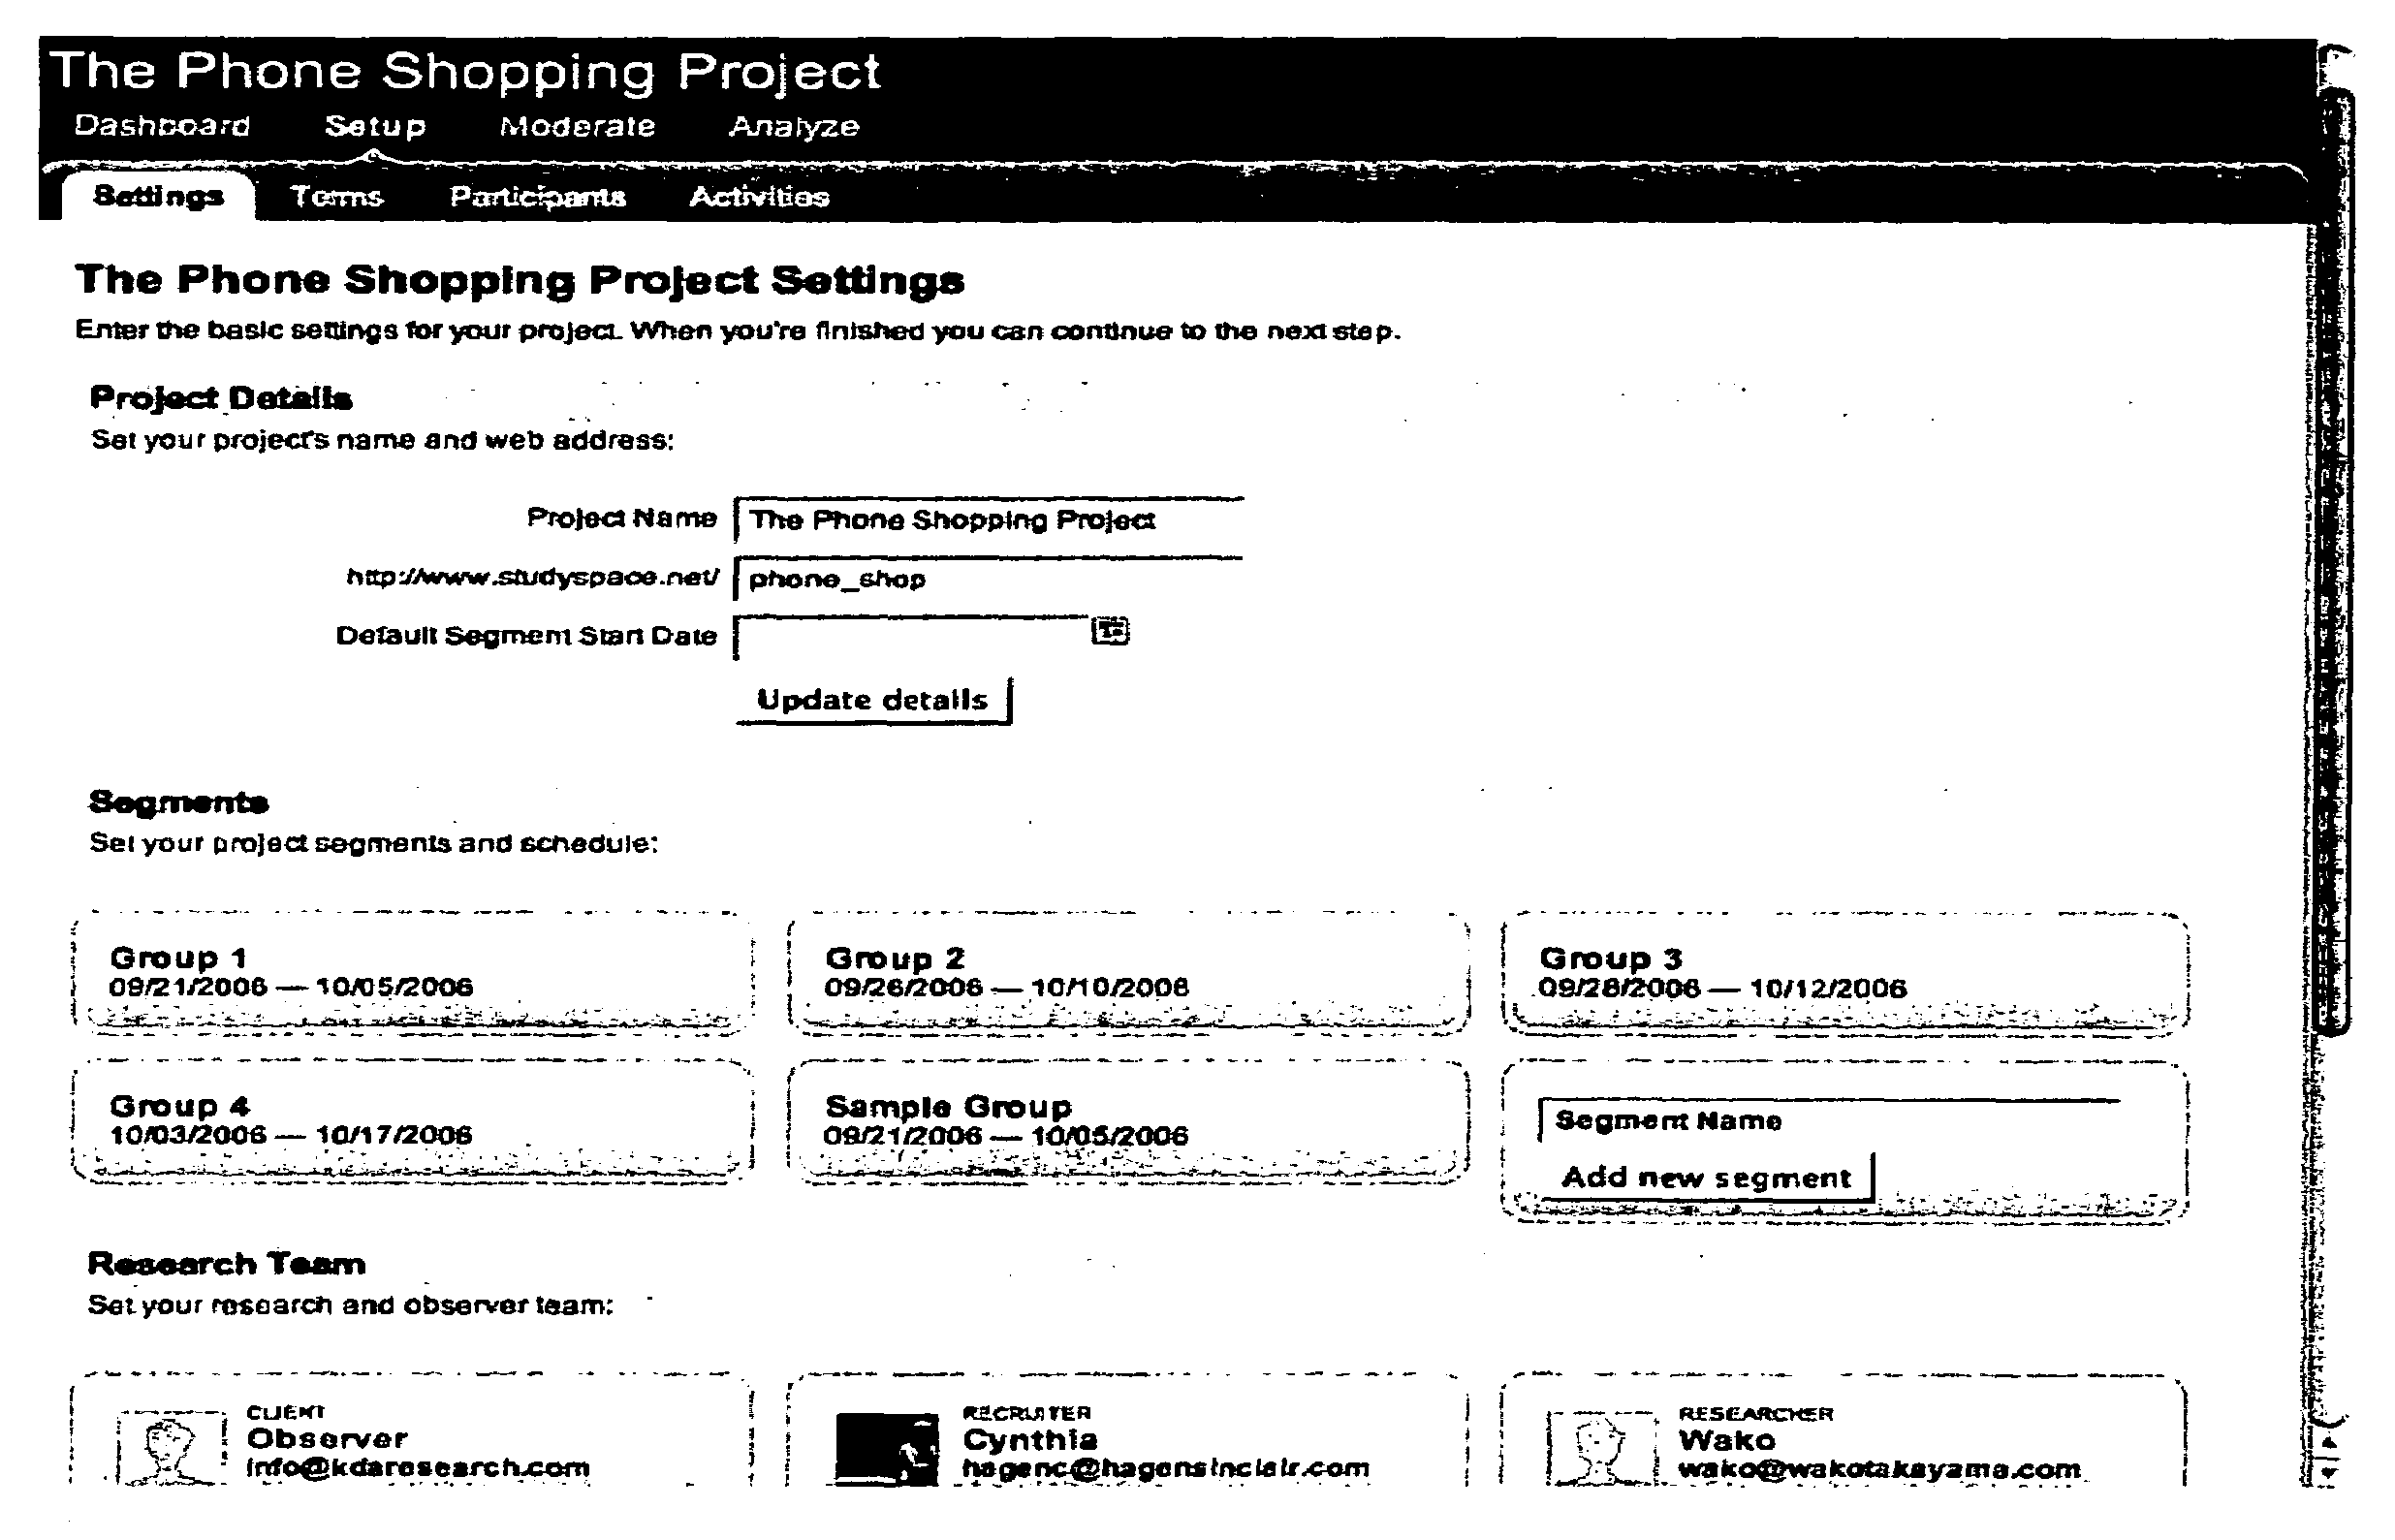
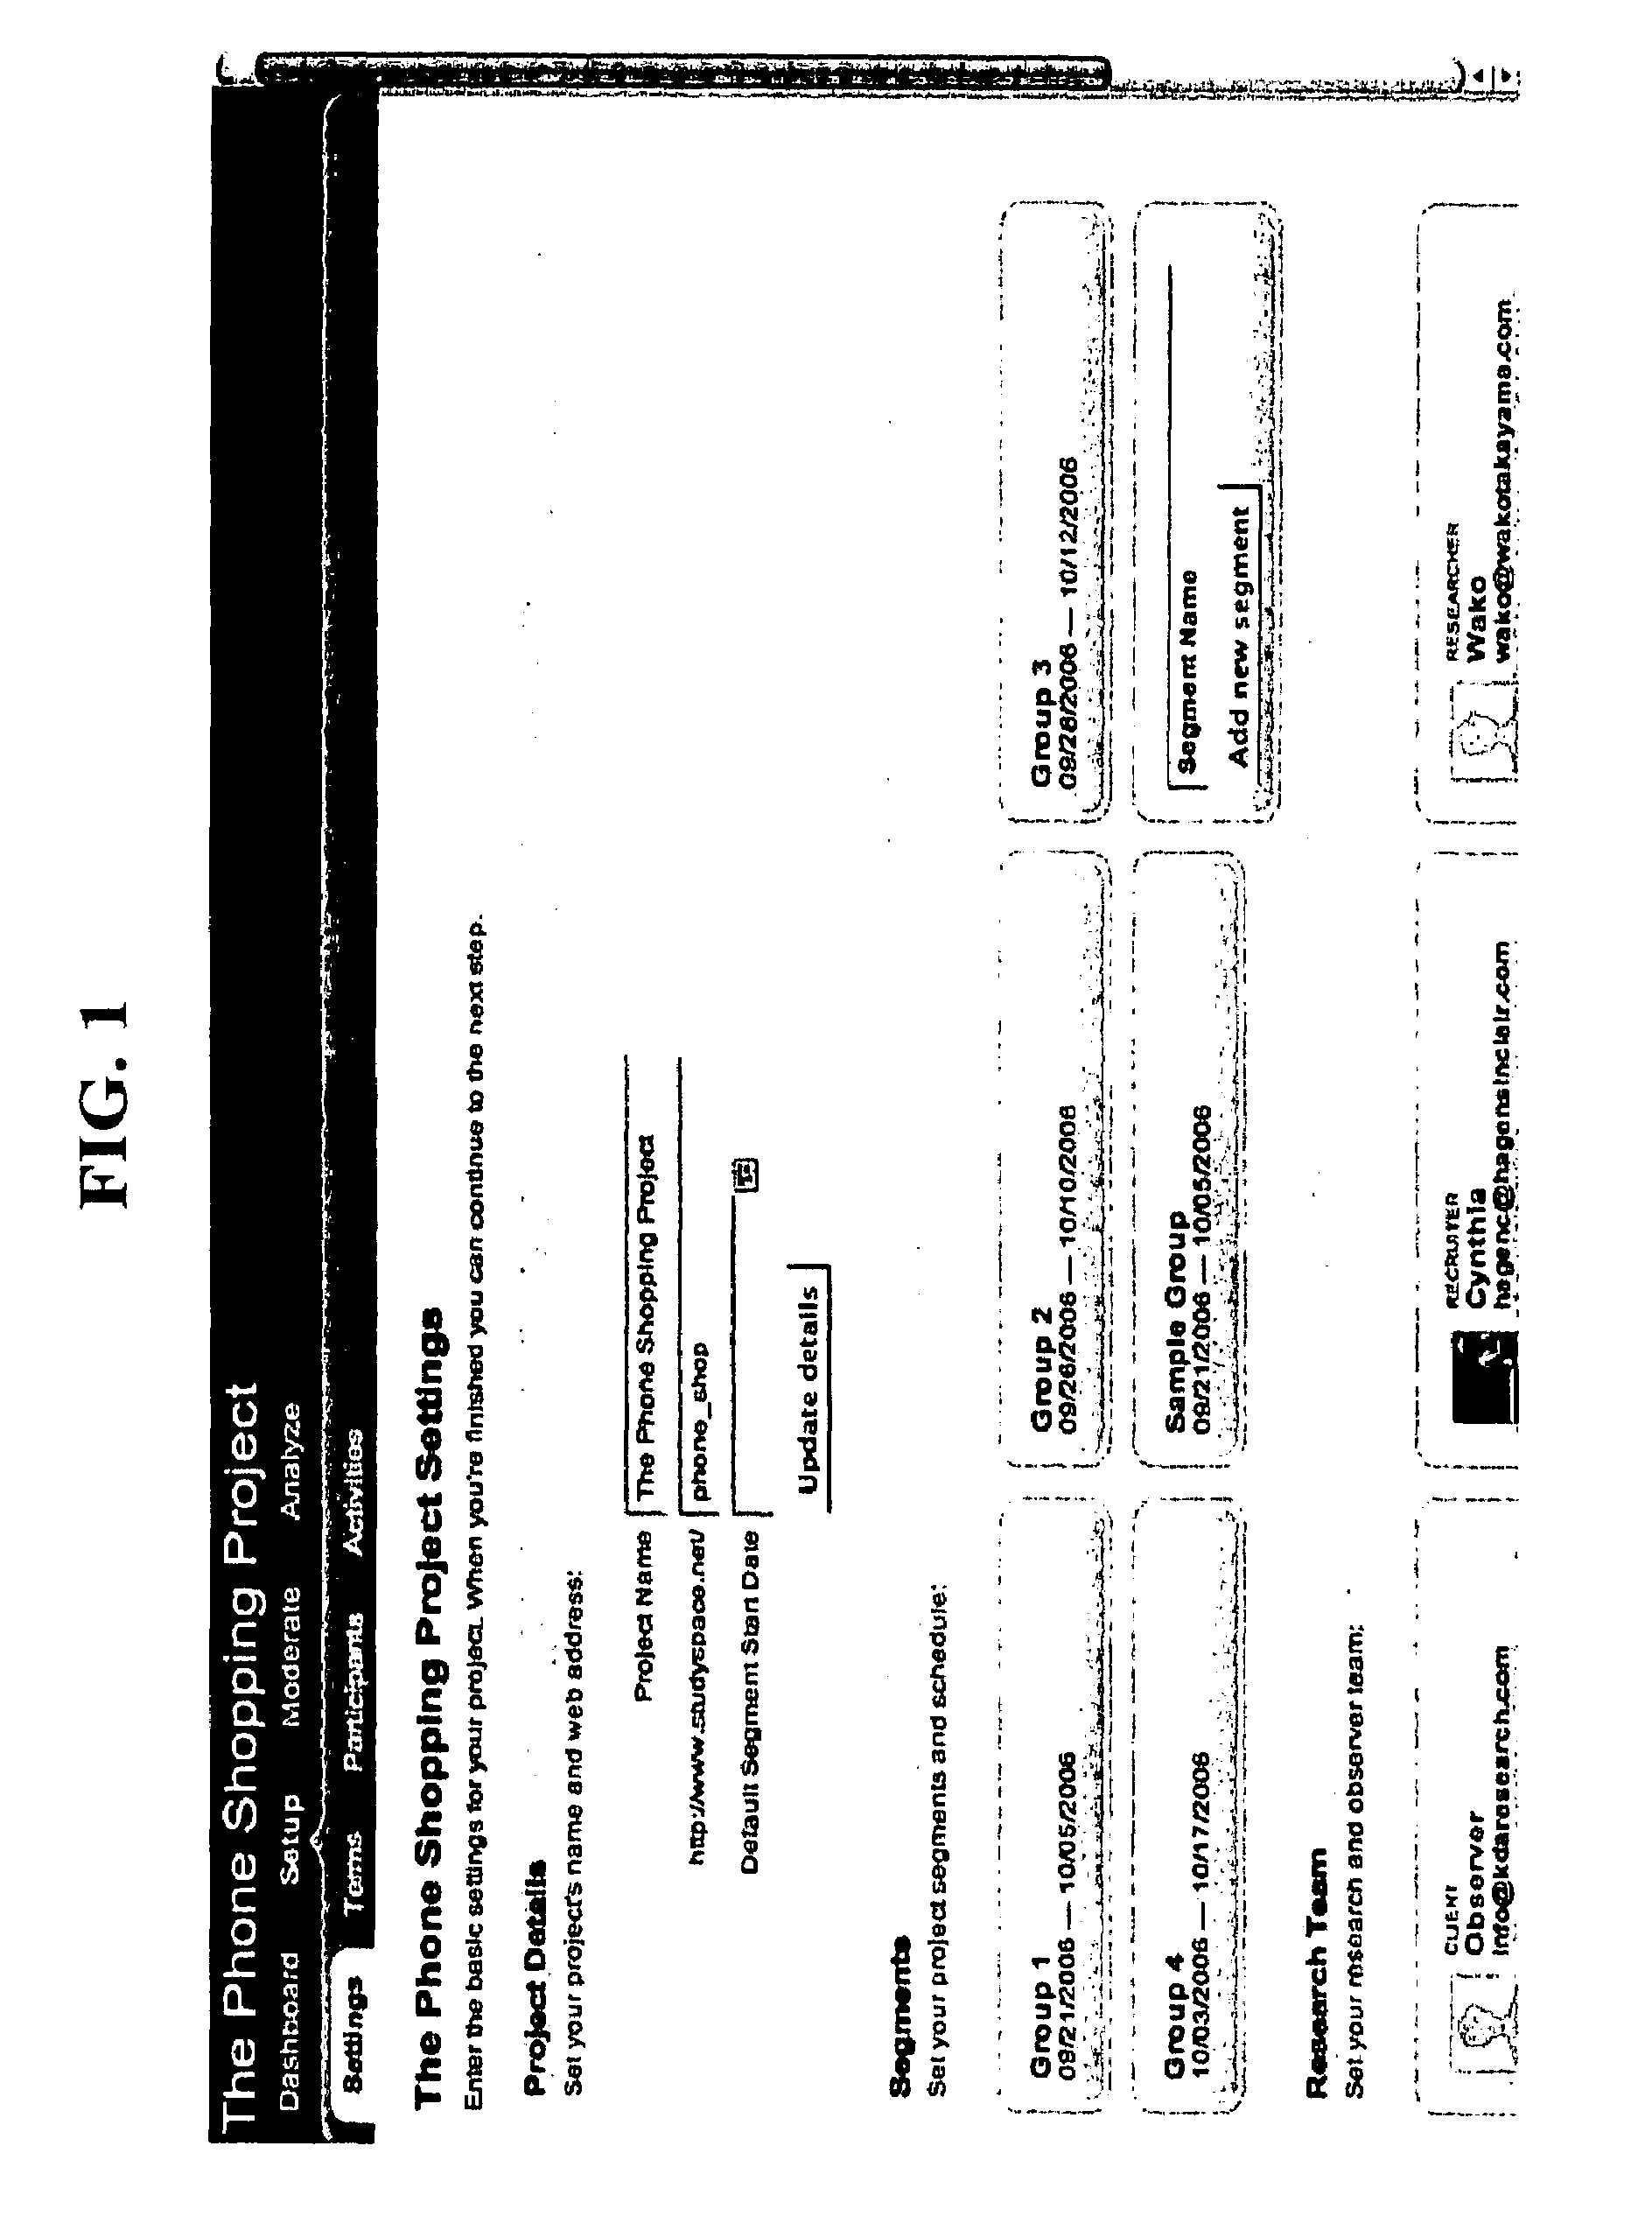
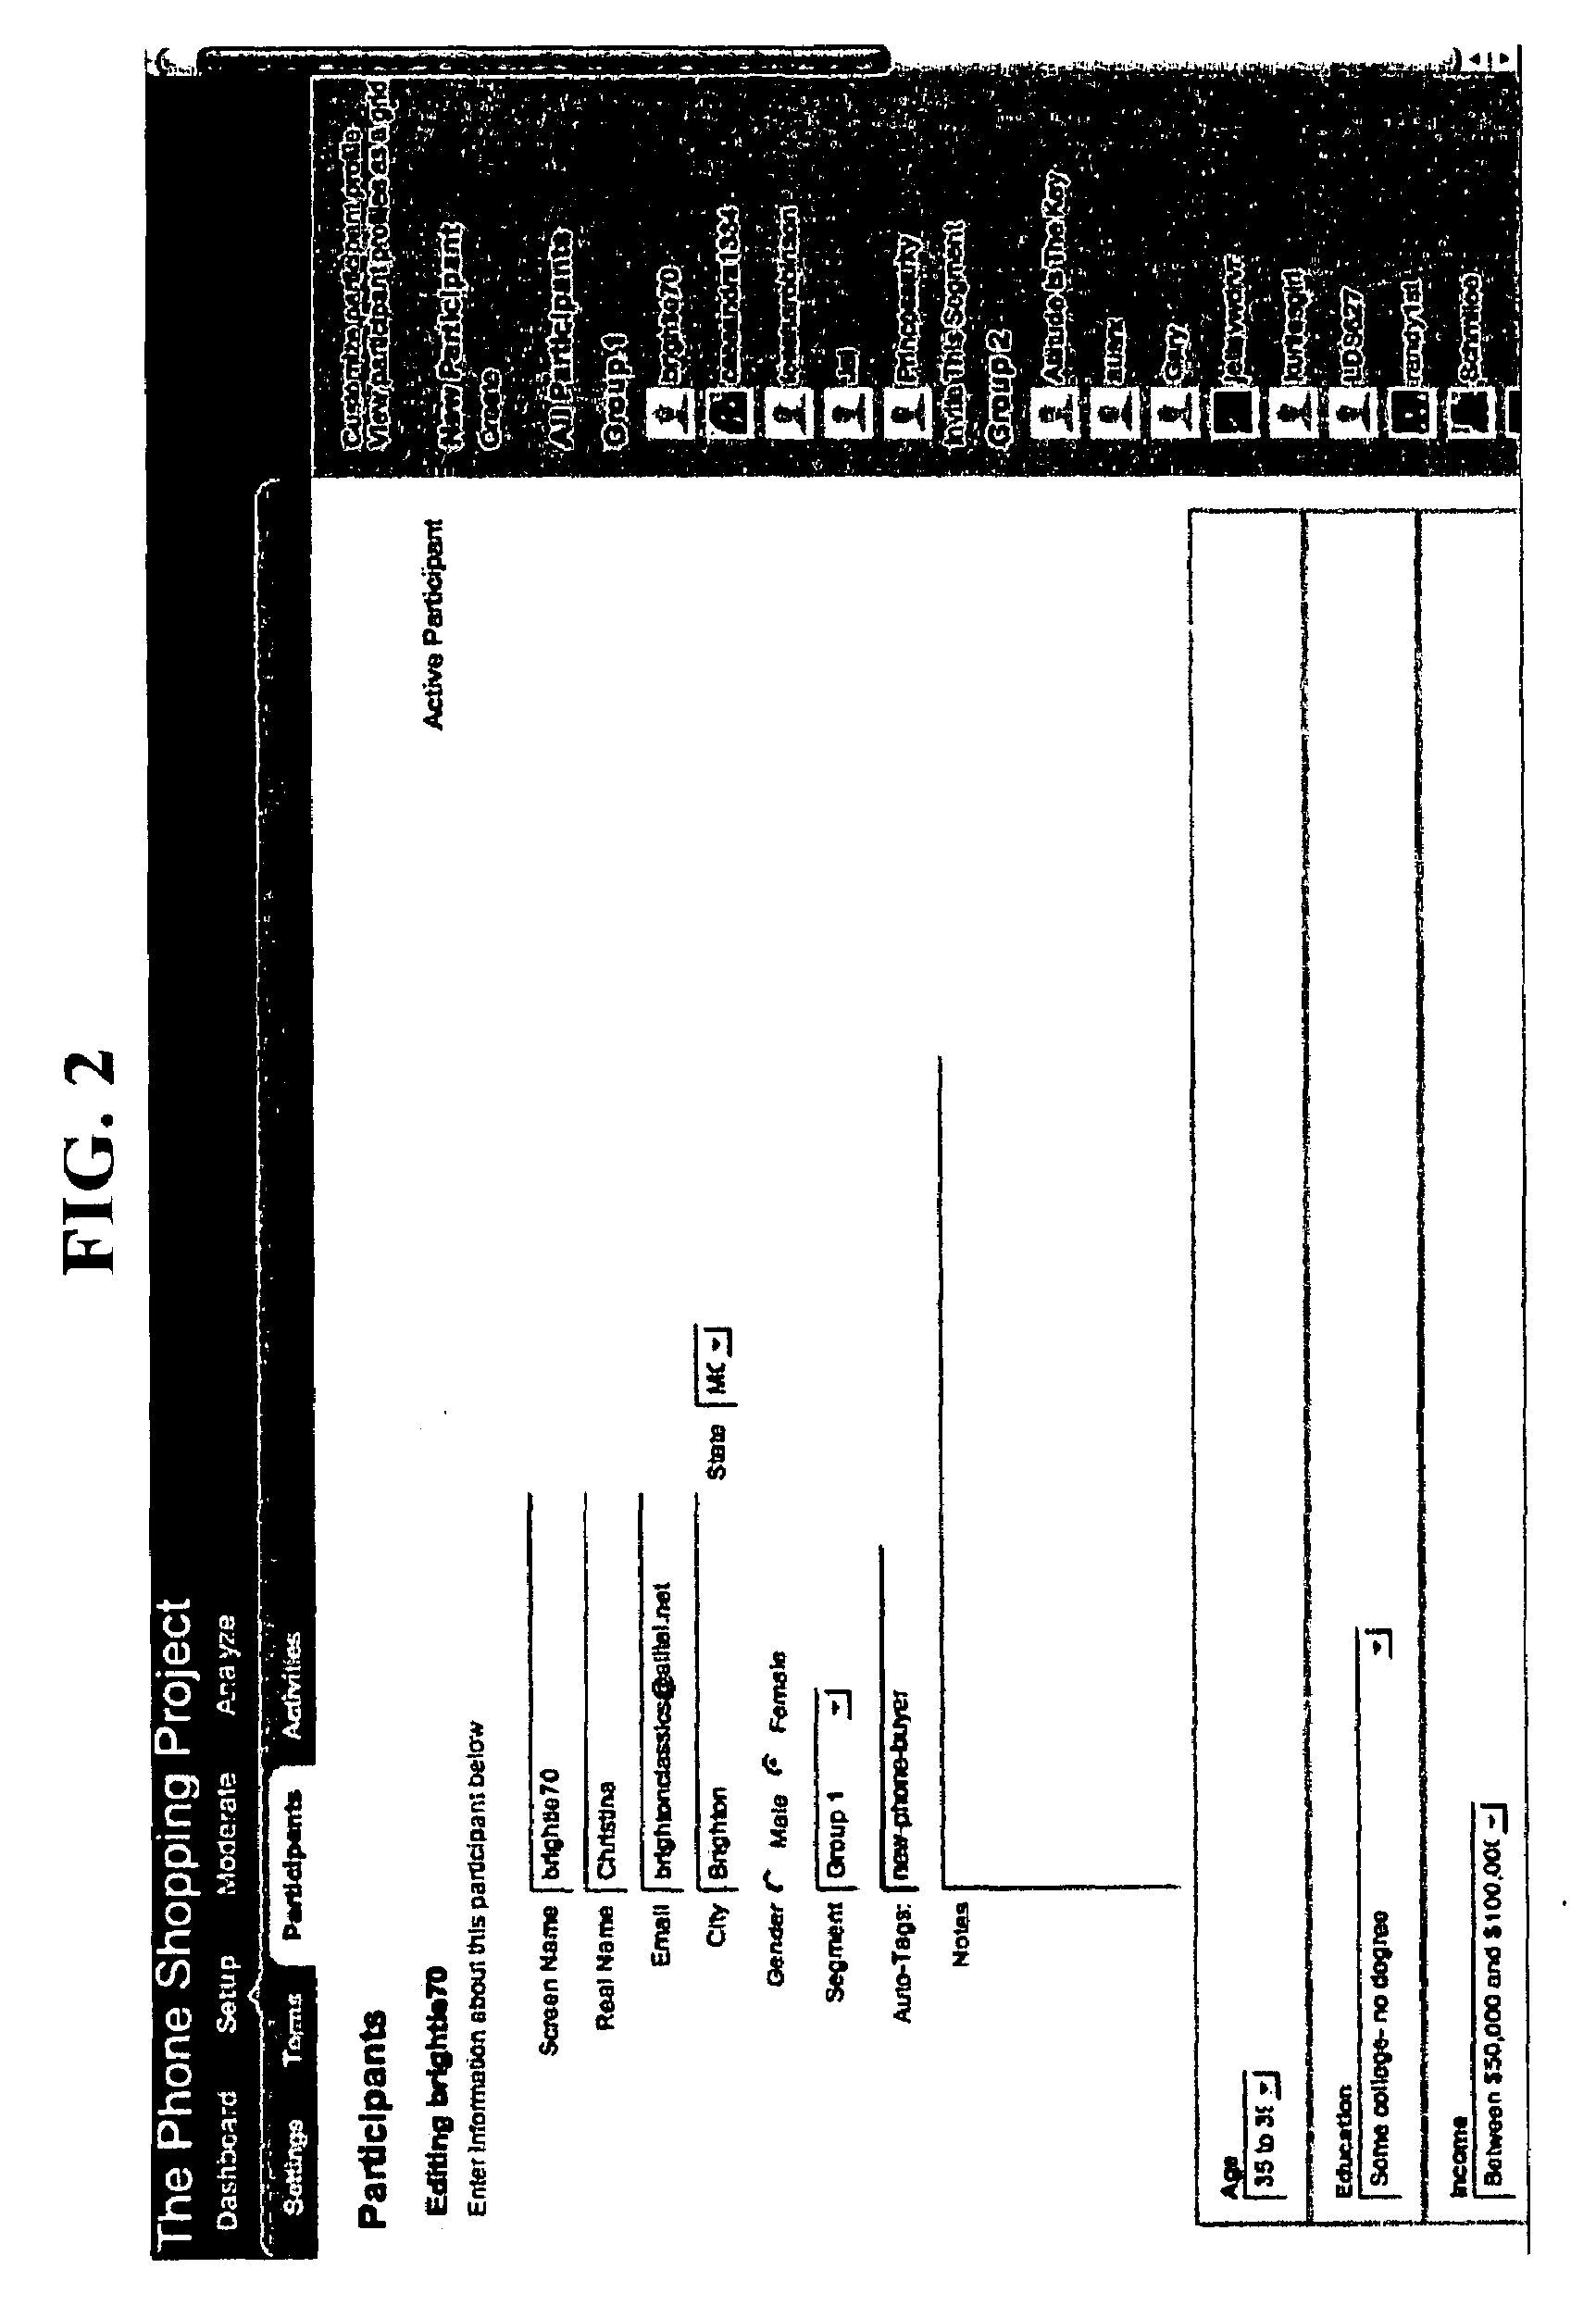
[0010]The queries can seek feedback of two types: qualitative (unstructured) feedback and quantitative (structured) feedback. Quantitative feedback is feedback which is readily summarized by mathematical / statistical means, such as feedback to queries wherein a research participant is directed to respond with a value selected from a continuous range of values (e.g., “approximately what time do you eat breakfast each day?”). As another example, quantitative feedback may be feedback to queries where a research participant is directed to select from a predefined set of discrete values / answers to serve as his / her feedback (e.g., true-false answers, multiple-choice answers, and the like). Qualitative feedback, on the other hand, is effectively unconstrained, and consists of data (text, images / video, audio, etc.) that is freely entered by the research participant at the research participant's discretion. Thus, qualitative feedback is not readily statistically processed. As an example, qualitative feedback may be any data that a research participant supplies in response to the query “what was your impression of [selected mobile telephone model]?”, or it could be any image that a research participant supplies in response to a request to submit a photo of the storefront of his / her favorite vendor. Qualitative feedback is regarded as being particularly valuable to research because it can deliver significant and unexpected insight into research participants' thoughts and behavior. Usefully, the queries (and the means for collecting feedback therefrom) can be scheduled and provided to research participants in a format similar to blogs, message boards, chatrooms, web forms, and other common Internet-based means for collecting
user input. Often, the queries and feedback collection are structured to have the research participants effectively create an online diary, with the participants' entries (their feedback) being made over time, and with their entries containing qualitative and quantitative data directed toward topics of interest by the queries.
[0011]The online queries are then delivered to the research participants in accordance with the queries' scheduled delivery times, and the researcher can collect the feedback online from the research participants (as will be discussed with respect to FIG. 6A and FIG. 6B). Delivery of queries (and collection of feedback) preferably occurs via a website (as exemplified in FIG. 5A, FIG. 5B, and FIG. 5C), whereby the research participants may access the website to see the periodically-updated queries, and may enter or attach their feedback (e.g., by entry of
alphanumeric text in fields, and / or by selecting image, video, and / or audio files for delivery to the researcher / website operator). The website (or other mode of delivery of the queries) can be provided to the personal computers or other communications devices of the research participants, such as to their mobile telephones. Delivery to mobile telephones is particularly valuable because this can allow research participants to provide feedback to queries while engaged in activities relevant to the research project—for example, research participants might provide feedback to queries about selecting a new telephone while actually shopping for the new telephone. Mobile telephones and similar communication devices also allow for easy delivery of queries via audio (and / or by photo / video, provided the
mobile device is photo / video enabled), as well as allowing for possible on-the-go collection of audio, photo, and / or
video feedback from participants.
[0013]In similar fashion, the
system may be configured to allow the scripting and scheduling of future queries to be delivered to particular subsets of research participants selected from the original set of research participants chosen for the research project. In this manner, if it should become evident during the course of research that the research project involves distinct types of research participants (e.g., different “subsegments” of consumers), and these distinctions were not known or appreciated when the research project began, the researcher can more easily prepare queries tailored to the particular subsets of research participants involved.
[0018]The researcher may then use the
research system to generate a report with summary observations and conclusions (as will be discussed with respect to FIG. 10), with the report being designed for delivery to the party who commissioned the research project. Here, the
research system may allow a researcher to simply draft the text of his or her observations and conclusions, and insert / attach supporting data. For example, the researcher might insert / attach selected feedback entries from research participants (which might be readily selected from feedback entries corresponding to tag labels related to the topic of interest), and / or might insert / attach the aforementioned numeric / graphical summaries of quantitative data. Preferably, the research
system allows delivery of the summary report in printed form (e.g., in a paper reviewing observations and conclusions and having the supporting data presented in cross-referenced appendices, or printed following each observation / conclusion), or in
electronic form (e.g., in a document provided in RTF format, or in a markup language such as
HTML or
XML, with hyperlinks allowing a reviewer to readily move between observations / conclusions and supporting data).
[0019]To ease the administration of research projects, the research project (and its scheduled queries, collected feedback, and other tasks / events) are preferably displayed to the researcher along a timeline, e.g., a calendar or
linear array of dates / times (as exemplified in FIG. 6A and FIG. 6B). Most preferably, the timeline presents dates and times in combination with a visual display of the online queries (which can be situated on the timeline at their time of delivery); the feedback collected from the research participants in response to the online queries (which can be situated at their actual time of collection, or at the scheduled deadline for collection); and the number of research participants who have (or have not) provided feedback to the online queries (these numbers being situated at the point on the timeline corresponding to the
current time). Here, it should be understood that the actual online queries and their feedback need not be displayed on the timeline—this matter may be voluminous, and not readily displayed in a compact manner along a timeline—and thus the queries and feedback may be presented in iconic / symbolic form. The number of responding and nonresponsive research participants is usefully displayed along the timeline because this allows a researcher to determine whether a research project is proceeding as scheduled. To this end, and as exemplified by FIG. 6B and FIG. 7, the research
system usefully provides an alert to the researcher if a research participant does not provide feedback to an online query within a predetermined time period (e.g., by the scheduled deadline, or at the time the next query is to be delivered), and the research system might also deliver a reminder to a research participant in this event (e.g., via email or
voicemail). The reminder can be composed by the researcher, and can be stored by the research system in association with its related query and / or with the scheduled feedback deadline. Ideally, the display of the timeline allows a researcher to easily reschedule an event (e.g., delivery of queries) by simply dragging and dropping it along the timeline, and allows easy revision of queries or other matter by simply clicking on the matter along the timeline to open and access it for revision.
[0020]Another useful feature of the invention is that it enables a researcher to conduct a research project among one or more of the aforementioned
consumer segments—i.e., among one or more defined sets of research participants—and readily redefine the segments, as by moving research participants among segments or reducing or expanding the research participants within a segment, with no or little
impact on the conduct of the research project. In other words, researchers may (unless otherwise desired) redefine segments without altering the content or delivery of queries, the collection and
processing of feedback, the generation of reports, etc.


