
Collecting, sharing, comparing, and displaying resource usage data

a resource usage and data technology, applied in the field of collecting, sharing, comparing, and displaying data, can solve the problems of limited and non-specific feed-back, negative environmental consequences of use, and inability to meet the needs of users, and achieve the effect of facilitating comparison

Active Publication Date: 2008-12-11
ABL IP HLDG
View PDF17 Cites 283 Cited by
  • Summary
  • Abstract
  • Description
  • Claims
  • Application Information

AI Technical Summary

Benefits of technology

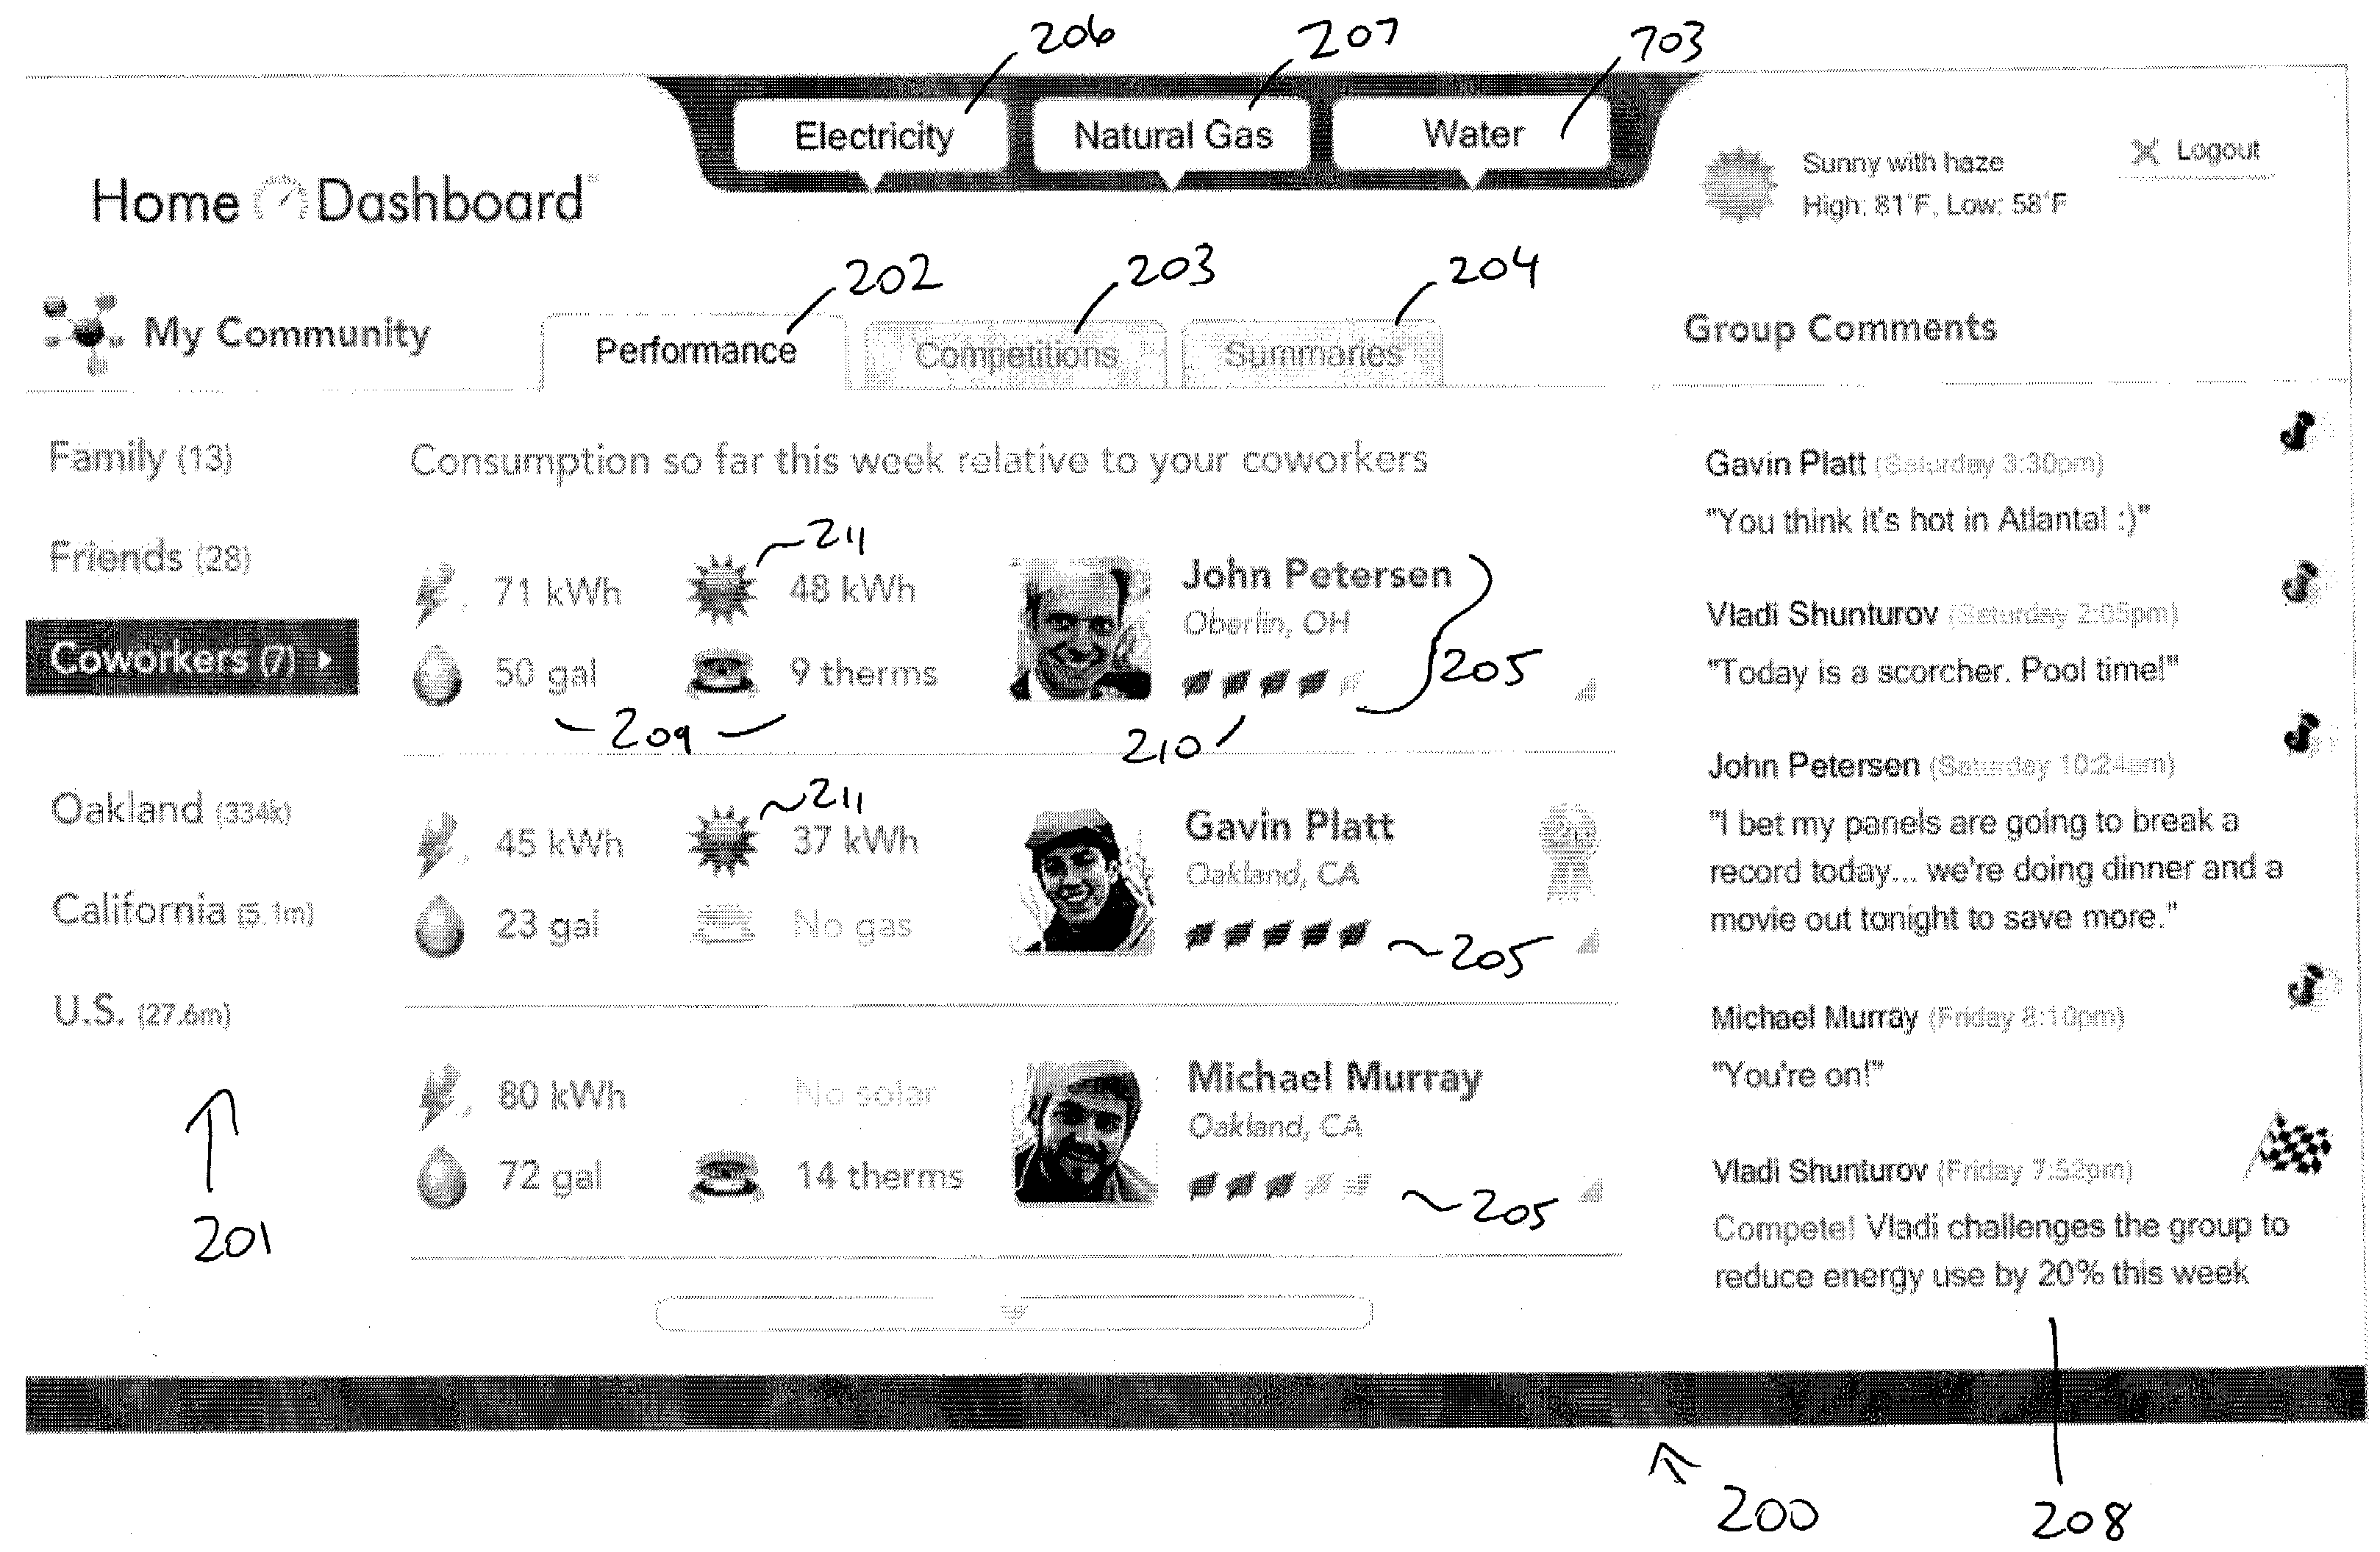
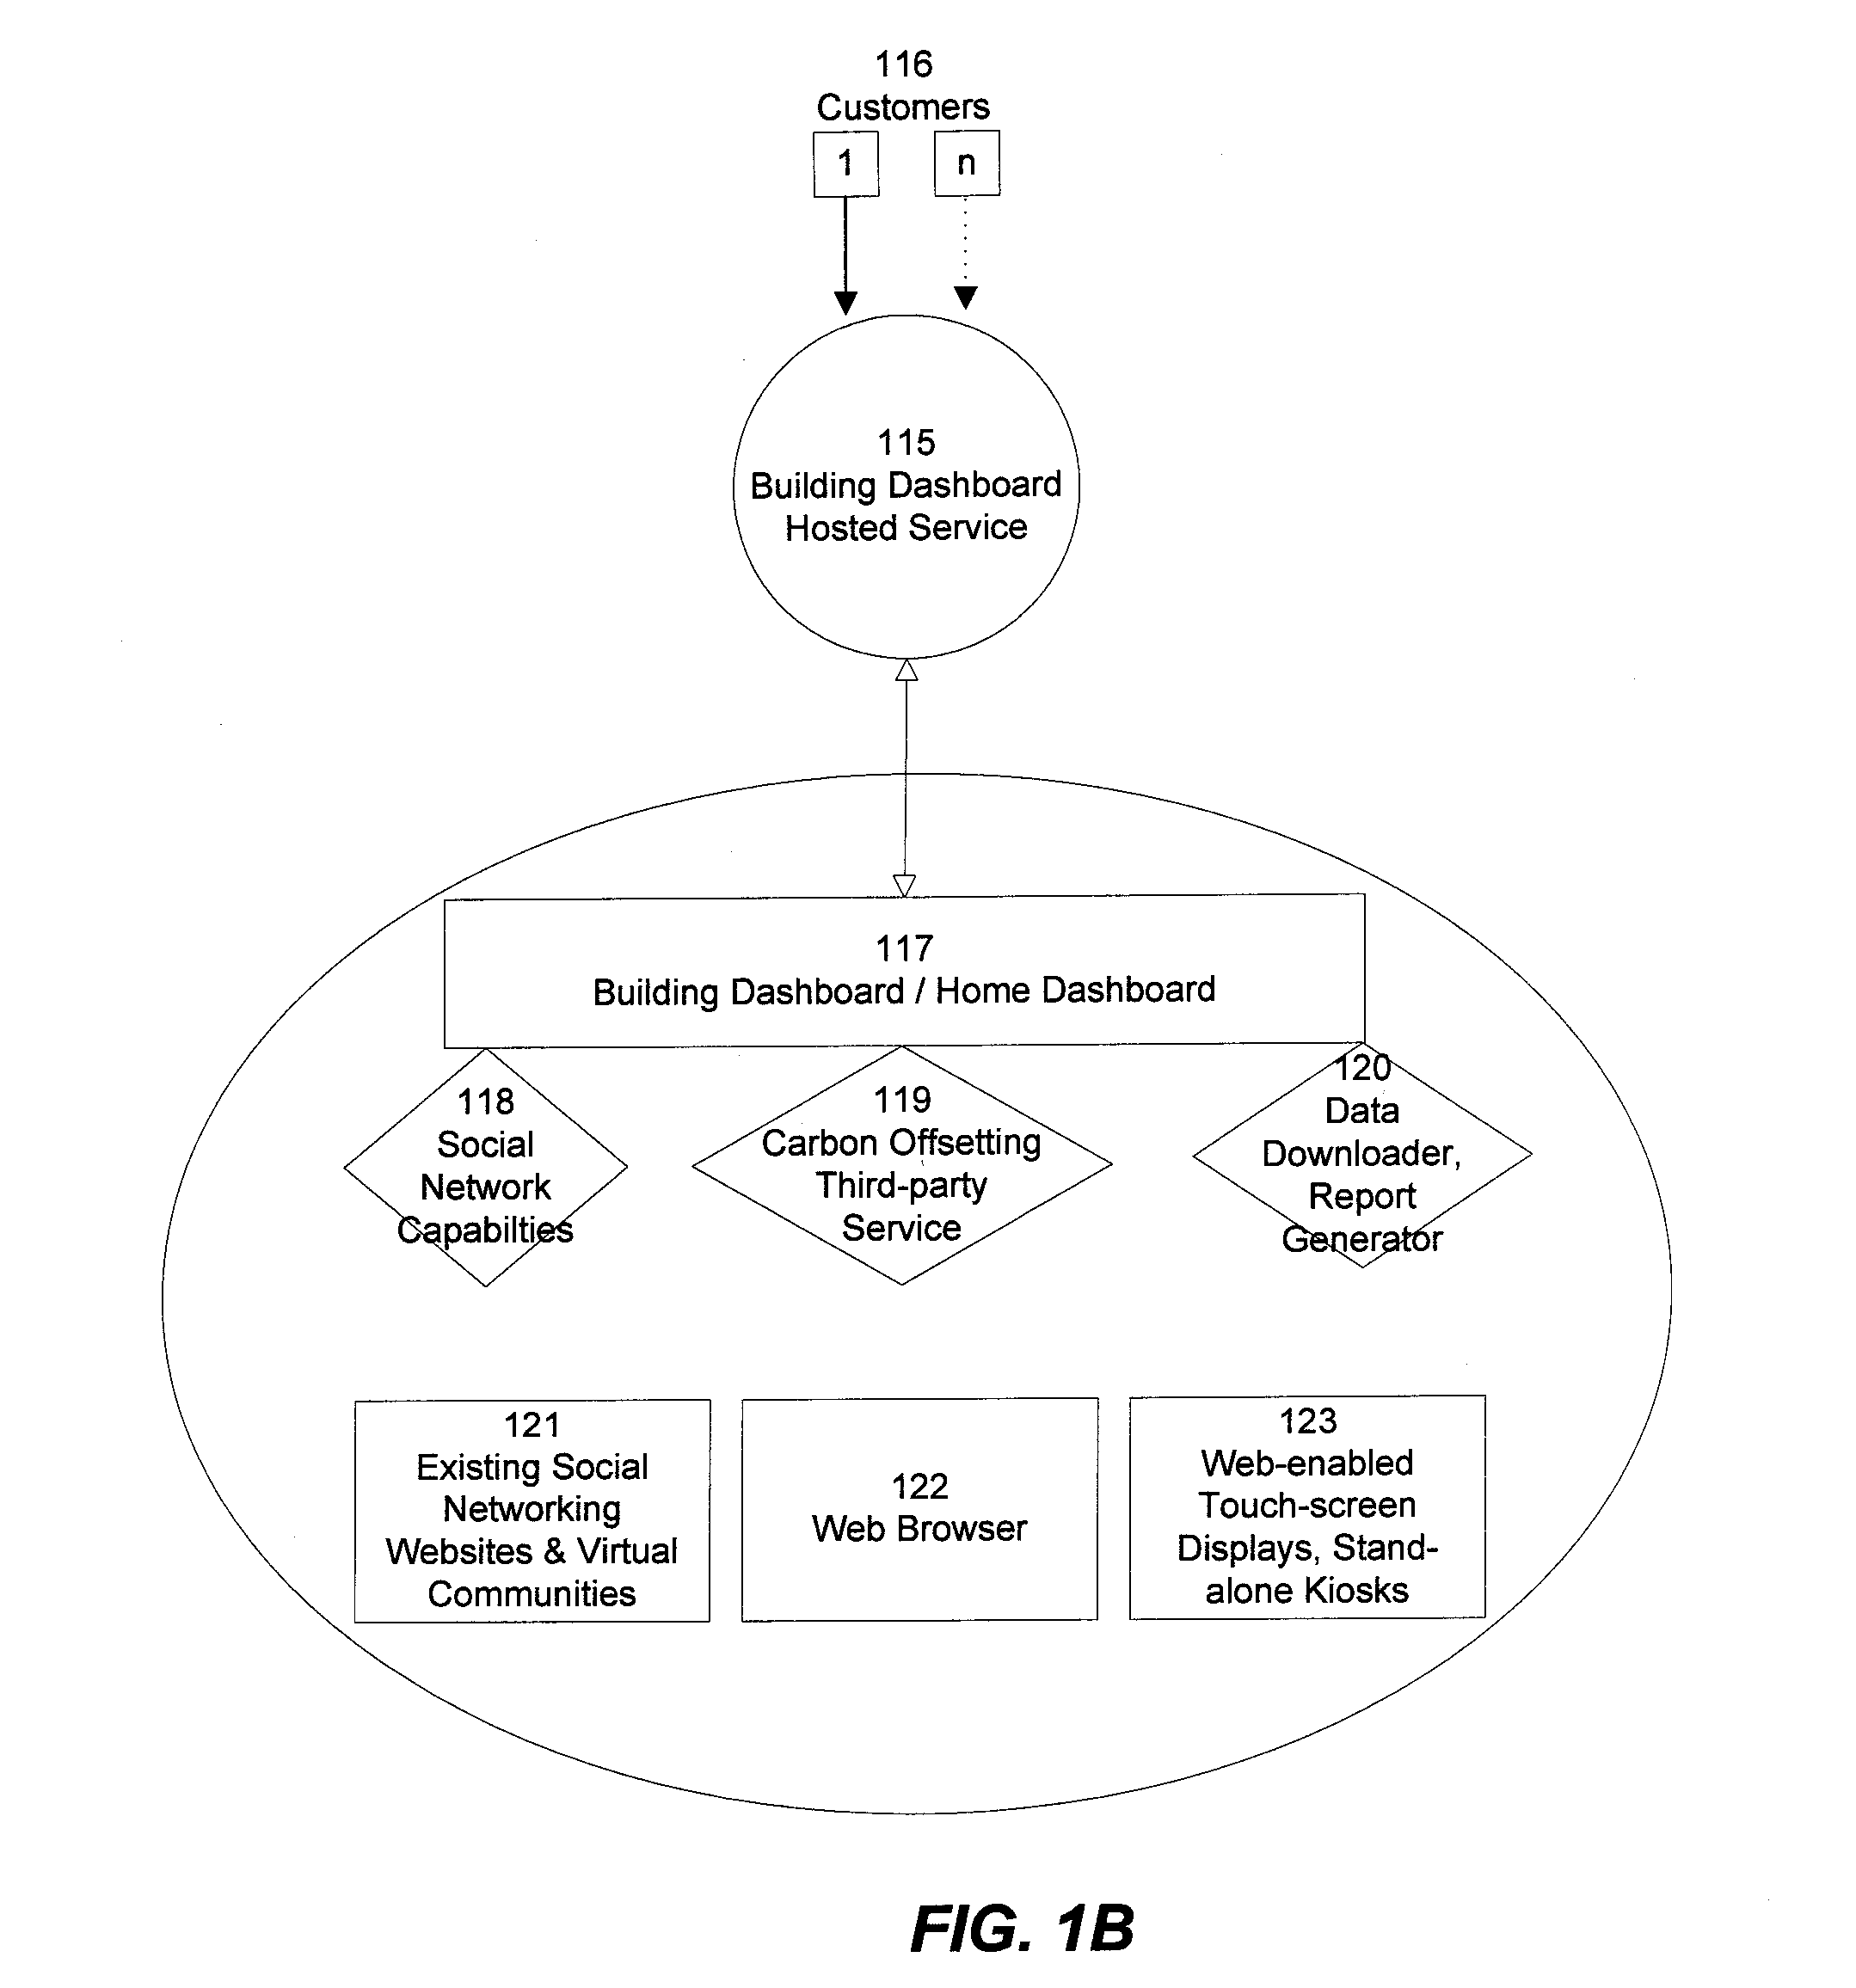
[0013]Entities are also able to publish and / or selectively share their resource usage data with specified other entities. Entities can also engage in competition with other entities so as to further encourage resource conservation and responsible usage patterns. Competitions serve as an important motivational mechanism for reducing resource consumption. Entities can share their data in a group environment such as a social network, including 1) specialized social networks designed for sharing resource usage data and / or 2) existing social networks such as Facebook or MySpace. In the context of such shared environments, entities can set mutual or shared goals; and can engage in competitions with other entities so as to provide further incentives for conservation. Sponsors may also be enlisted to provide monetary or product incentives for improvements during specific time periods.
[0017]The present invention also facilitates comparison of a current temporal pattern of consumption with a previously established temporal pattern of consumption over either a defined time period (e.g. this week with last week) or with a long-term pattern of consumption over similar time periods (e.g. hourly data for this week compared with median hourly consumption for all previous week's at this particular season), so as to highlight the effect of certain events or changes on energy consumption. Events, such as installation of a new energy-saving device or a change in settings, can be tagged. These tagged events then appear in graphs and subsequent displays or reports so that the entity can determine whether the event had any effect on resource usage. In this manner, the present invention helps identify those changes that are most effective in managing consumption.
[0026]The present invention thus provides a system and method by which resource usage data can be shared and compared. The invention further allows entities to communicate, contrast, and compete with one another regarding resource usage in a social networking environment.

Problems solved by technology

Many such resources, such as electricity, natural gas, and water are scarce and / or expensive; in addition, their use can have negative environmental consequences.
Traditionally, such feed-back has been limited and nonspecific; often, the only feedback an entity receives is the monthly utility bill.
With limited or non-existent information the entity is unable to effectively isolate and identify appliances and / or equipment that are responsible for the greatest resource usage.
Conservation efforts are greatly hampered by this lack of information.
Existing resource usage monitoring technologies typically lack a mechanism for an entity to compare its resource usage with that of other entities.
Existing resource usage monitoring techniques generally do not provide effective, intuitive, and convenient mechanisms for sharing data in this manner.
Existing resource usage technologies do not provide an easy way to compare temporal patterns in this way; it is therefore difficult for entities to establish a cause-and-effect relationship that can help improve understanding of the effectiveness of resource conservation efforts.
Existing resource usage monitoring products fail to provide these features.
None of these products provides a comprehensive mechanism for collecting, displaying, sharing, and comparing resource usage data.
Nor do these products offer a computer interface allowing an entity to mark an event (such as the install date of a device) and compare pre-event usage with post-event usage.

Method used


Image

  • Collecting, sharing, comparing, and displaying resource usage data
  • Collecting, sharing, comparing, and displaying resource usage data
  • Collecting, sharing, comparing, and displaying resource usage data

Examples


Embodiment Construction

[0046]As mentioned above, the description uses the terms “user”, “customer”, and “entity” interchangeably to refer to either an individual user or a group of users. A “user”, “customer”, or “entity” may therefore include any or all of an individual user, household, company, organization, or any definable groups (which may be defined according to any relevant criteria, such as for example social, economic, geographic, demographic, and / or other criteria). Groups may include individuals who do not directly pay utility bills, such as for example renters whose utilities are included in rent payments, employees of companies, and the like.

[0047]In the following description of embodiments of the present invention, numerous specific details are set forth in order to provide a more thorough understanding of the present invention. However, it will be apparent to one skilled in the art that the present invention may be practiced without one or more of these specific details. In other instances,...


PUM


Abstract

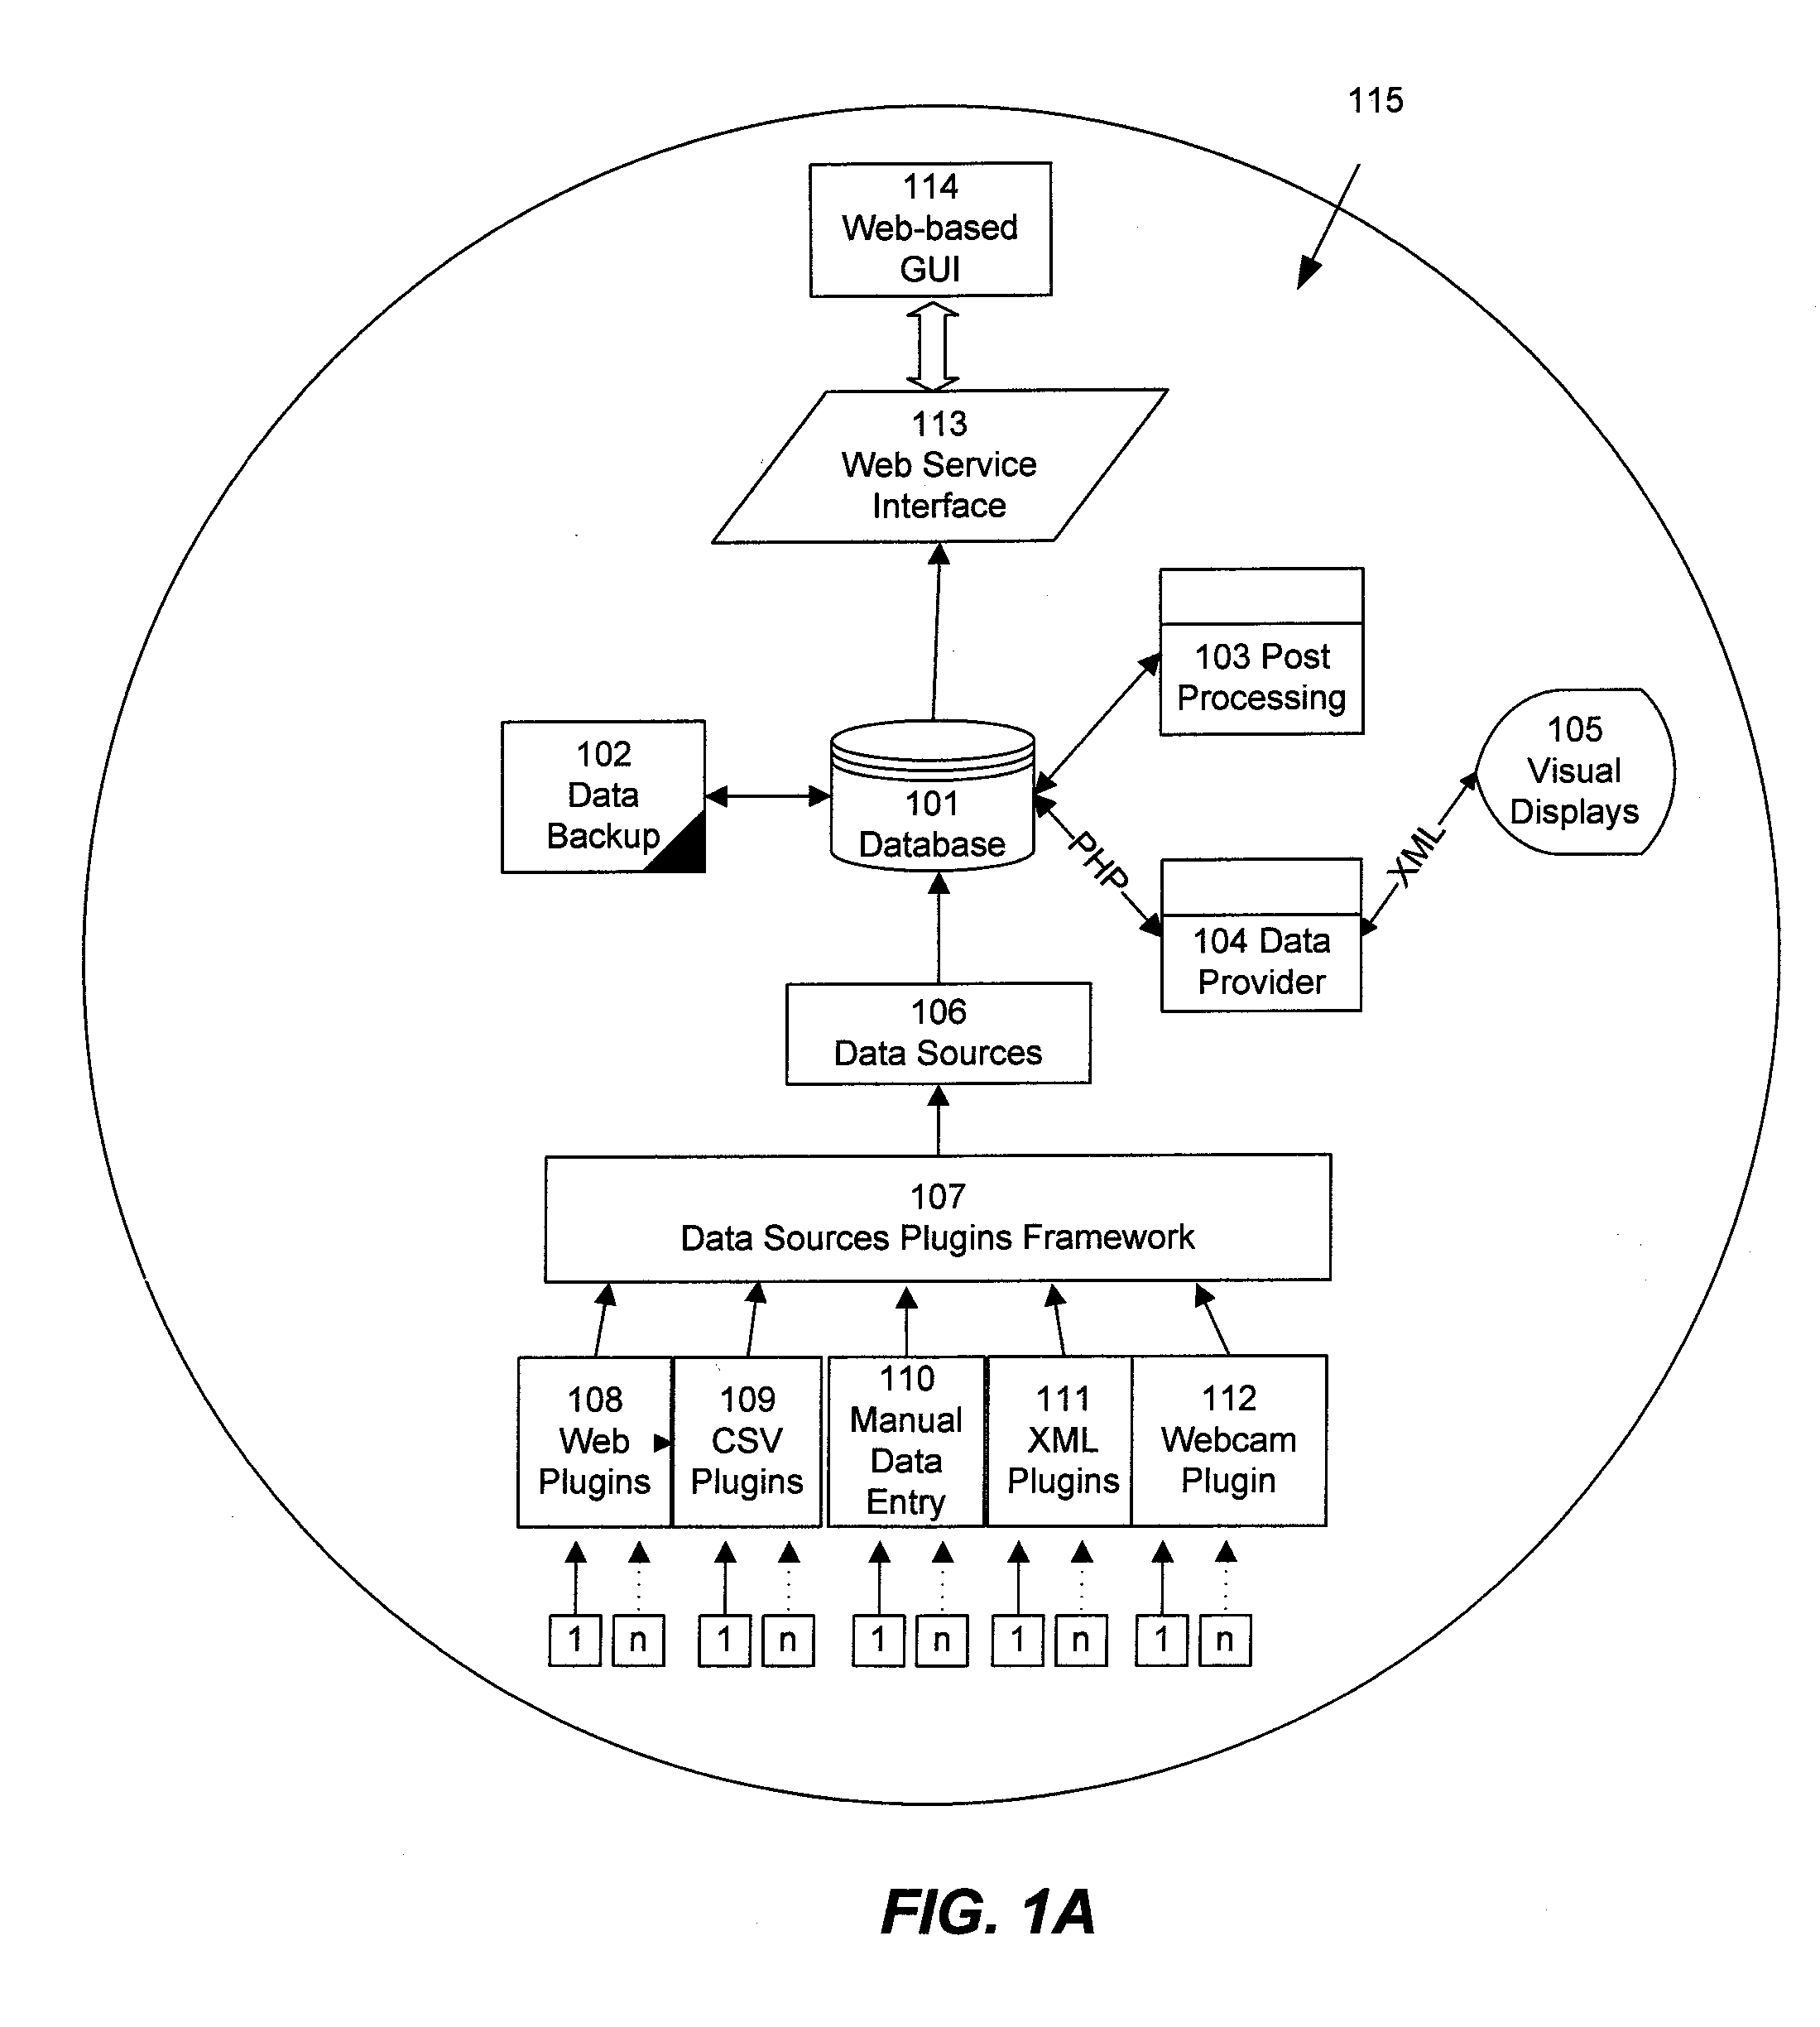
Resource usage data is automatically collected for an individual, house-hold, family, organization, or other entity. The collected data is transmitted to a central repository, where it is stored and compared with real-time and / or historical usage data by that same entity and / or with data from other sources. Graphical, interactive displays and reports of resource usage data are then made available. These displays can include comparisons with data representing any or all of community averages, specific entities, historical use, representative similarly-situated entities, and the like. Resource usage data can be made available within a social networking context, published, and / or selectively shared with other entities.

Description

CROSS-REFERENCE TO RELATED APPLICATIONS[0001]The present application claims priority from U.S. Provisional Patent Application No. 60 / 943,075, filed on Jun. 11, 2007 and entitled “Method and Apparatus for Energy Monitoring and Management of Buildings and / or Facilities”, the disclosure of which is incorporated herein by reference.FIELD OF THE INVENTION[0002]This invention relates generally to collecting, sharing, comparing, and displaying data related to resource usage, and further to interactive and comparative displays of such information in group environments such as social networks.BACKGROUND OF THE INVENTION[0003]Consumers of resources often have economic and / or environmental incentives to engage in conservation. Many such resources, such as electricity, natural gas, and water are scarce and / or expensive; in addition, their use can have negative environmental consequences. Increased awareness of the environmental and economic impacts of resource usage has caused individuals, orga...

Claims


Application Information

Patent Timeline
IPC IPC(8): G06F7/10
CPCG06Q10/10G06Q30/0218
Inventor MURRAY, MICHAEL EDWARDPETERSEN, JOHN EDMUNDPLATT, GAVIN MATTHEWSHUNTUROV, VLADISLAV KANTCHEV
Owner ABL IP HLDG
Learn More