
Sample analyzer and sample analyzing method

a sample analyzer and sample technology, applied in chemical methods analysis, instruments, data acquisition and logging, etc., can solve the problems of difficult to determine the point at which the difference between the two input values becomes less than the threshold value, and the saturation value itself becomes quite difficult to determin

Active Publication Date: 2008-07-31
SYSMEX CORP
View PDF3 Cites 12 Cited by
  • Summary
  • Abstract
  • Description
  • Claims
  • Application Information

AI Technical Summary

Benefits of technology

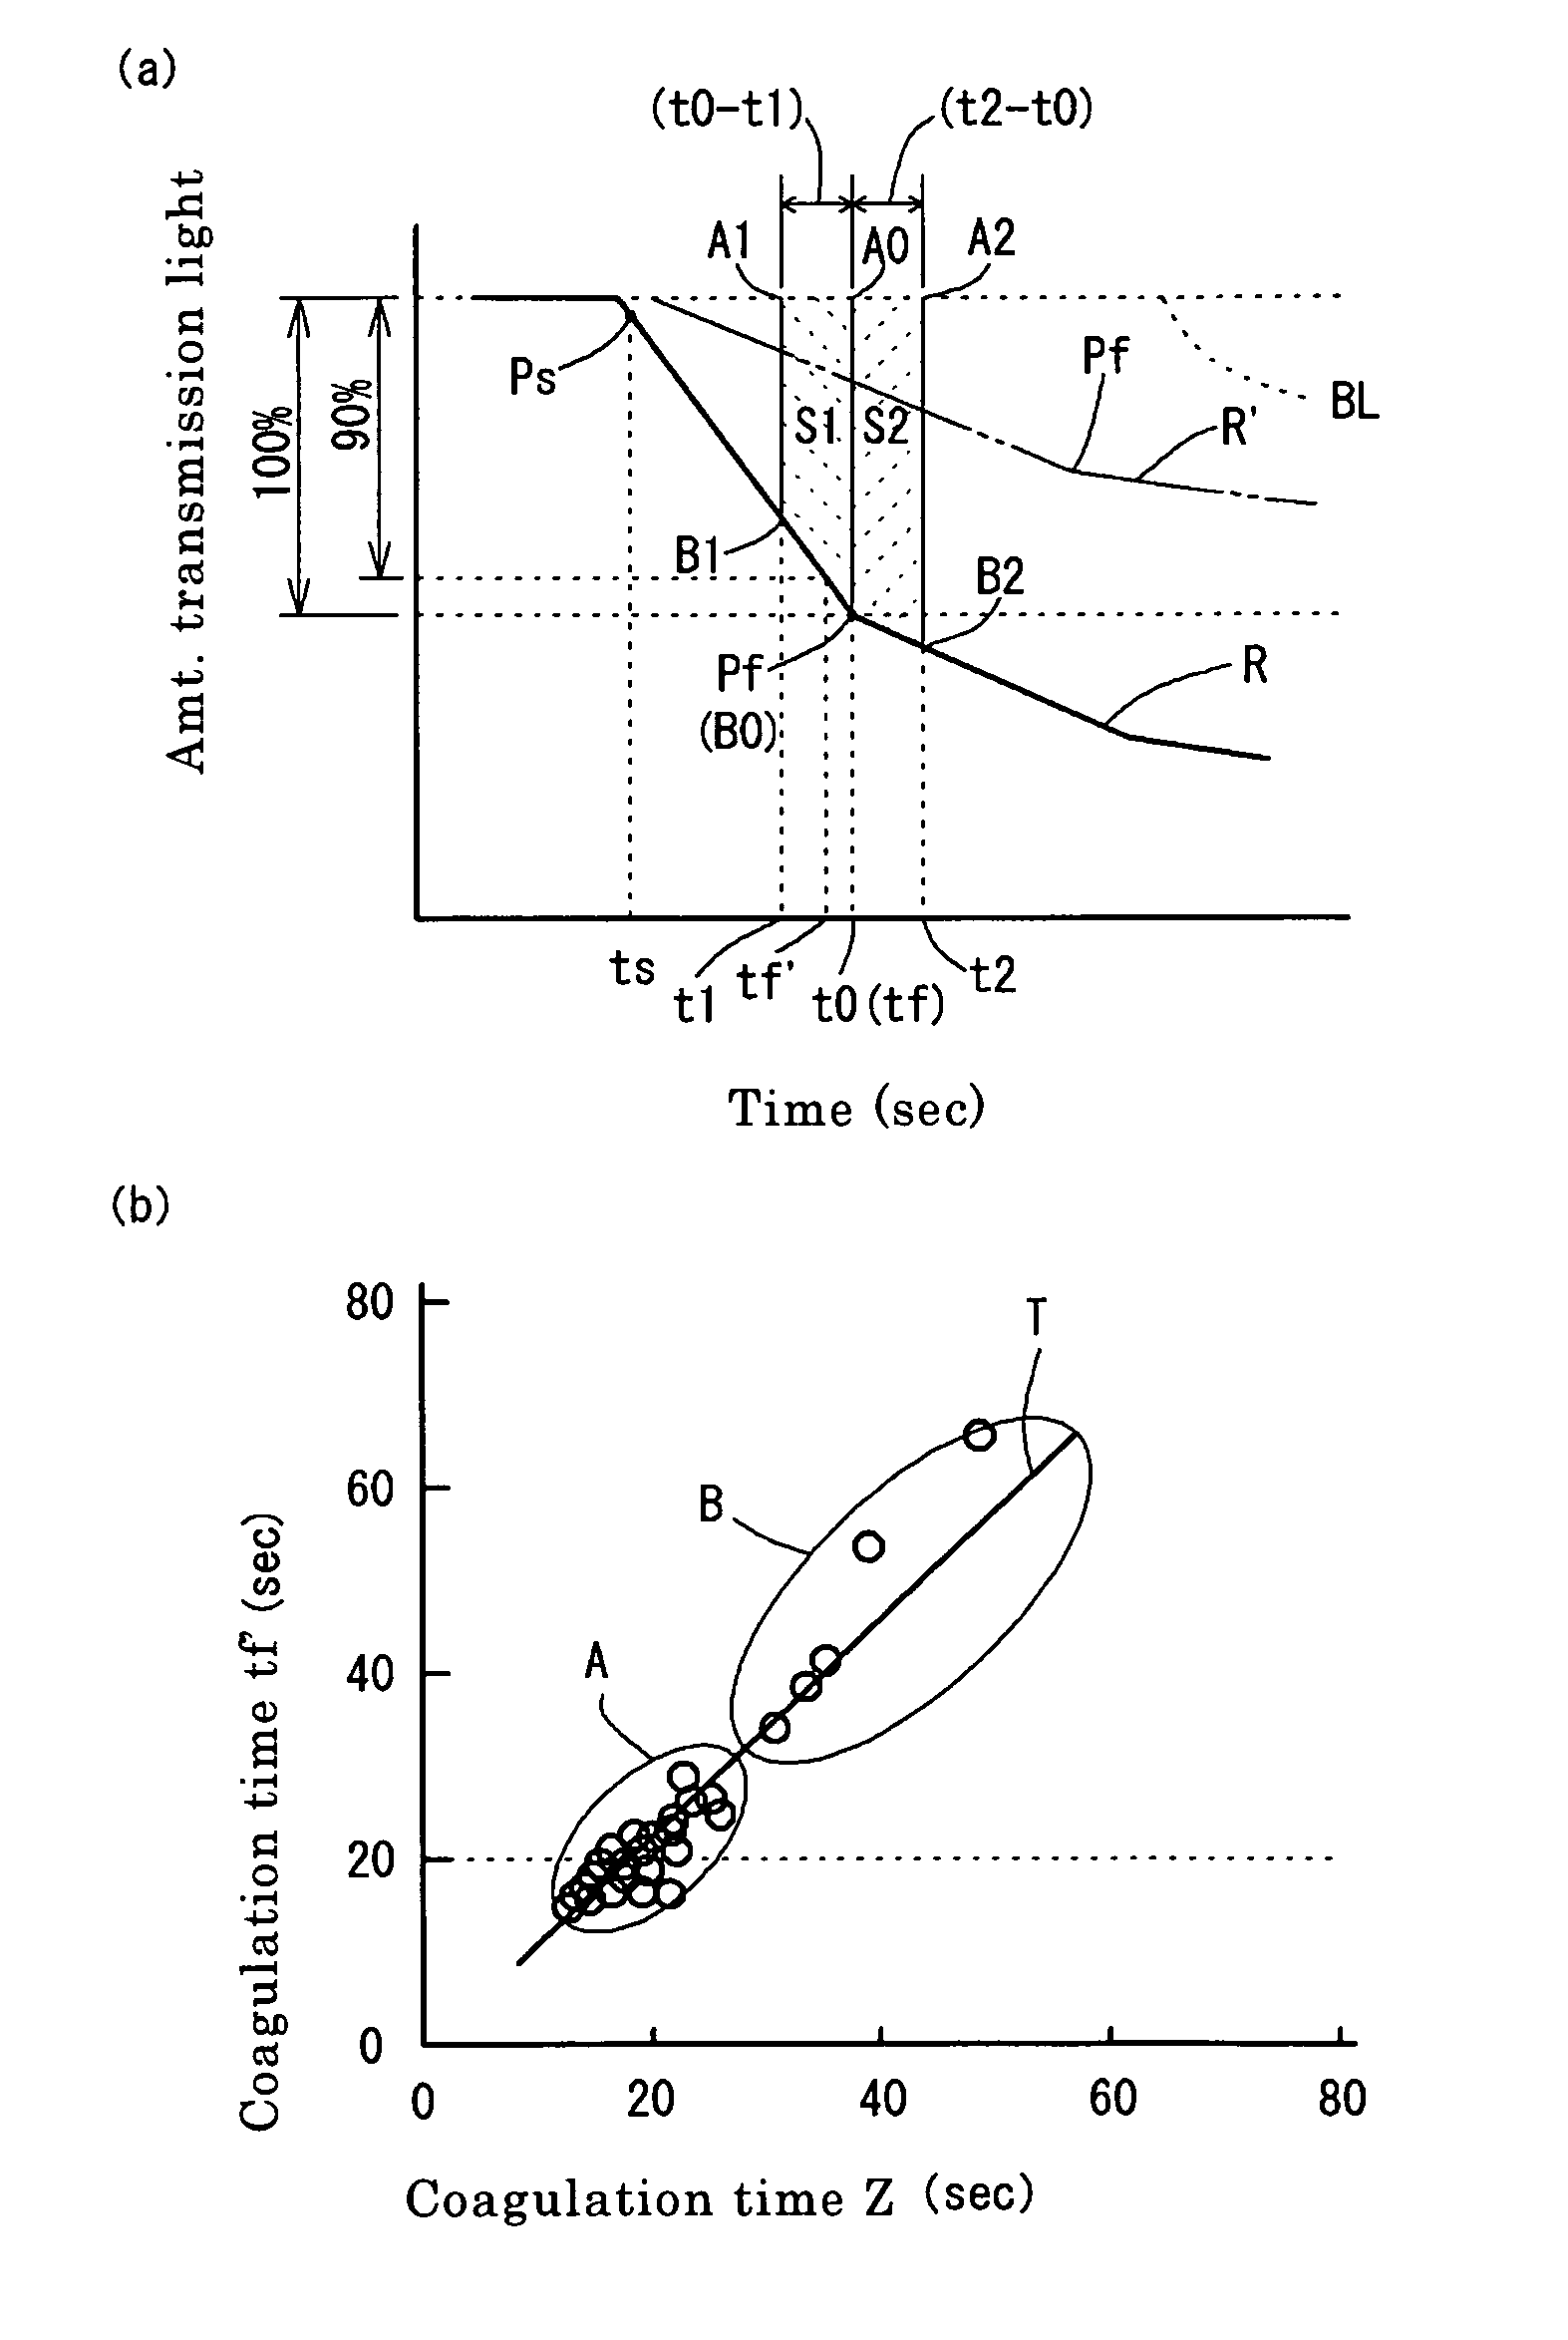
[0013]A third aspect of the present invention is a sample analyzer comprising: a means for optically measuring reaction of a sample mixed with reagent, and obtaining optical information therefrom; a generating means for generating a reaction curve representing change in the optical information over time; a determining means for determining a reaction end point based on a first value which represents an amount of a predetermined component generated by a reaction in the sample during a predetermined time period prior to an evaluation target time (t0), and a second value representing an amount of the predetermined component generated by a reaction in the sample during a predetermined time period after the evaluation target time (t0); and an acquiring means for obtaining a characteristic of a sample based on the determined reaction end point.

Problems solved by technology

Since the saturation value is determined based on the difference between two input values in the art disclosed in Japanese Laid-Open Patent Publication No. 10-123140, an accurate saturation value can not be determined because there is a large fluctuation in the difference between the two input values and the noise in each input value.
Moreover, in some cases of specific measurement items and blood samples (for example, samples with high concentration of fibrin or heparin) which exhibit constant change in the amount of scattered light even after the actual coagulation reaction has ended, it may be difficult to determine the point at which the difference between the two input values becomes less than the threshold value.
Thus the determination of the saturation value itself becomes quite difficult.

Method used


Image

  • Sample analyzer and sample analyzing method
  • Sample analyzer and sample analyzing method
  • Sample analyzer and sample analyzing method

Examples


Embodiment Construction

[0024]The preferred embodiments of the present invention will be described hereinafter with reference to the drawings.

General Structure of the Sample Measuring Apparatus 1

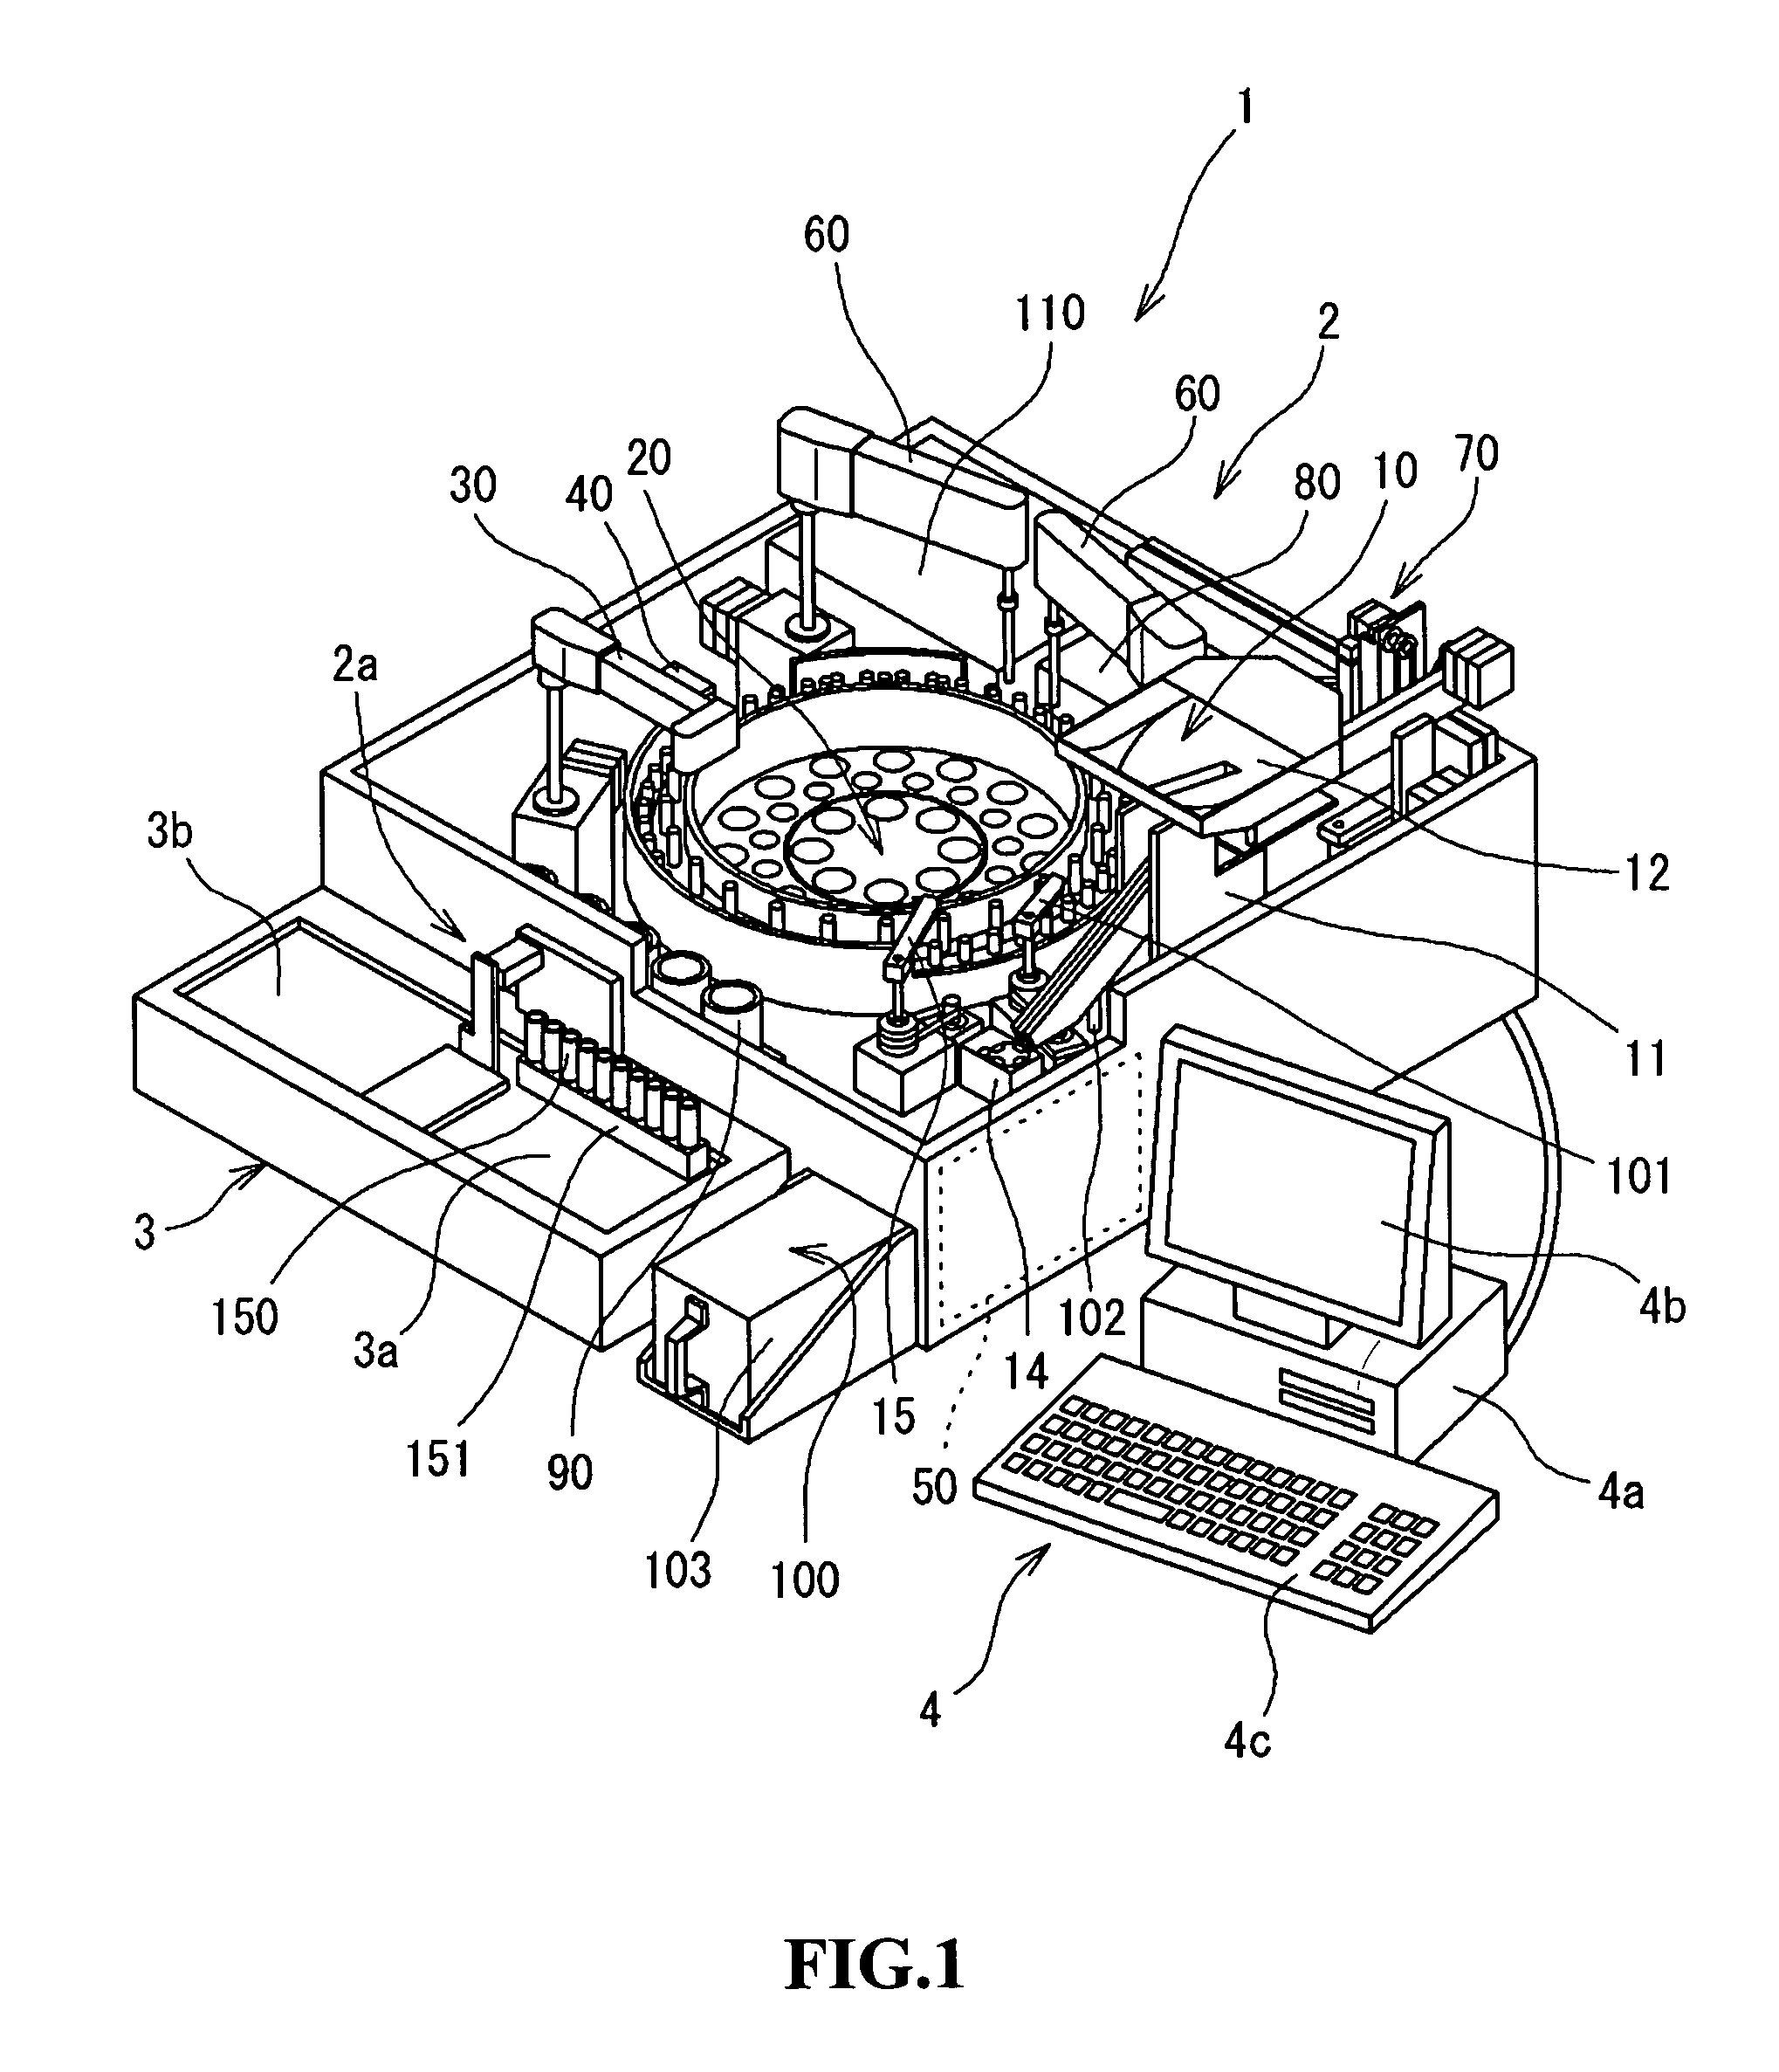
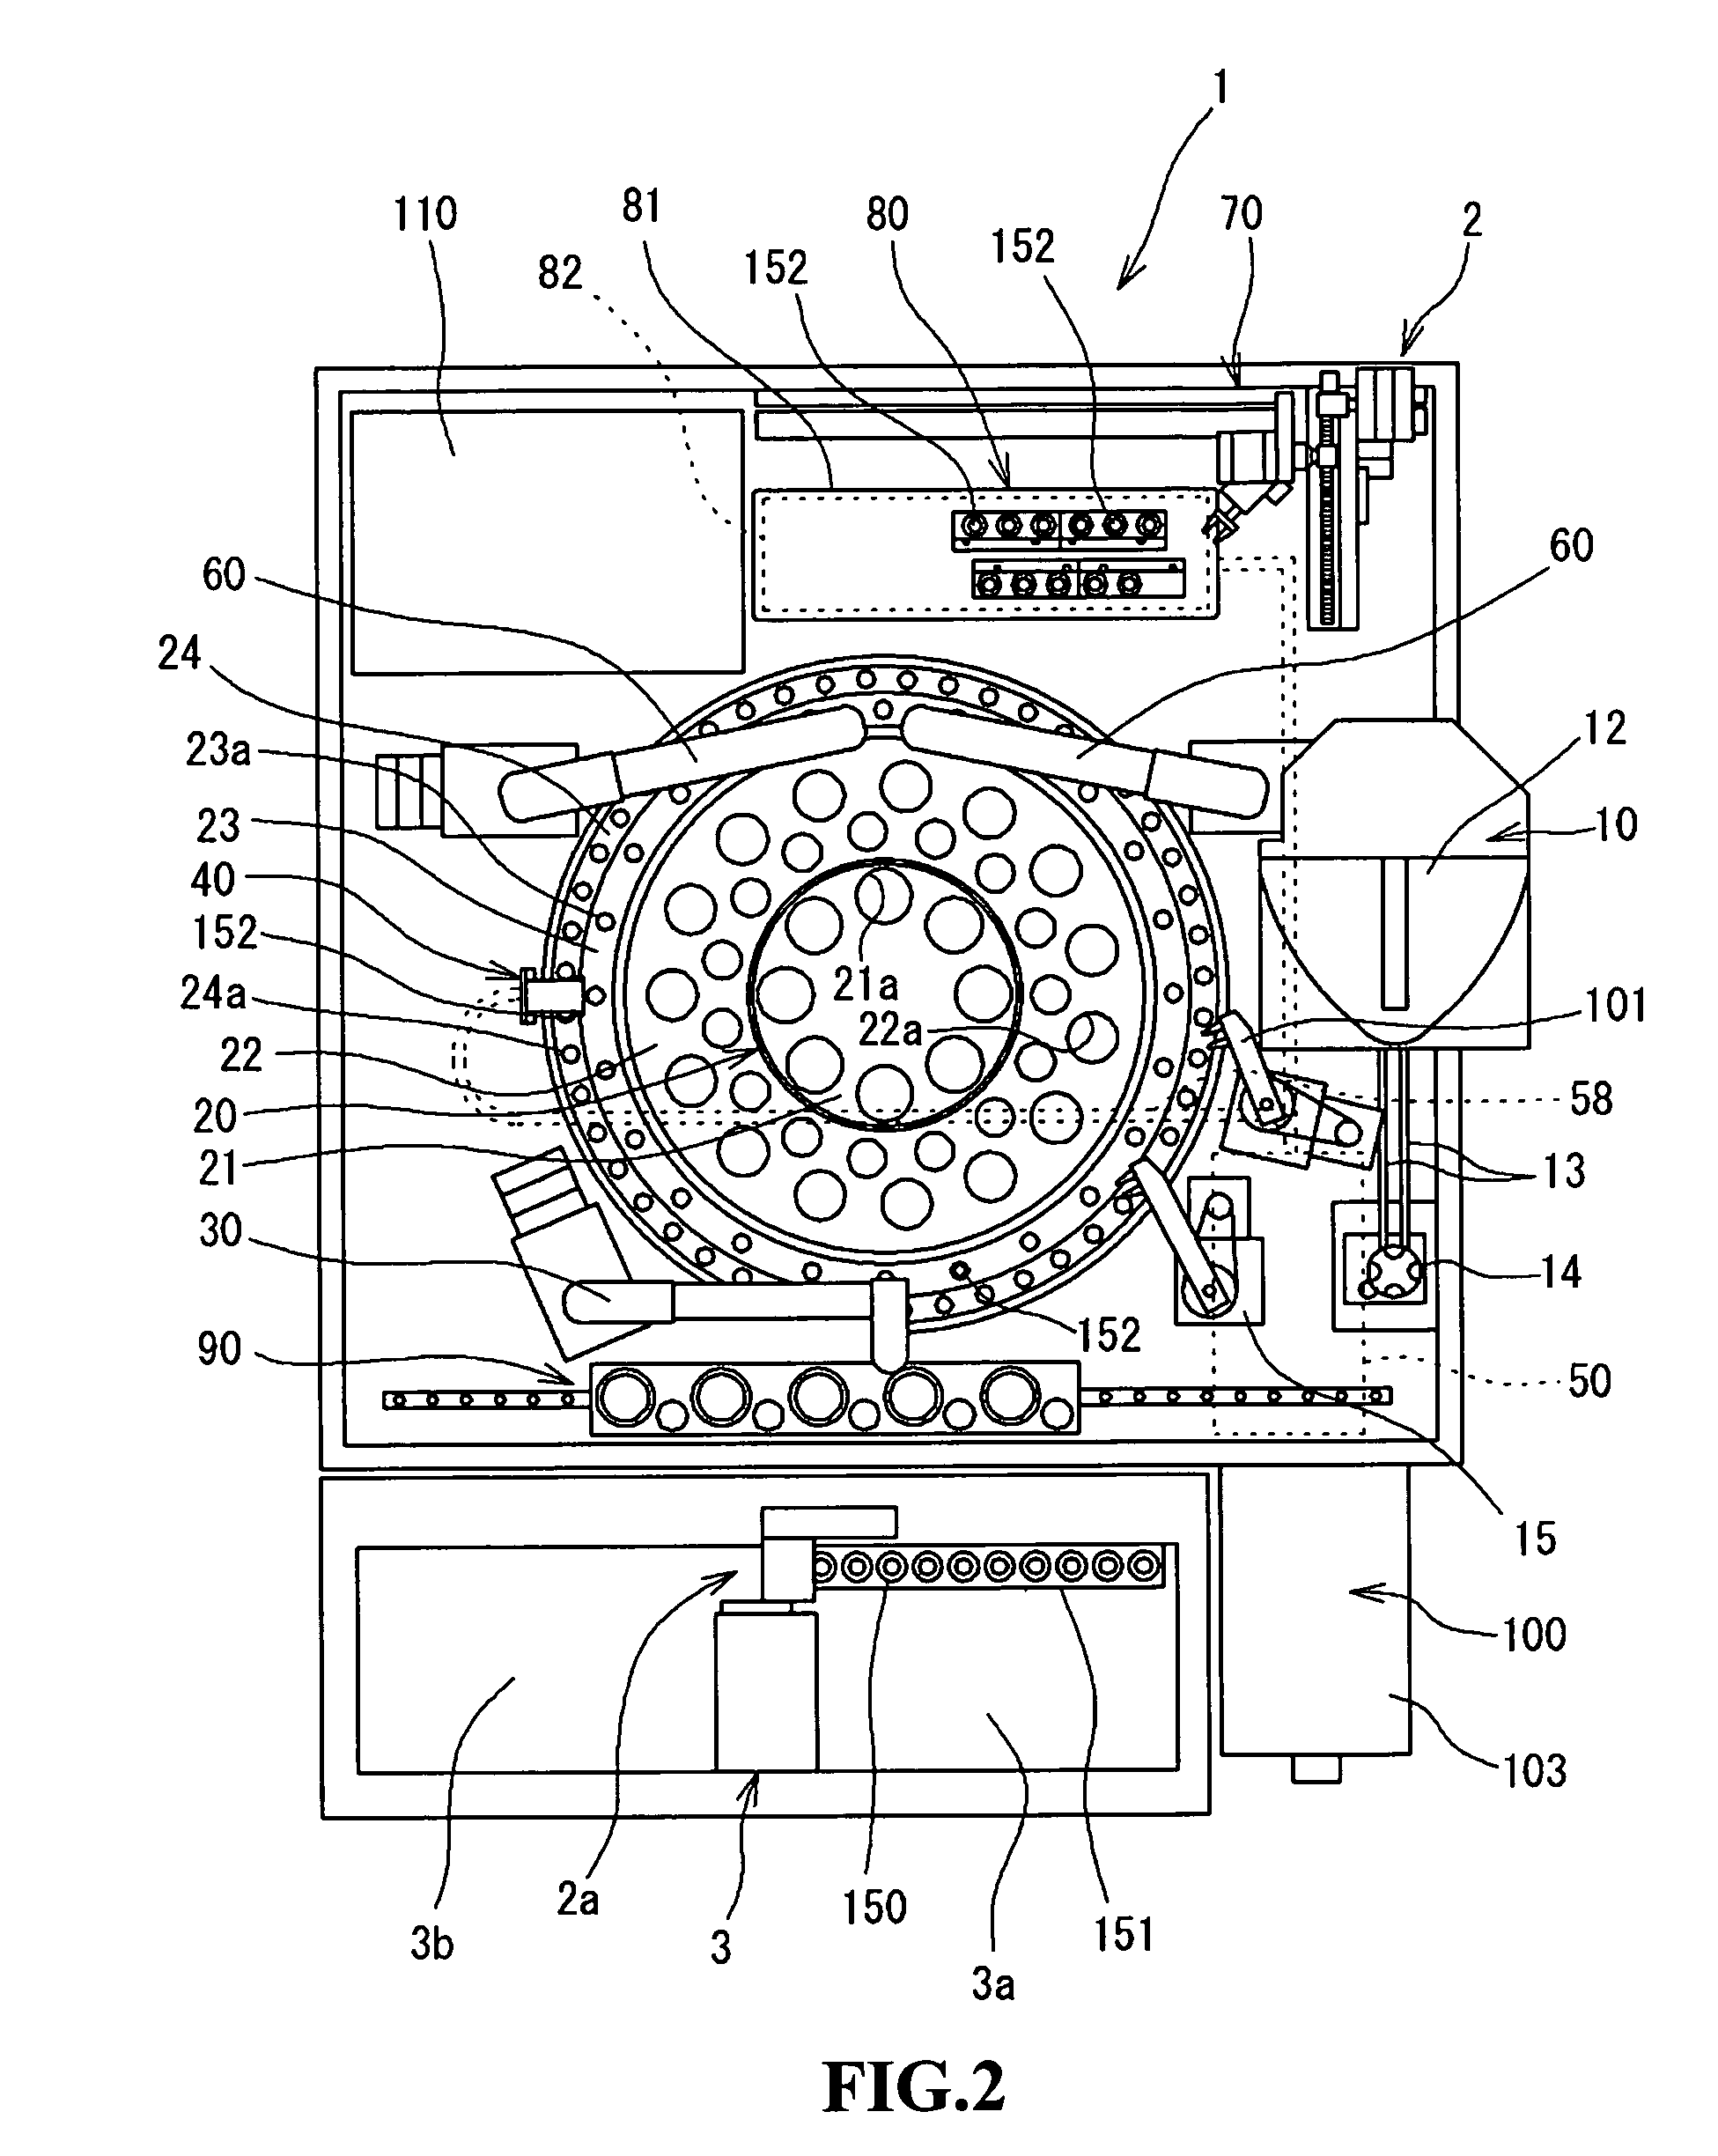
[0025]The sample measuring apparatus 1 of the present embodiment is a blood analyzer for optically measuring and analyzing the amount and degree of activity of specific substances related to blood coagulation and fibrinolytic function, and this analyzer uses blood plasma as a sample. The analyzer 1 optically measures samples using a coagulation time method, synthetic substrate method, and immunoturbidity method (main measurement). The blood coagulation time in the present embodiment is a measurement method in which the process of plasma coagulation is detected as a change in transmitted light. The items measured include TT (thrombin time), PT (prothrombin time), APTT (Active partial thromboplastin time), Fbg (fibrinogen content), LA (lupus anticoagulant) and the like. Measurement criteria of the synthetic substrate...


PUM


Abstract

A sample analyzer optically measures reaction of a sample mixed with reagent, and obtains optical information therefrom; generates a reaction curve representing change in the optical information over time; determines a first area prior to an evaluation target time (t0) and a second area after the evaluation target time (t0) wherein the first and second areas are formed between a baseline which is parallel to the time axis and a reaction curve from a first time (t1) prior to the optional evaluation target time (t0) to a second time (t2) after the evaluation target time, and determines the reaction end point based on the first and second areas; and obtains a characteristic of a sample based on the determined reaction end point, is disclosed a sample analyzing method is also disclosed.

Description

RELATED APPLICATIONS[0001]This application claims priority under 35 U.S.C. §119 to Japanese Patent Application No. JP2007-020942 filed on Jan. 31, 2007, the entire content of which is hereby incorporated by reference.FIELD OF THE INVENTION[0002]The present invention relates to a sample analyzer and a sample analyzing method which optically measure the reaction of a sample mixed with reagent to obtain the characteristics of the sample.BACKGROUND[0003]There are various methods for optically measuring a sample and obtaining the characteristics of the sample from the measurement results. One such method optically measures a sample and obtains the coagulation time based on the measurement results. This method uses, for example, blood plasma as a sample to which predetermined reagent is added, and the change in turbidity which occurs in conjunction with the coagulation of the plasma is measured as the change in the amount of transmission light and the amount of scattered light to obtain t...

Claims


Application Information

Patent Timeline
Patent Type & Authority Applications(United States)
IPC IPC(8): G06F17/40
CPCG01N15/12G01N15/1459G01N21/272G01N21/82G01N2015/1486G01N35/00594G01N2015/0073G01N2015/0076G01N2015/008G01N33/4905G01N2015/016G01N2015/012G01N2015/014
Inventor MATSUO, NAOHIKOFUJINO, HIROYUKIKOYA, MITSUYOHOSHIKO, SUSUMU
Owner SYSMEX CORP
Learn More