
System and method for comparative analysis of business intelligence data

Active Publication Date: 2007-12-27
TWITTER INC
View PDF20 Cites 15 Cited by
  • Summary
  • Abstract
  • Description
  • Claims
  • Application Information

AI Technical Summary

Benefits of technology

[0011]In one aspect, the disclosed embodiments provide an improved system and method for comparative analysis of BI data that obviates or mitigates at least one of the disadvantages of existing systems.
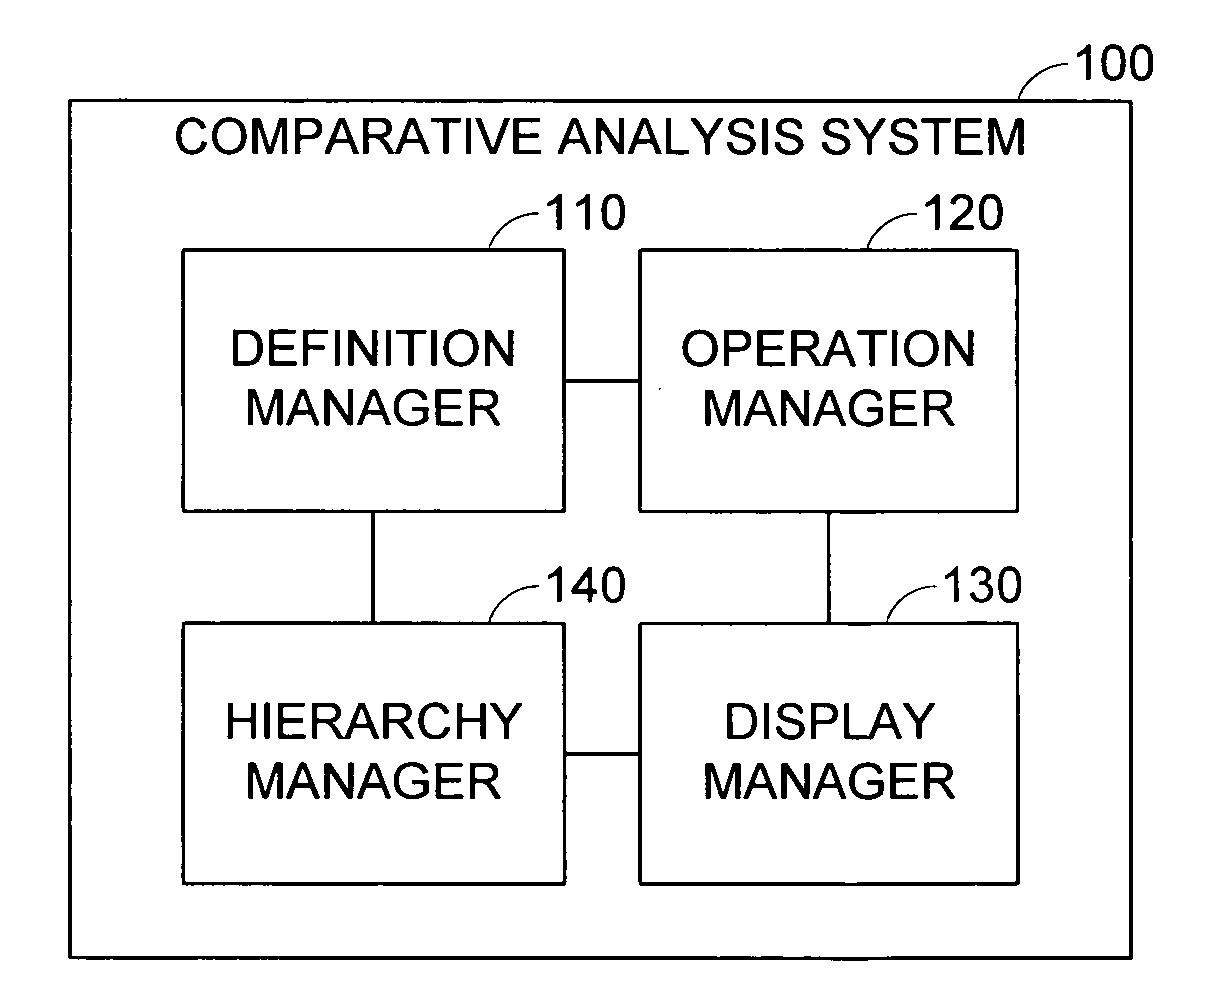
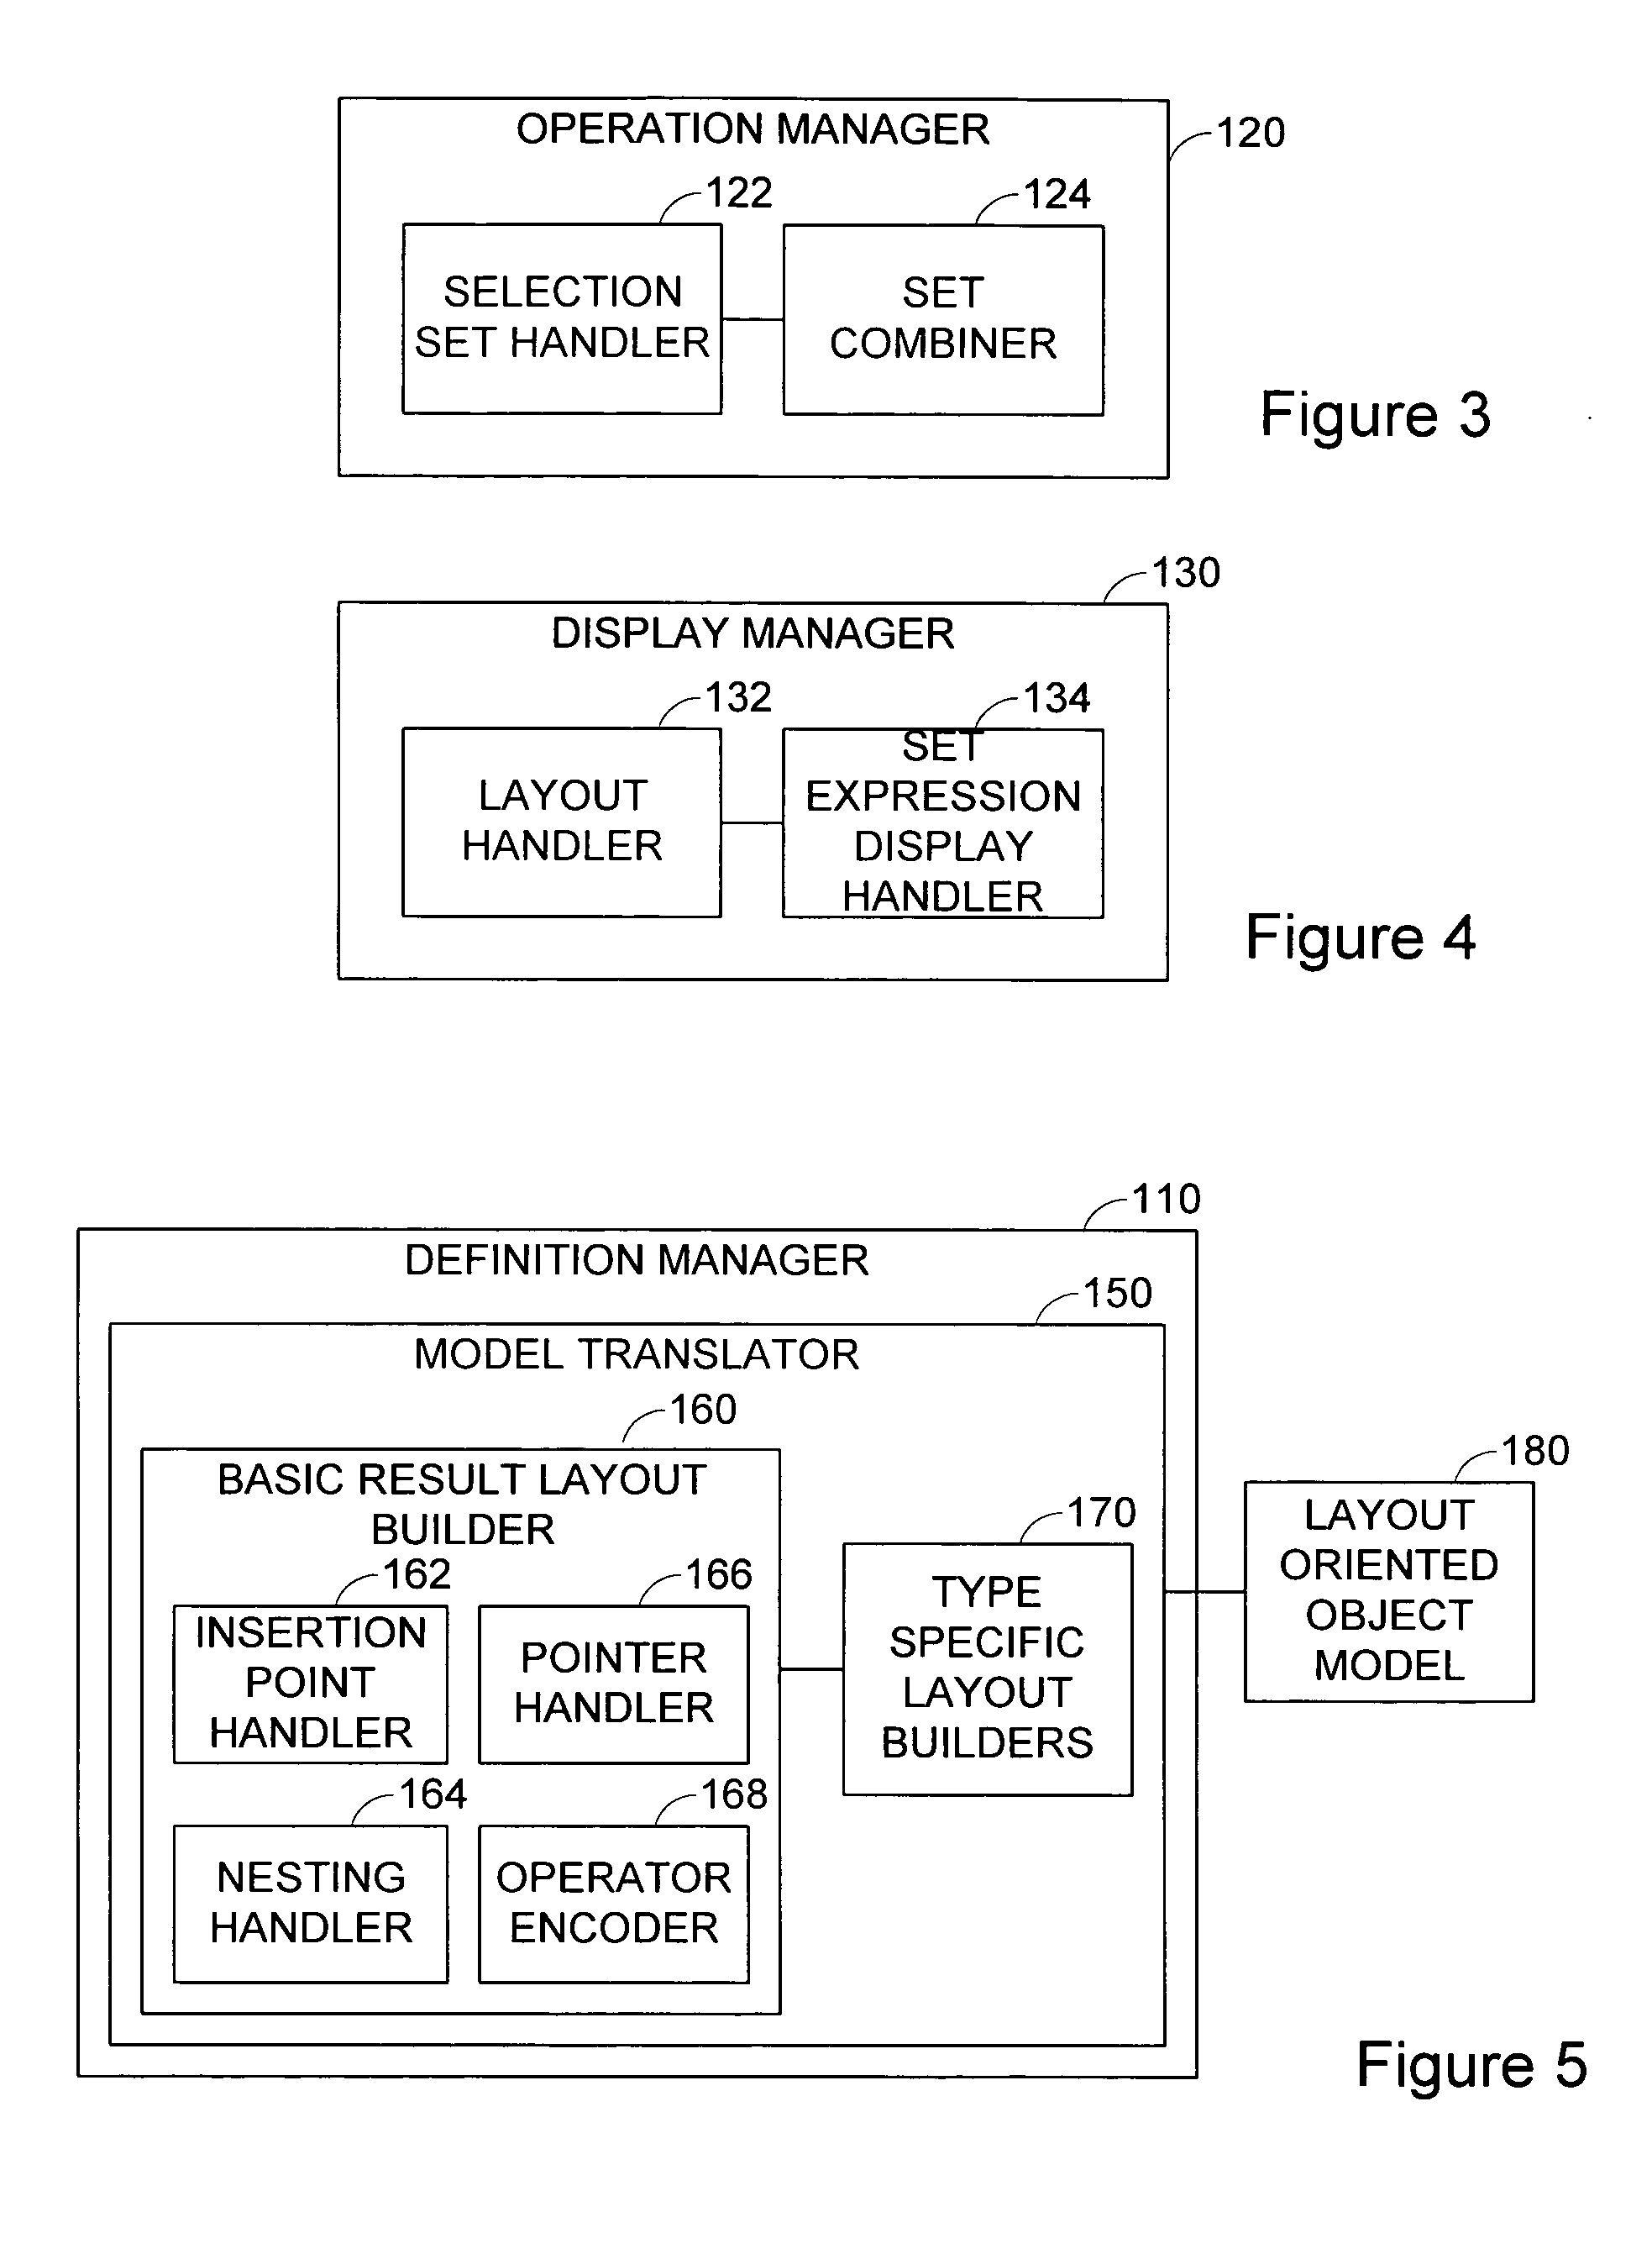
[0013]In accordance with an aspect of the present invention, there is provided a comparative analysis system for providing comparative analysis of business intelligence data represented by a multi-dimensional model. The comparative analysis system comprises a definition manager, an operation manager and a display manager. The definition manager is provided for independently managing definition of dimensional members of a data source. The operation manager is provided for allowing a user to define a set of dimensional members of interest and at least one operator to manipulate the defined set of members based on the selected operator. The display manager is provided for managing placement of the defined set of members in a report so that the defined set of members are displayed adjacently based on the operator to facilitate comparative analysis.
[0014]In accordance with another aspect of the invention, there is provided a method of providing comparative analysis of business intelligence data represented by a multi-dimensional model. The method comprises independently defining dimensional members of a data source; allowing a user to define a set of dimensional members of interest and at least one operator to manipulate the defined set of members based on the selected operator; and placing the defined set of members in a report so that the defined set of members are displayed adjacently based on the operator to facilitate comparative analysis.
[0015]In accordance with another aspect of the invention, there is provided a computer readable medium storing instructions or statements for use in the execution in a computer of a method of providing comparative analysis of business intelligence data represented by a multi-dimensional model. The method comprises independently defining dimensional members of a data source; allowing a user to define a set of dimensional members of interest and at least one operator to manipulate the defined set of members based on the selected operator; and placing the defined set of members in a report so that the defined set of members are displayed adjacently based on the operator to facilitate comparative analysis.
[0016]In accordance with another aspect of the invention, there is provided a propagated signal carrier containing computer executable instructions and / or statements that can be read and executed by a computer, the computer executable instructions being used to execute a method of providing comparative analysis of business intelligence data represented by a multi-dimensional model. The method comprises independently defining dimensional members of a data source; allowing a user to define a set of dimensional members of interest and at least one operator to manipulate the defined set of members based on the selected operator; and placing the defined set of members in a report so that the defined set of members are displayed adjacently based on the operator to facilitate comparative analysis.

Problems solved by technology

The problem is exacerbated by the physical display limits and two-dimensional nature of a computer monitor.
Such an outcome makes it more difficult to compare relevant members, due to the ‘distance’ between them, either within the dimensional model or physically on the display.
Given these characteristics of large OLAP, it is often difficult to compare members from multiple different dimensions in the context of one or more additional dimensions on the opposite edge of a cross-tab.
It is often difficult to compare members from different hierarchies of the same dimension in the context of one or more additional dimensions on the opposite edge of a cross-tab.
A disadvantage of this approach is that data may only appear for valid cell intersections.
The opposite cross-tab axis can involve redundant members, and can no longer be dedicated to supplying additional context from other dimensions.
Where members of a repeating or parent-child hierarchy may have the same display caption but different parent-members, or reside in different hierarchies, it is difficult to discriminate them without additional decoration, e.g., a parent and / or hierarchy prefix.
Such elaboration however takes up valuable display real estate, requiring word wrapping or cell resizing techniques and associated user interface fixtures to help manage the display.
In these situations, it is difficult to compare members in the context of an additional dimension, or in the context of more than one measure value at a time.
As the number of members or nesting levels increases, this approach suffers from the physical display limits and display management manipulations previously mentioned above.
For a large number of members, this technique can be tedious and time-consuming.
Both techniques require numerous non-analytical user interface gestures that detract from the comparison activity.
Display management manipulations or the need to print / arrange report outputs distract users from the primary task of comparative member analysis.

Method used


Image

  • System and method for comparative analysis of business intelligence data
  • System and method for comparative analysis of business intelligence data
  • System and method for comparative analysis of business intelligence data

Examples


Embodiment Construction

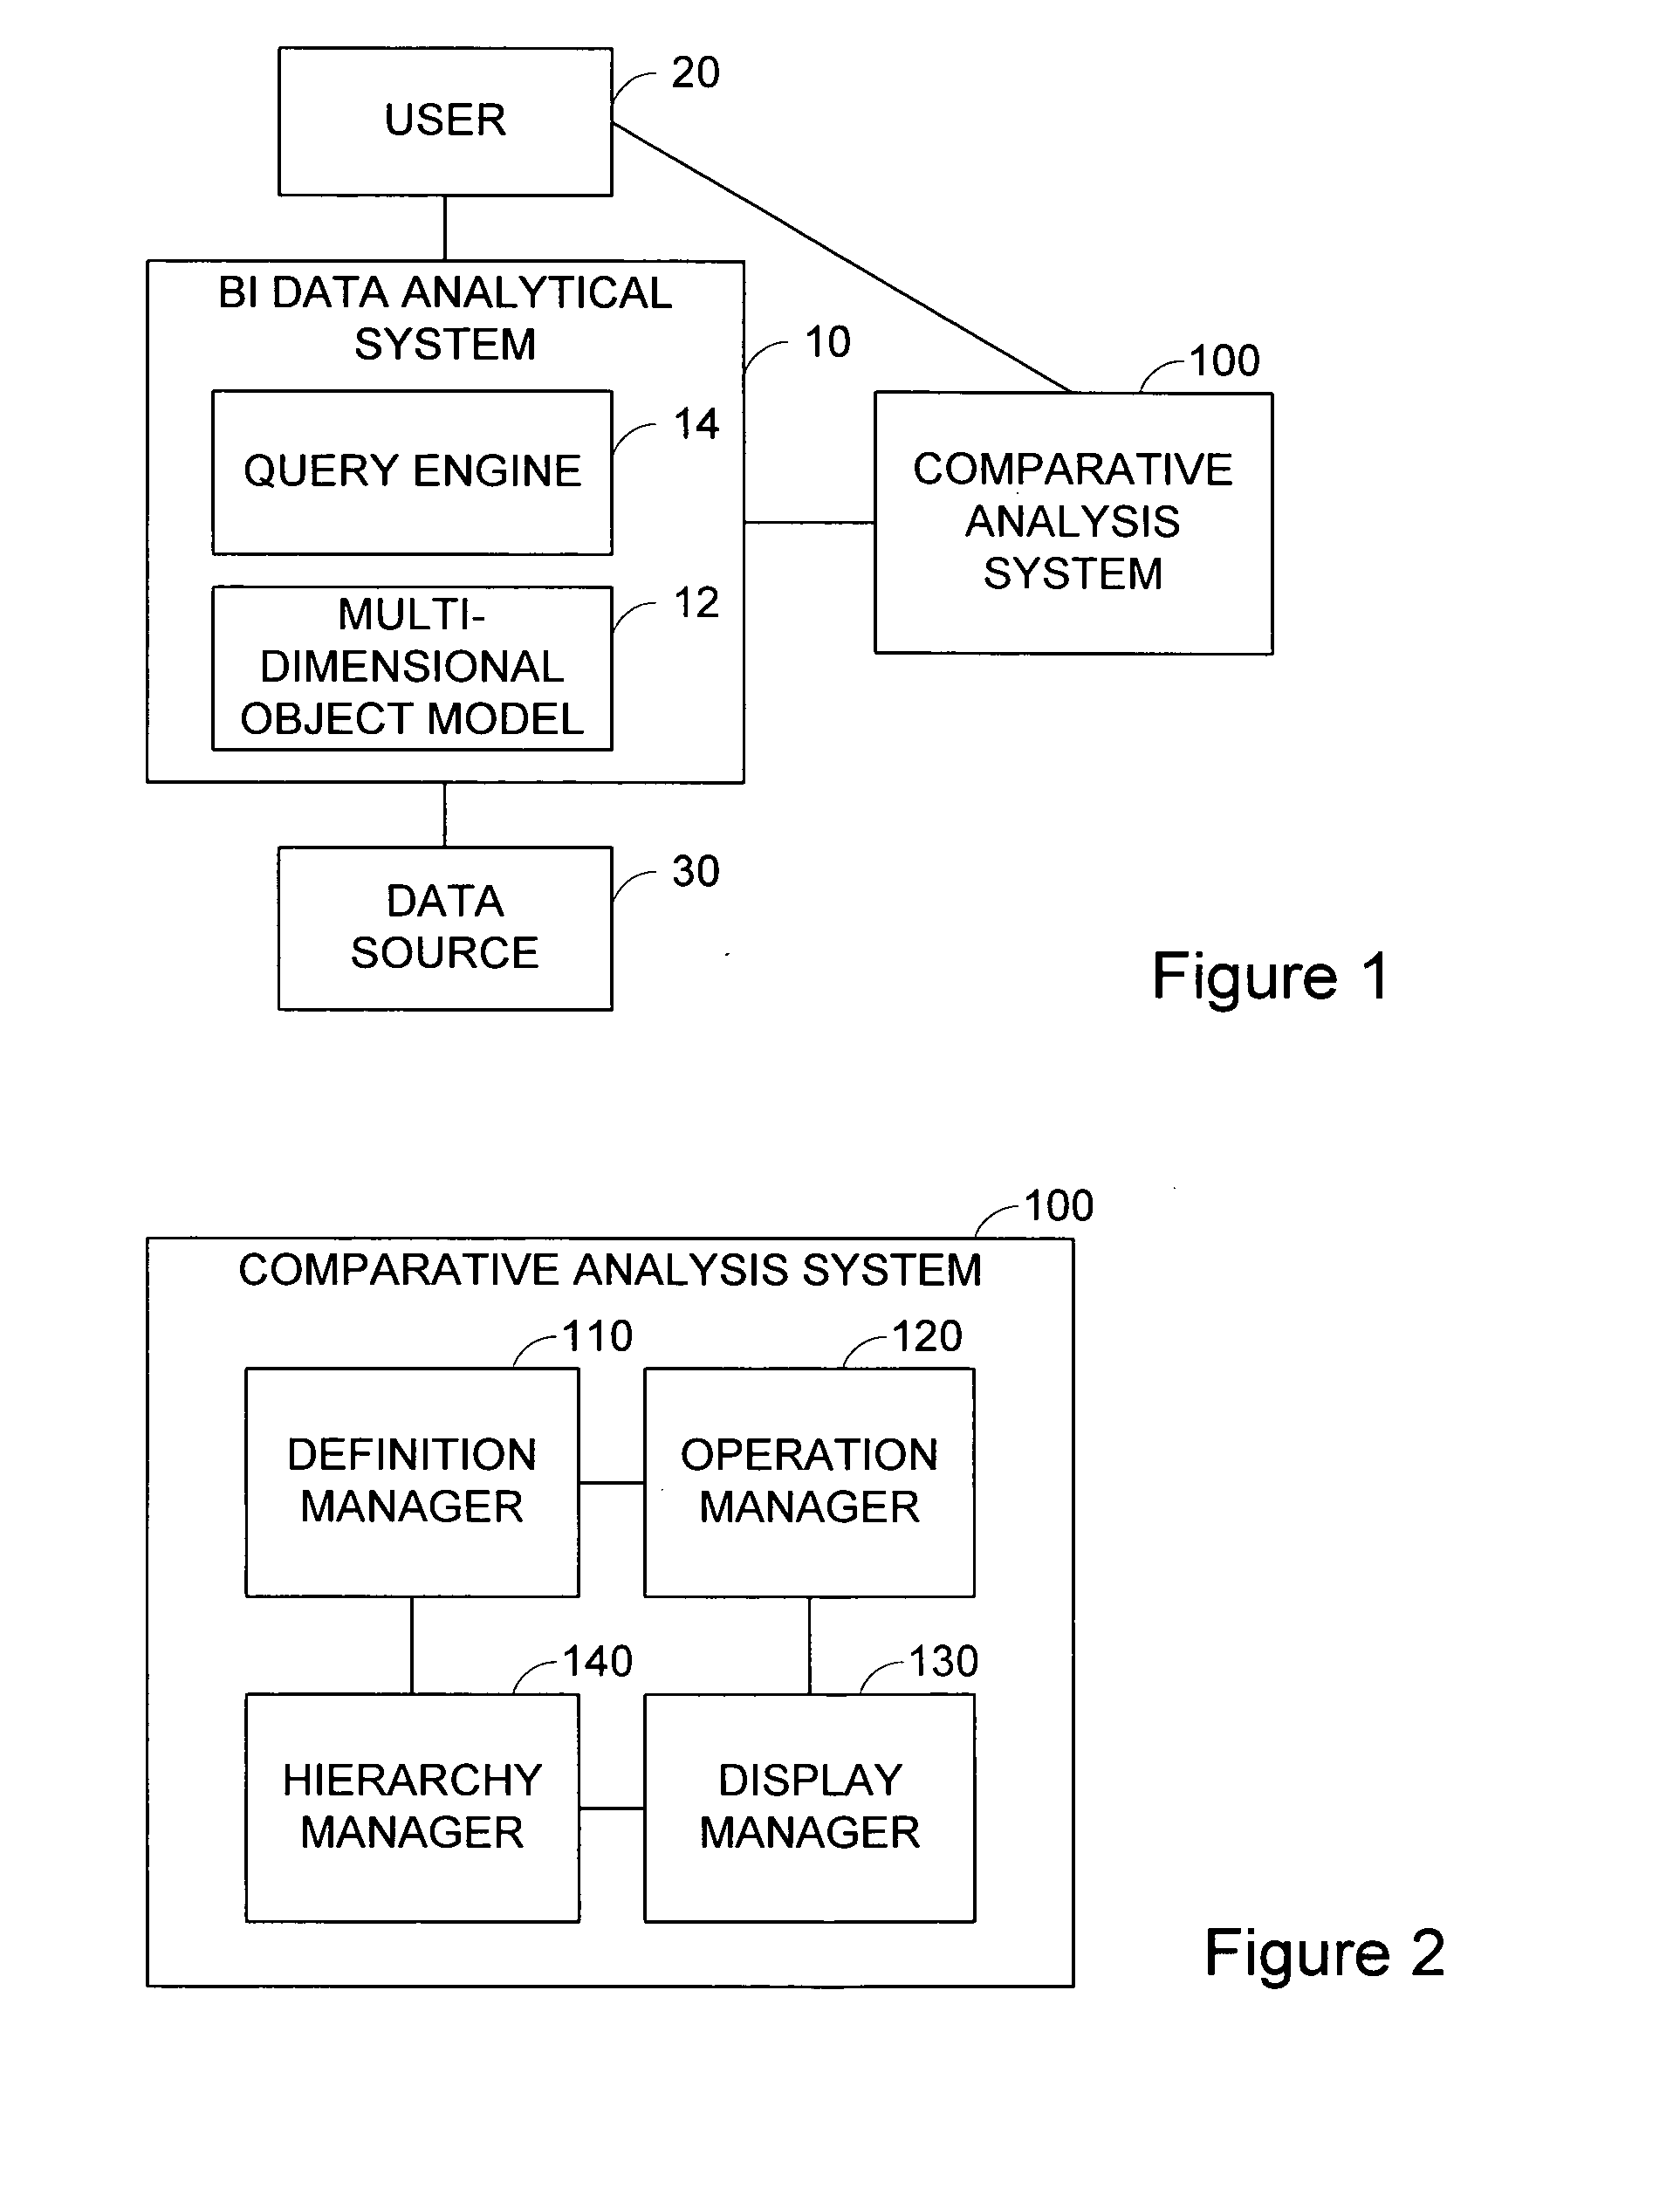
[0046]Referring to FIG. 1, a comparative analysis system 100 in accordance with an embodiment of the invention is described.

[0047]The comparative analysis system 100 provides comparative analysis functions to a business intelligence (BI) analytical system 10. The BI analytical system 10 has a multi-dimensional model 12 that represents one or more data sources 30 storing BI data for an organization. Data stores 30 may be a multi-dimensionally modeled business databases and / or data warehouses. Users 20 query the BI analytical system 10 for analysing operational performance of the organization. In response to the queries, a query engine 14 of the BI analytical system 10 retrieves relevant BI data from the data sources 30 using the multi-dimensional model 12, and generates reports to present the relevant BI data to the users 20. The reports are typically presented in a form of cross-tabs or graphical representations of the data.

[0048]The BI analytical system 10 may be suitably implement...


PUM


Abstract

A comparative analysis system allows independent management of definition of dimensional members of a multi-dimensional model. A user can select dimensional members of interest and at least one operator to manipulate the selected members based on the selected operator. The system manages placement of the selected members in a report so that the selected members are displayed adjacently based on the operator to facilitate comparative analysis.

Description

FIELD OF THE INVENTION[0001]The aspects of the invention relate to a system and method for comparative analysis of business intelligence data, and specifically to a system and method that provides a view of business intelligence data that facilitates comparative analysis of the data by users.BACKGROUND OF THE INVENTION[0002]In the Business Intelligence (BI) computer applications domain, business decision makers use analytical software to pose operational performance questions as queries against multi-dimensionally modeled business databases and data warehouses. These multi-dimensional models and analysis software tools are based on Online Analytic Processing (OLAP) concepts and technology. The analysis activity typically involves the creation and manipulation of a cross-tabular (also called “cross-tab”) and / or graphical presentation of the data.[0003]Large OLAP databases and multi-dimensionally modeled data warehouses typically contain large numbers of dimensional members or flat / no...

Claims


Application Information

Patent Timeline
IPC IPC(8): G06F17/00
CPCG06Q40/06G06Q30/00
Inventor WESTMAN, RANDYWINTER, STEWARTLEIKUCS, ANDREWMACCULLOCH, TODDREID, MURRAY
Owner TWITTER INC
Learn More