
Method of determining margins to operating limits for nuclear reactor operation

a technology of operating limits and nuclear reactors, applied in nuclear elements, nuclear engineering problems, greenhouse gas reduction, etc., can solve the problems of large-scale margin requirements, adverse economic effects of “larger than needed” margin requirements on the plant, and exposure-dependent biases

Active Publication Date: 2007-07-05
GLOBAL NUCLEAR FUEL -- AMERICAS
View PDF3 Cites 12 Cited by
  • Summary
  • Abstract
  • Description
  • Claims
  • Application Information

AI Technical Summary

Problems solved by technology

These differences are caused by a variety of factors, including inadequacies in simulator models, imperfect modeling of the actual plant operation, uncertainties in operating parameters, uncertainties in tip measurements, etc., as well as other unknown uncertainties.
However, the cost of such changes typically is a loss of power or fuel cycle efficiency.
Moreover, a “larger than needed” margin requirement has an adverse economic impact on the plant.
The determination of sufficient operating limit margins and predicted trends for expected operating limits and uncertainty exposure dependent biases is a complex problem for design and operation of a nuclear reactor.
However, these standard design margins are crude at best.
Sometimes, the historical required design margin is inadequate, resulting in manipulation of control rods during operation in order to regain lost margin.
If rod pattern changes do not alleviate or correct the problem, plants have been even known to have to de-rate (lower power production).
Either solution is extremely costly to the fuel cycle efficiency and can cost millions of dollars in lost revenue.
Additionally, the historical design margin is occasionally inappropriately conservative, thereby resulting in a reduction in possible fuel cycle efficiency.

Method used


Image

  • Method of determining margins to operating limits for nuclear reactor operation
  • Method of determining margins to operating limits for nuclear reactor operation
  • Method of determining margins to operating limits for nuclear reactor operation

Examples


example

[0047]FIG. 6 is a graph of predicted eigenvalue versus normalized time to illustrate differences in the predicted margin as a result of simulation and the margin as determined by the example methodology herein. FIG. 6 illustrates an actual calculation of hot eigenvalue for power operation and cycle length considerations. The initial conditions where to evaluate future eigenvalue predictions at all exposure points greater than 20% into the cycle (T=0.2) with a customer provided risk-tolerance level of 75%. Therefore, the customer would want to be 75% certain of having the required reactivity (i.e., power and desired cycle length). The multiplier factor K based on this probability, taken from any statistics book, was 0.68. The known actual eigenvalue (normalized) at T=0.2 is 1.0050.

[0048] In FIG. 6, curves were generated for the nominal predicted eigenvalue and for the 75% probability of non-event eigenvalue. Because there are only seven groupings of data or data sets in this example...


PUM


Abstract

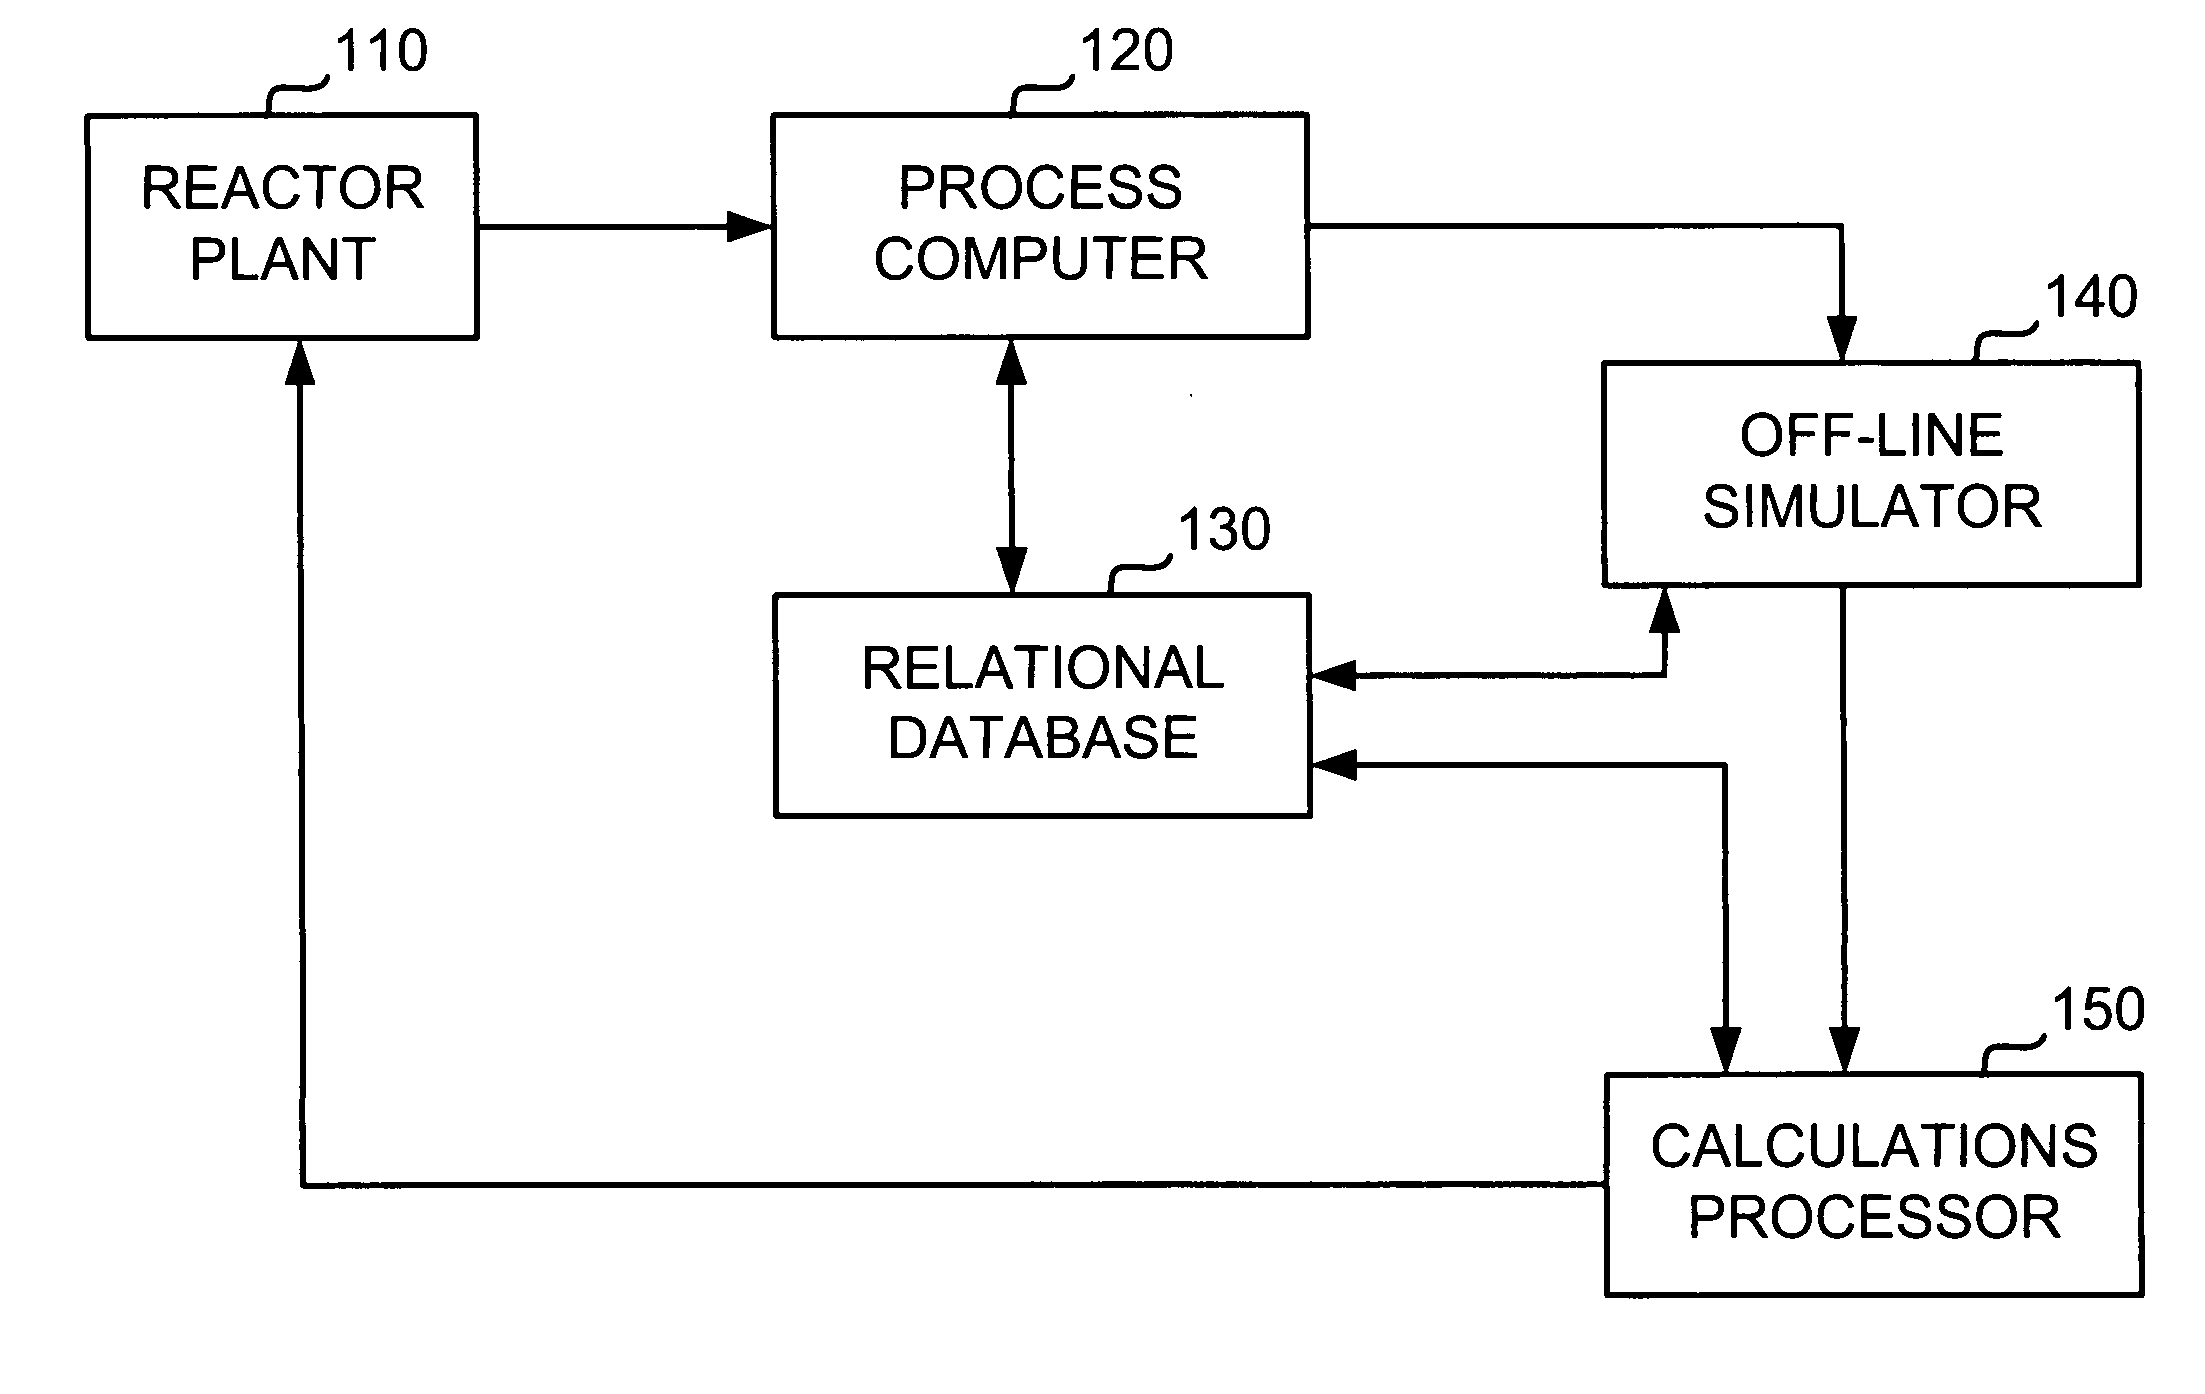
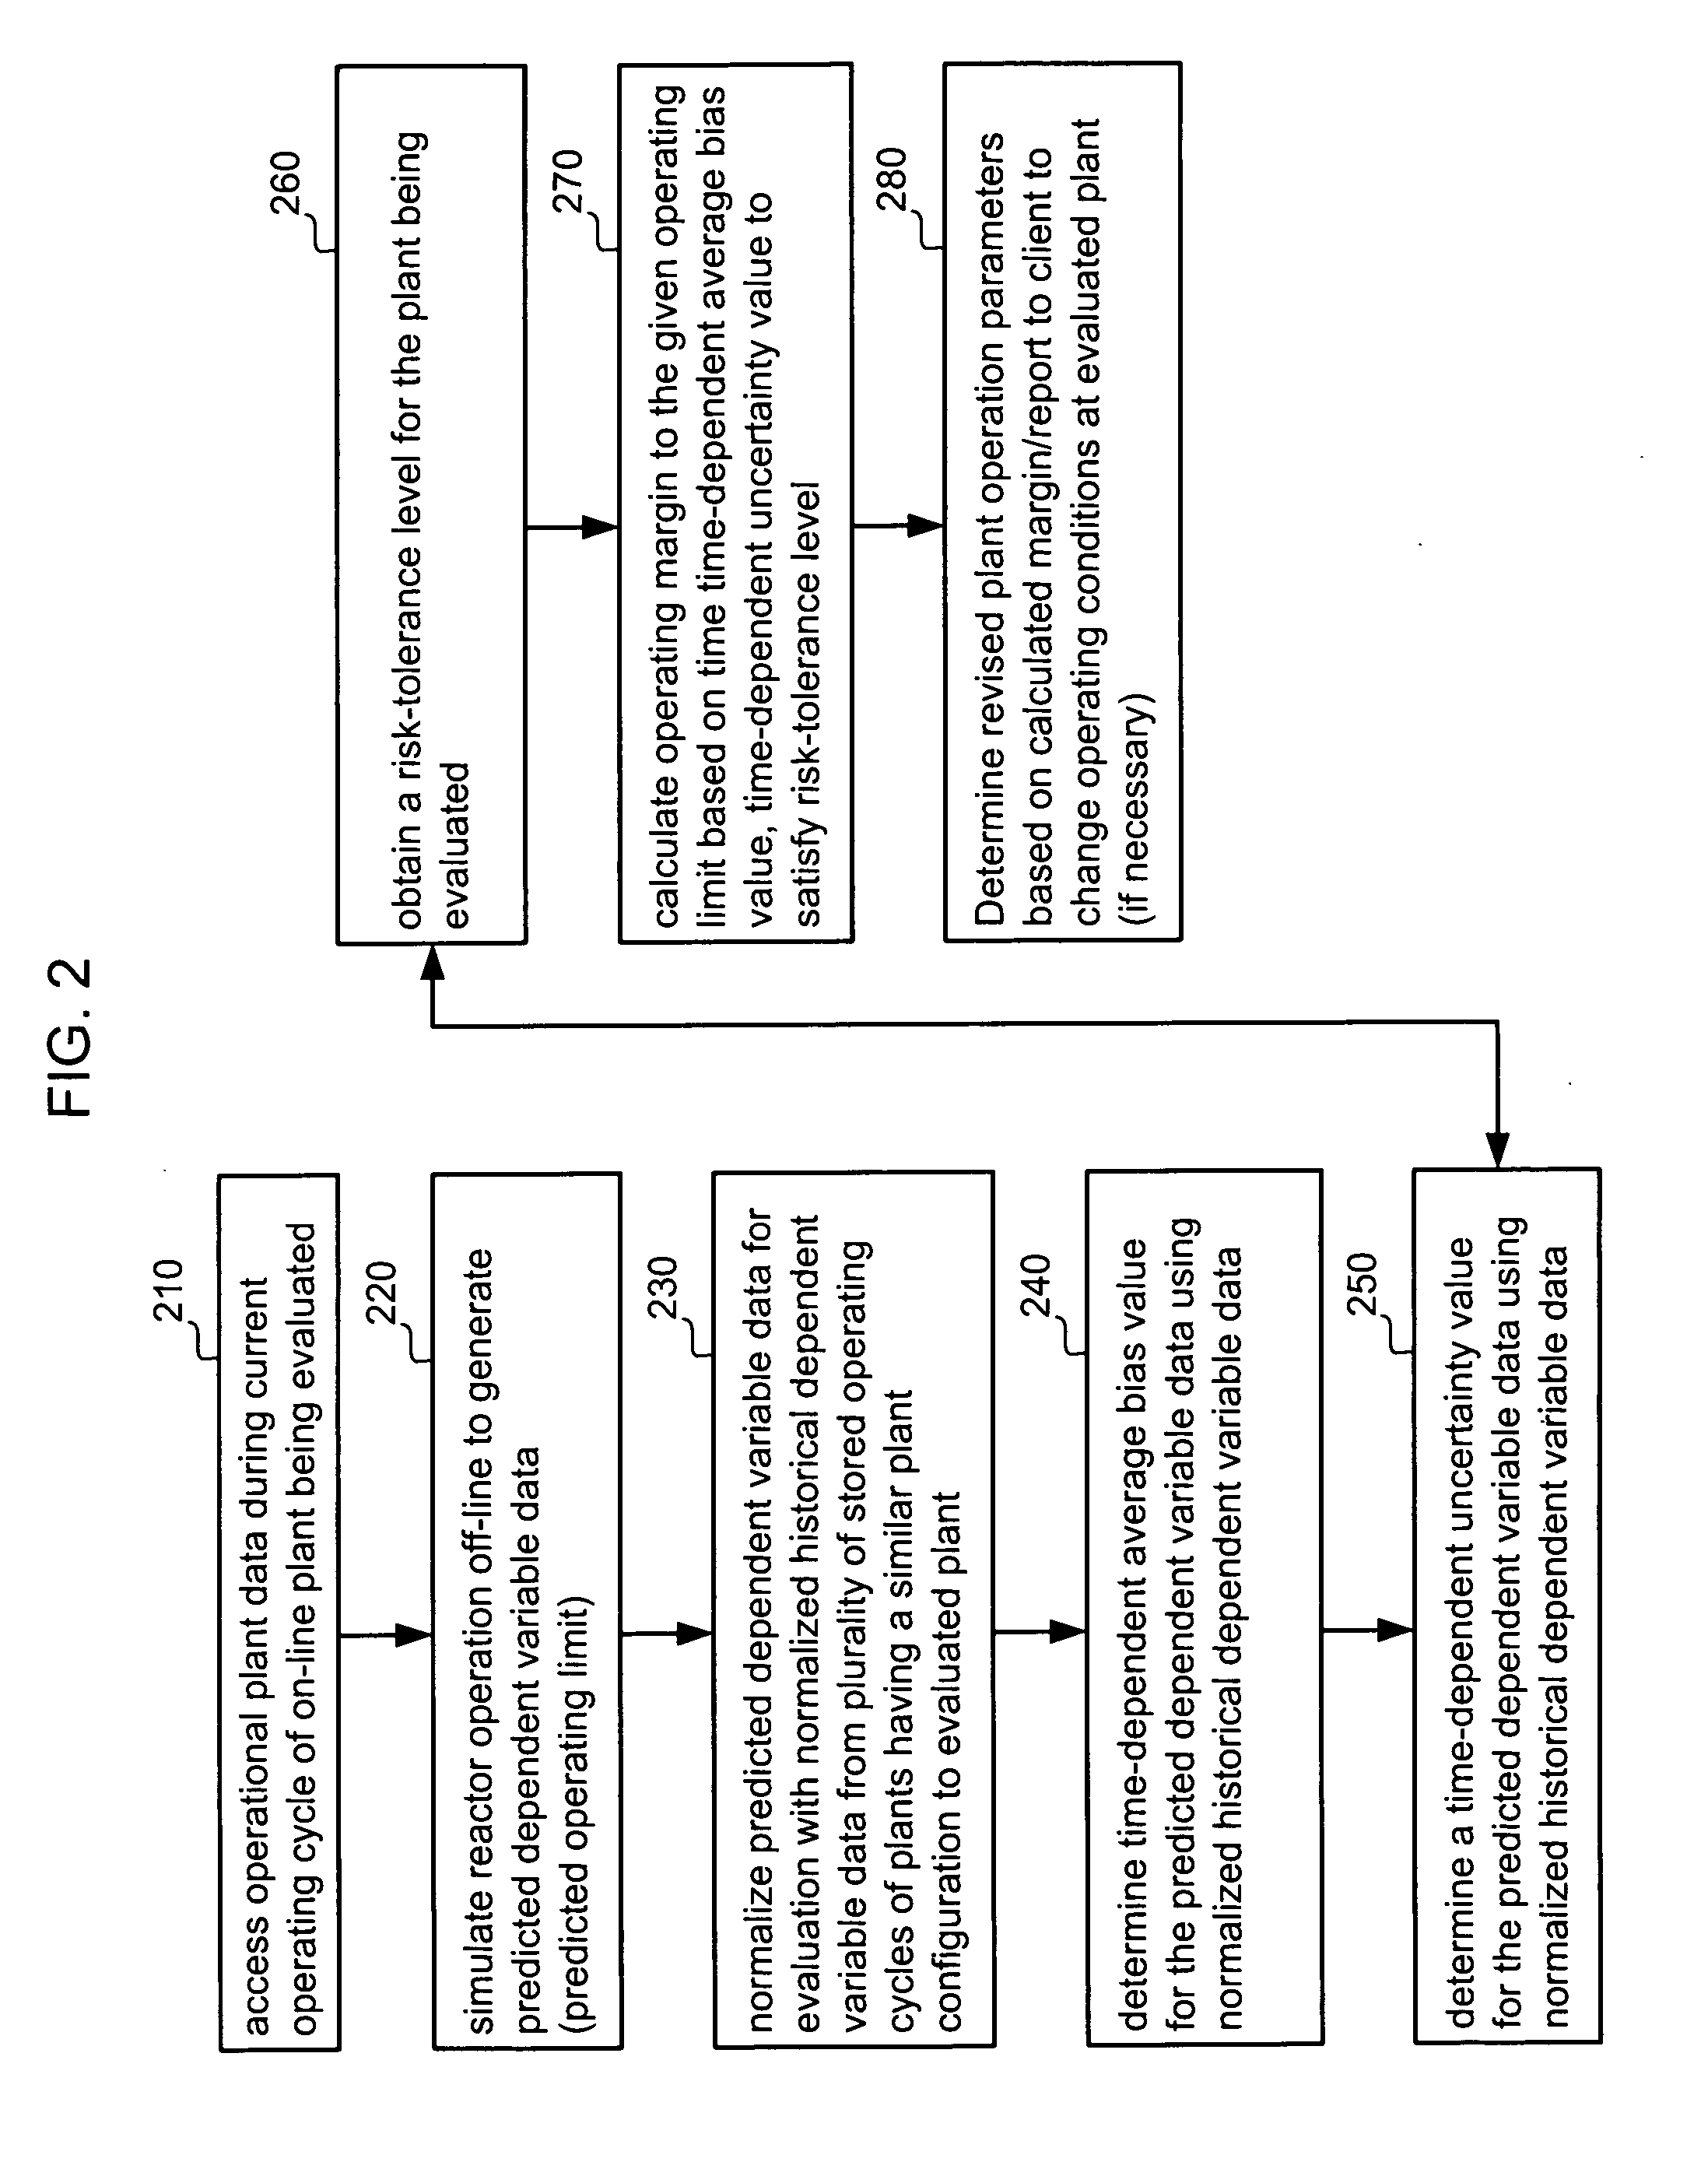
In a method of determining an operating margin to a given operating limit in a nuclear reactor, operational plant data from an on-line nuclear reactor plant is accessed, and reactor operation is simulated off-line using the operational plant data to generate predicted dependent variable data representative of the given operating limit. The predicted dependent variable data is normalized for evaluation with normalized historical dependent variable data from stored operating cycles of plants having a similar plant configuration to the on-line plant. A time-dependent average bias and a time-dependent uncertainty value for the predicted dependent variable data are determined using the normalized historical dependent variable data, and a risk-tolerance level for the on-line plant is obtained. An operating margin to the given operating limit is determined based on the determined time time-dependent average bias value and time-dependent uncertainty value so as to satisfy the risk-tolerance level of the evaluated plant.

Description

BACKGROUND OF THE INVENTION [0001] 1. Field of the Invention [0002] The present invention relates generally to design and operation of nuclear reactors, and more particularly to a method of determining a margin to an operating limit of a nuclear reactor. [0003] 2. Description of the Related Art [0004] During the operation of a boiling water reactor (BWR) or pressurized water reactor (PWR), a continuous monitoring of all operating parameters and resulting thermal limits is performed. For example, percent rated power, percent rated flow, inlet moderator temperature, core pressure, and any positioning of control blades are monitored in order to identify the instantaneous status of the reactor. Also, instrumentation within the reactor core helps monitor reactivity, which maps to corresponding operating responses in parameters such as critical power ratio (CPR), Maximum Average Planar Linear Heat Generation Rate (MAPLHGR), and Maximum Fraction of Linear Power Density (MFLPD), each of whi...

Claims


Application Information

Patent Timeline
IPC IPC(8): G21C17/00
CPCG21C17/00G21D3/001Y02E30/40G21Y2002/304G21Y2004/40G21Y2002/201Y02E30/00Y02E30/30G21C7/00G21D3/04G21D3/08
Inventor RUSSELL, WILLIAM EARL IIFAWCETT, RUSSELL MORGANCLINE, WILLIAM CHARLESKROPACZEK, DAVID JOSEPHWATFORD, GLEN A.TROSMAN, LUKASSUTTON, STEVEN BARRYOYARZUN, CHRISTIAN CARLOS
Owner GLOBAL NUCLEAR FUEL -- AMERICAS
Learn More