System for selecting and purchasing assets and maintaining an investment portfolio
- Summary
- Abstract
- Description
- Claims
- Application Information
AI Technical Summary
Benefits of technology
Problems solved by technology
Method used
Image

Examples
Embodiment Construction
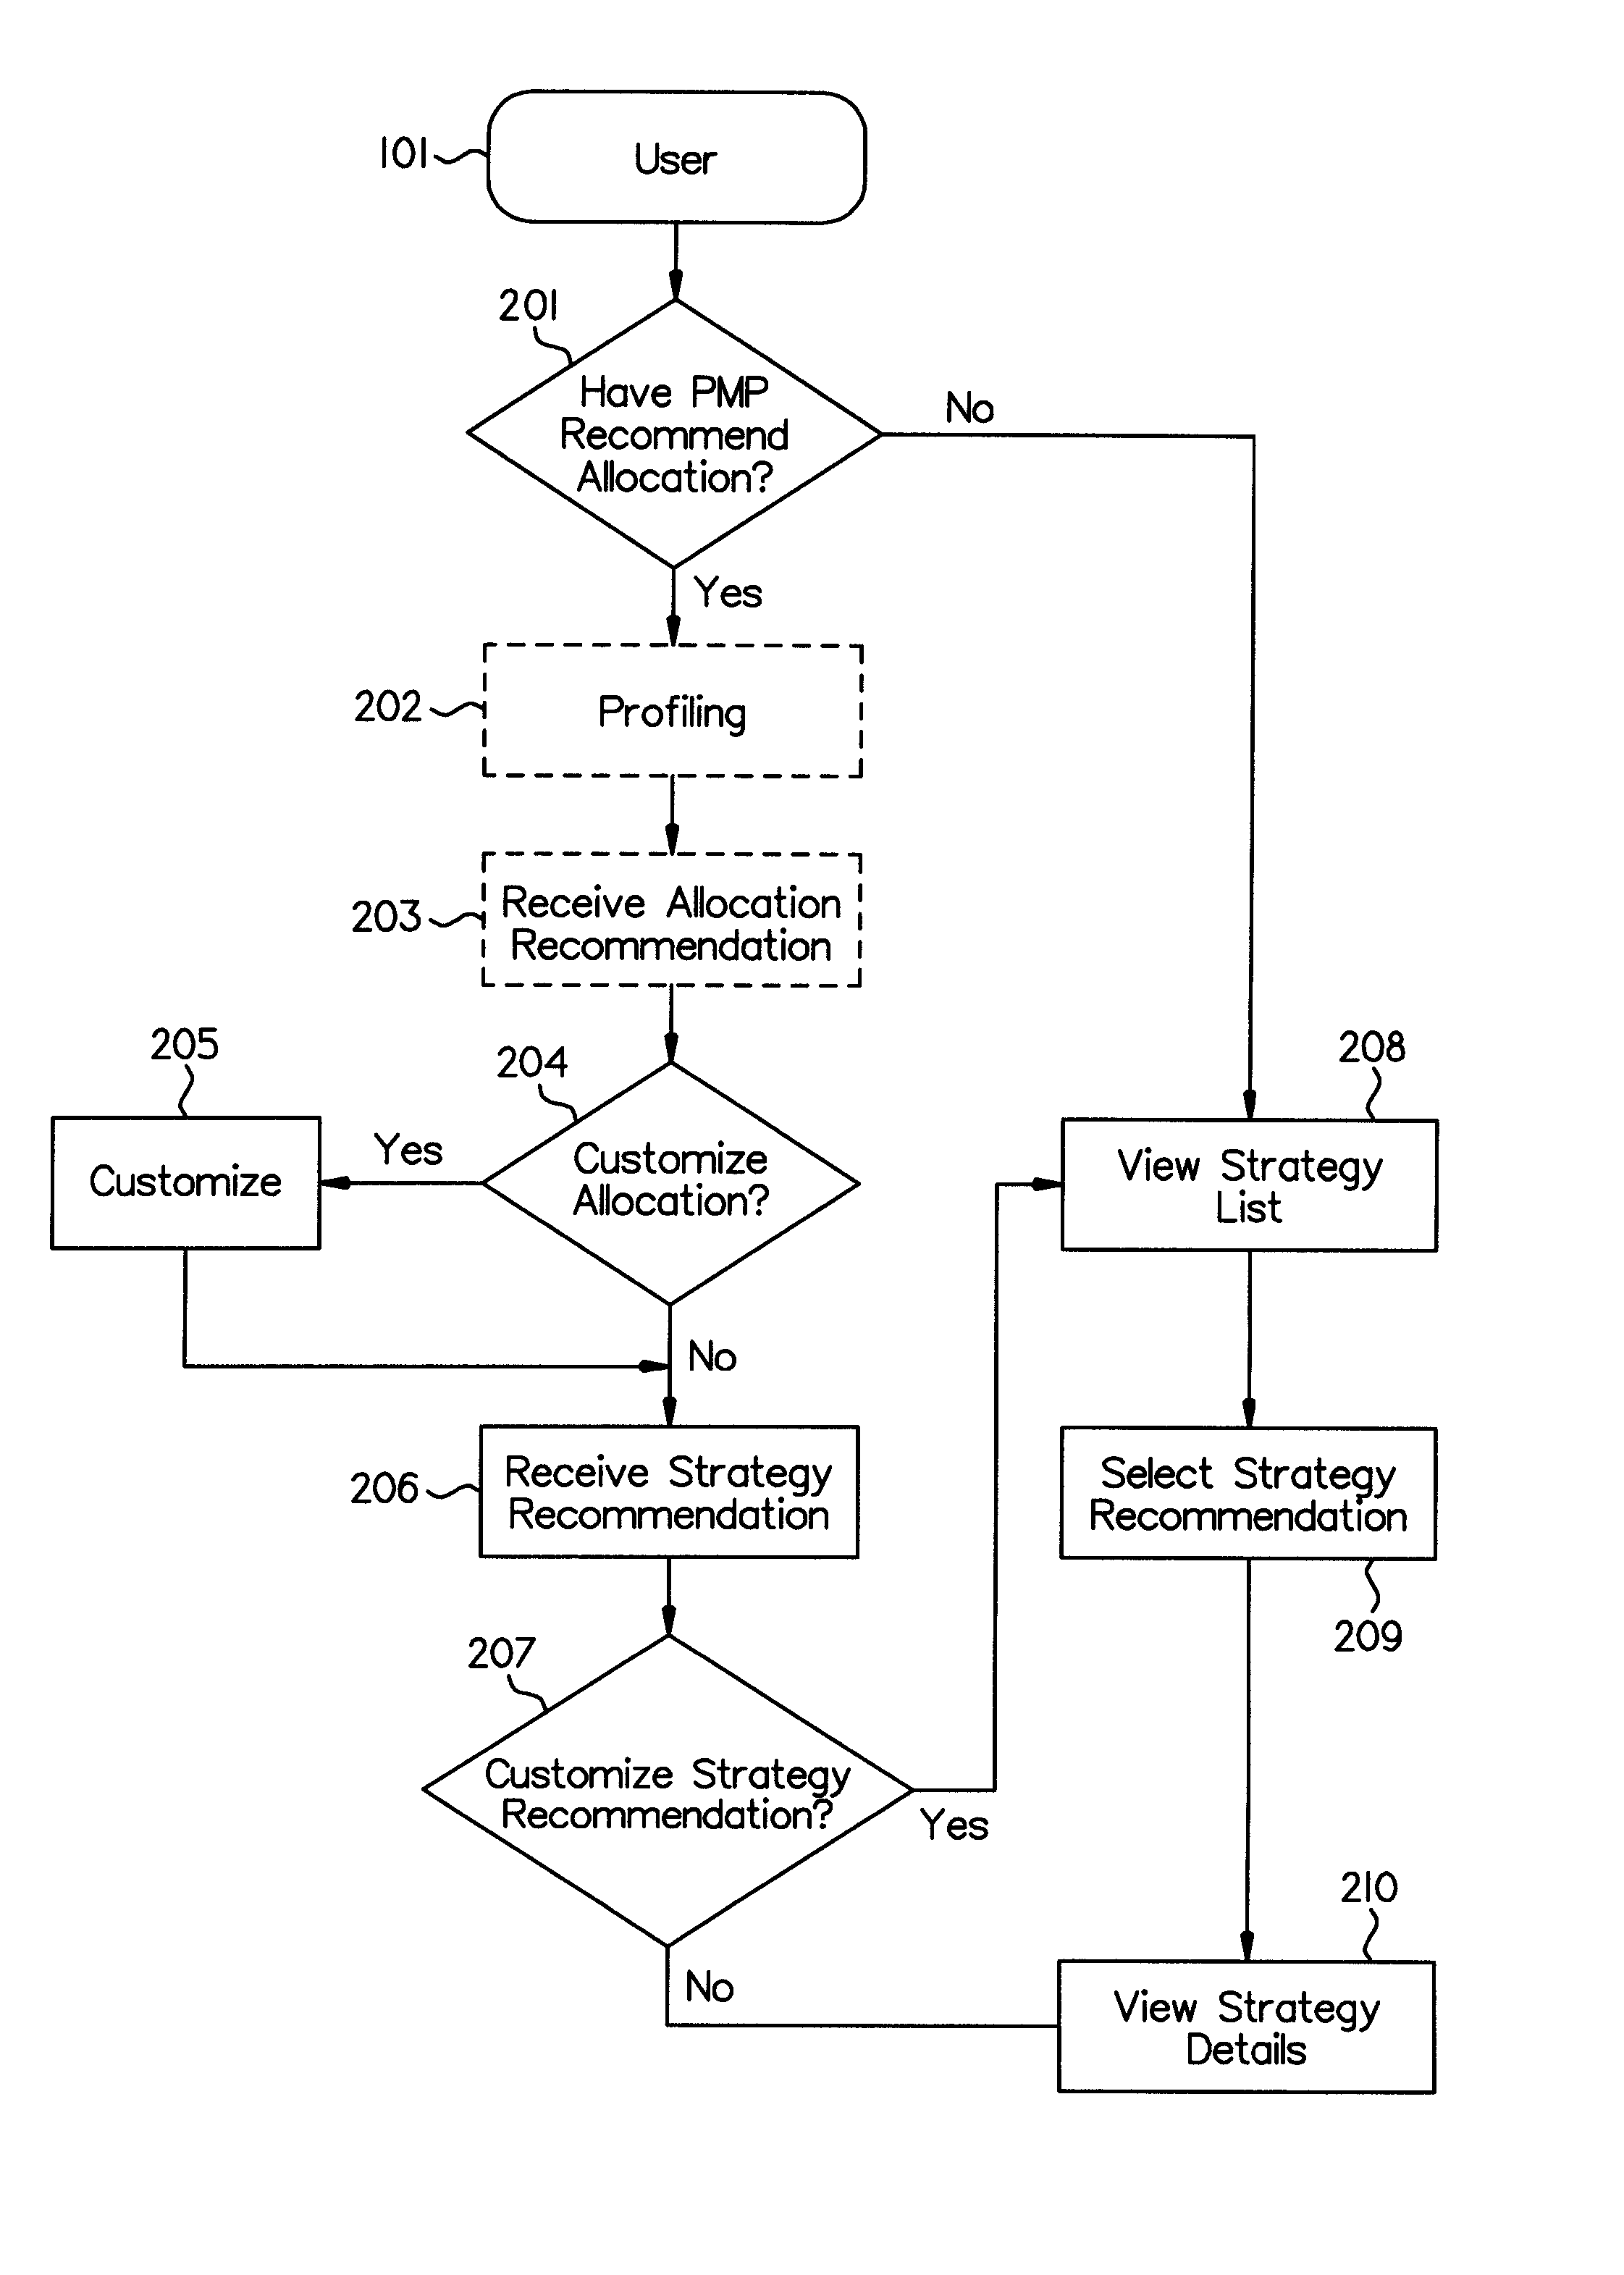
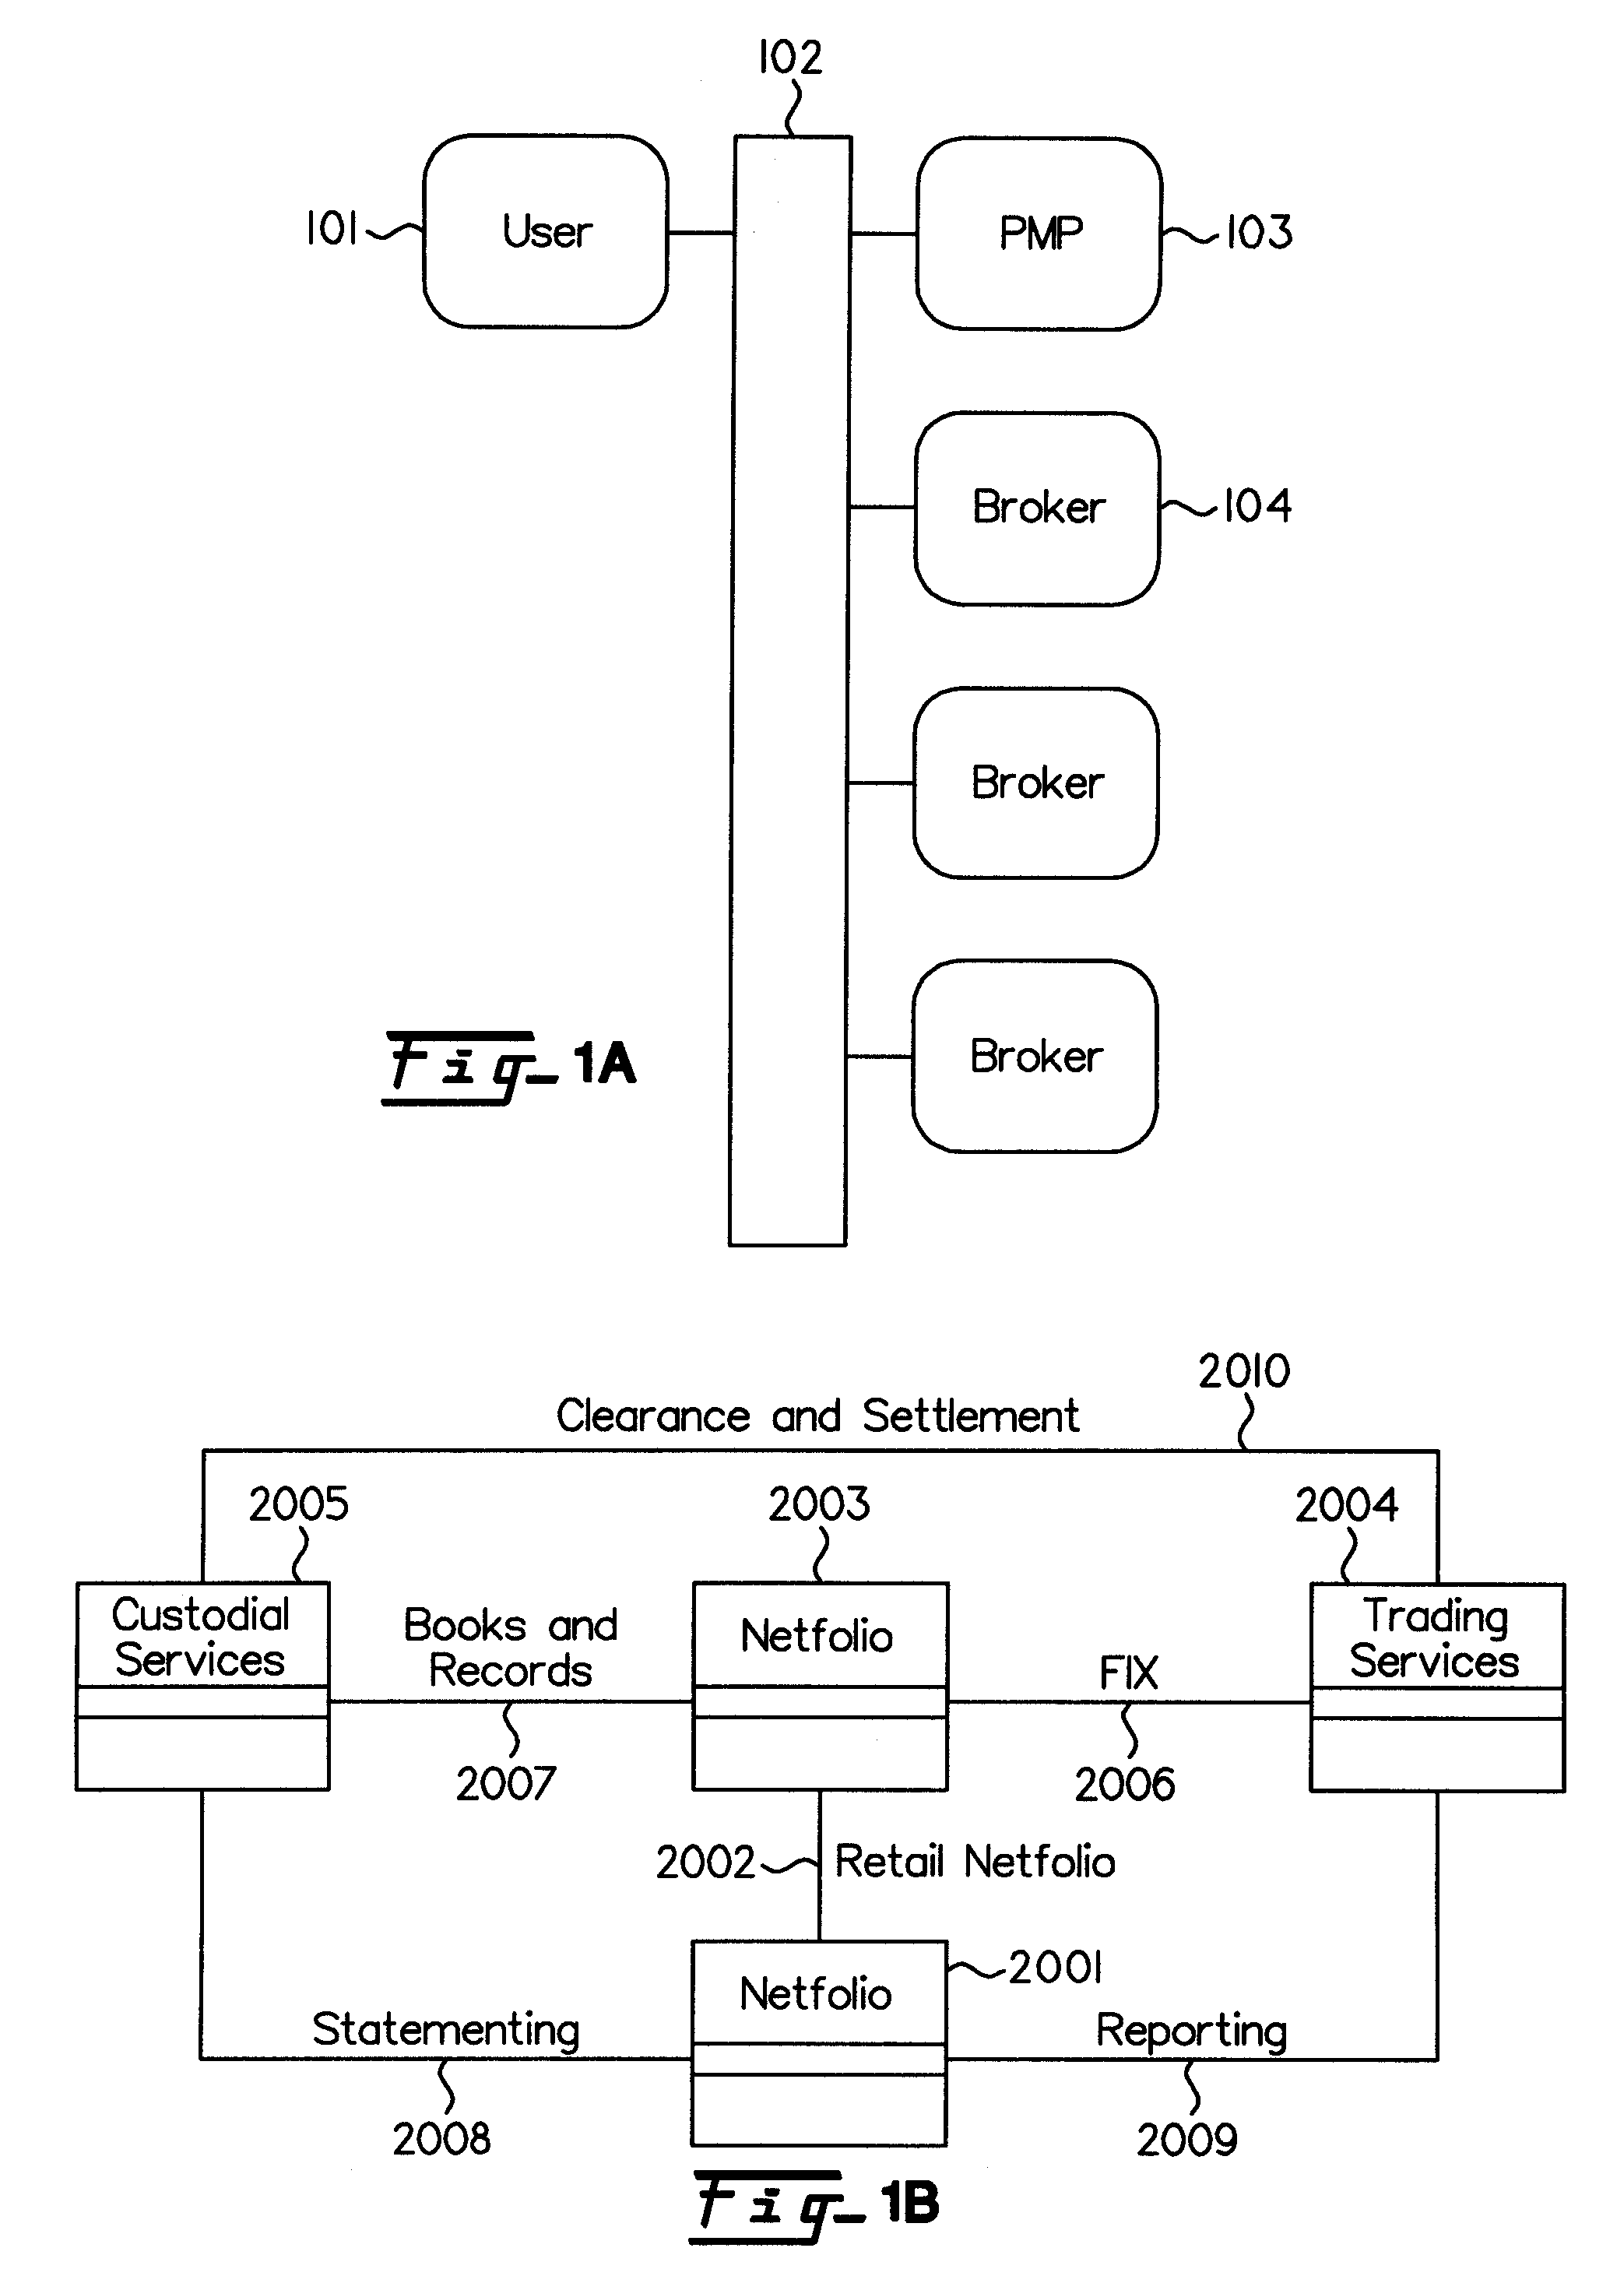
[0055] An illustrative example of the present invention will be described with reference to the accompanying drawings. Referring now to FIG. 1A, a user 101 is connected to the Internet 102 or other communication channel via a personal computer, terminal, personal digital assistant, or the like. The user 101 connects thereby to the computer running PMP 103. As shown in further detail in FIG. 6A, the user 101 reviews certain strategies and their historic performance. The information is transmitted across the Internet 102 to the user 101. The information transmitted includes such information as historic performance, sample holdings, modeling how the particular strategy and its holding has performed in the past.
[0056] The user 101, after making appropriate reviews, makes a decision to purchase the stocks named in that portfolio. The operator of the PMP host computer 103 collects a payment for this service. This price is preferably $29.95.
[0057] Now the user 101 sees a list of stocks p...
PUM
 Abstract
Description
Claims
Application Information
 - R&D
- Intellectual Property
- Life Sciences
- Materials
- Tech Scout
- Unparalleled Data Quality
- Higher Quality Content
- 60% Fewer Hallucinations
Browse by: Latest US Patents, China's latest patents, Technical Efficacy Thesaurus, Application Domain, Technology Topic, Popular Technical Reports.
© 2025 PatSnap. All rights reserved.Legal|Privacy policy|Modern Slavery Act Transparency Statement|Sitemap|About US| Contact US: help@patsnap.com