Method, a system and a computer program for signal display

Active Publication Date: 2006-08-31
SAP AG
View PDF9 Cites 1 Cited by
  • Summary
  • Abstract
  • Description
  • Claims
  • Application Information

AI Technical Summary

Benefits of technology

[0011] The present invention is thus applicable to a wide range of fields, with the particular emphasis on technical fields, including a variety of industrial control processes, engine monitoring, diagnosis systems, engine control or logistics, as well as business and financial data environments. It provides a quick, intuitive way for a user to monitor, assign and evaluate comprehensive and complex information in a single display view.

Problems solved by technology

A common problem faced by the user is information overload.
However, when illustrating these data characteristics, many of graphical display methods of the prior art introduce data clutter into the graphical data displays.
An important issue associated with computer based graphical systems exists regarding the necessity of carefully managing the display screen space.
Additionally, the underlying data tends to be comprehensive and complex.
In many systems, simple additions or changes to data require extensive and time-consuming navigation and editing of data across a multitude of display screens; a visual inspection of the data requires as well, the same navigation of multiple display screens.
Many types of software applications can display data in charts with multiple bars, however, they do not provide an intuitive overview of data from a single view.

Method used


Image

  • Method, a system and a computer program for signal display
  • Method, a system and a computer program for signal display
  • Method, a system and a computer program for signal display

Examples


Embodiment Construction

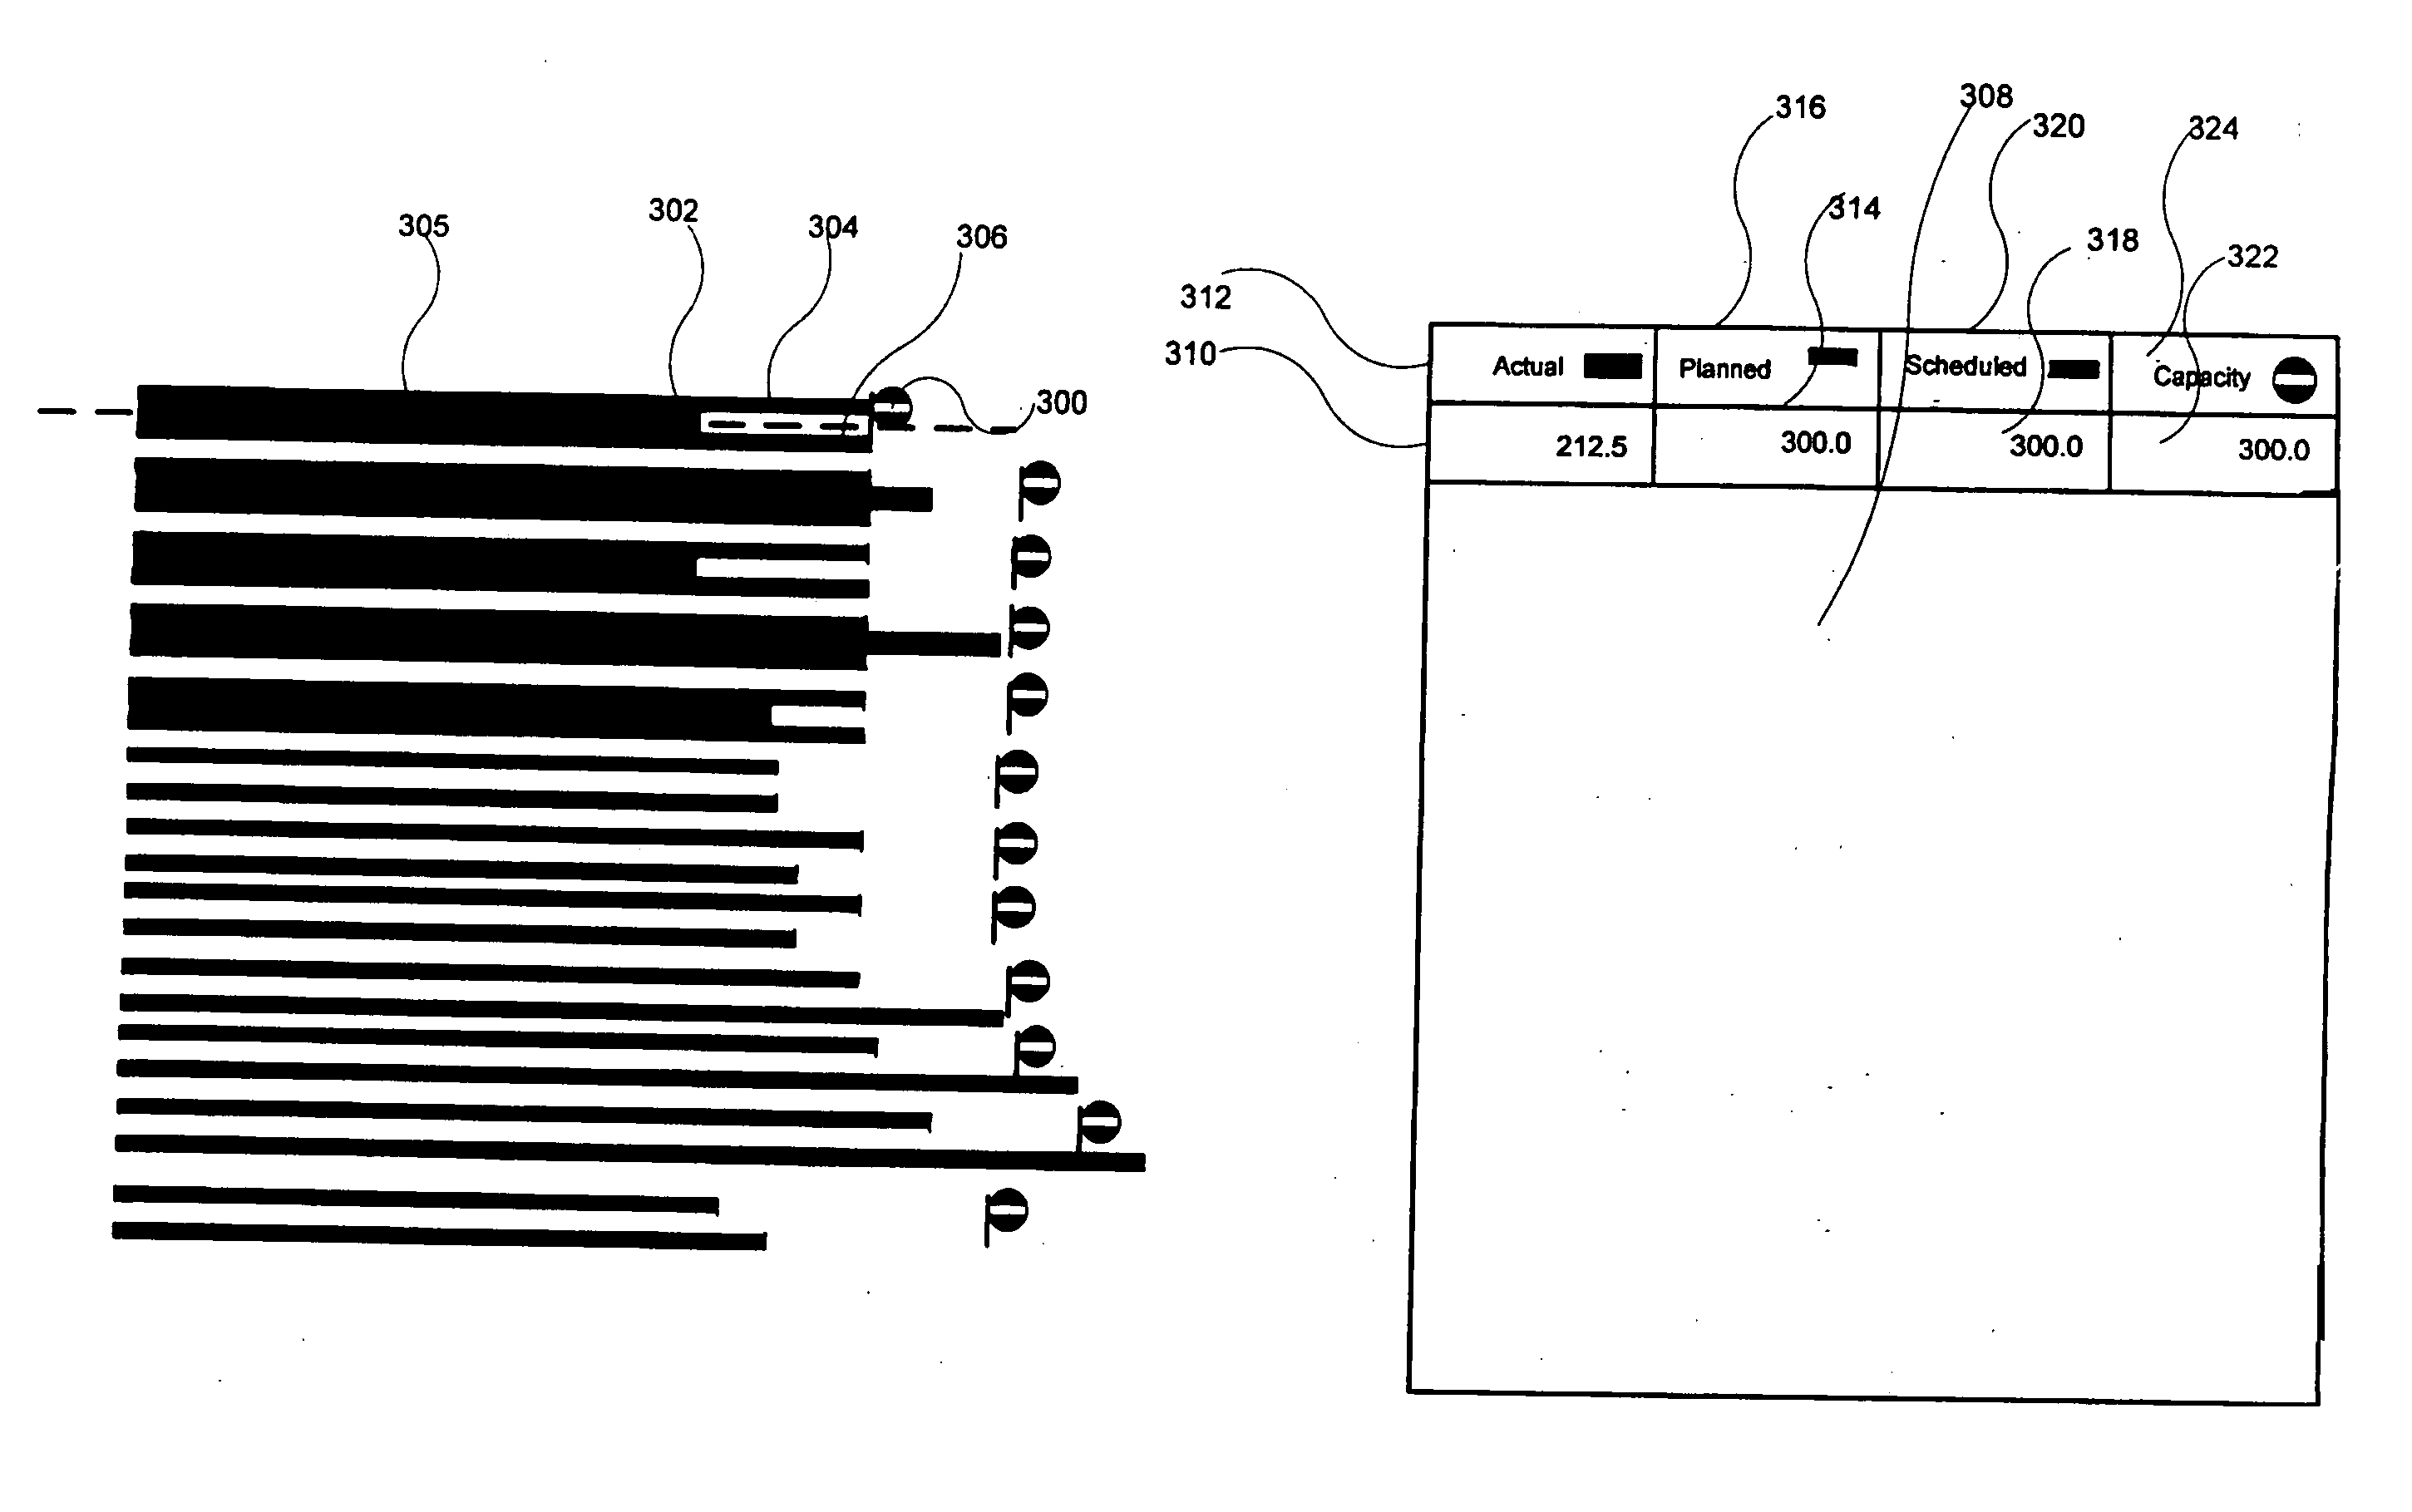
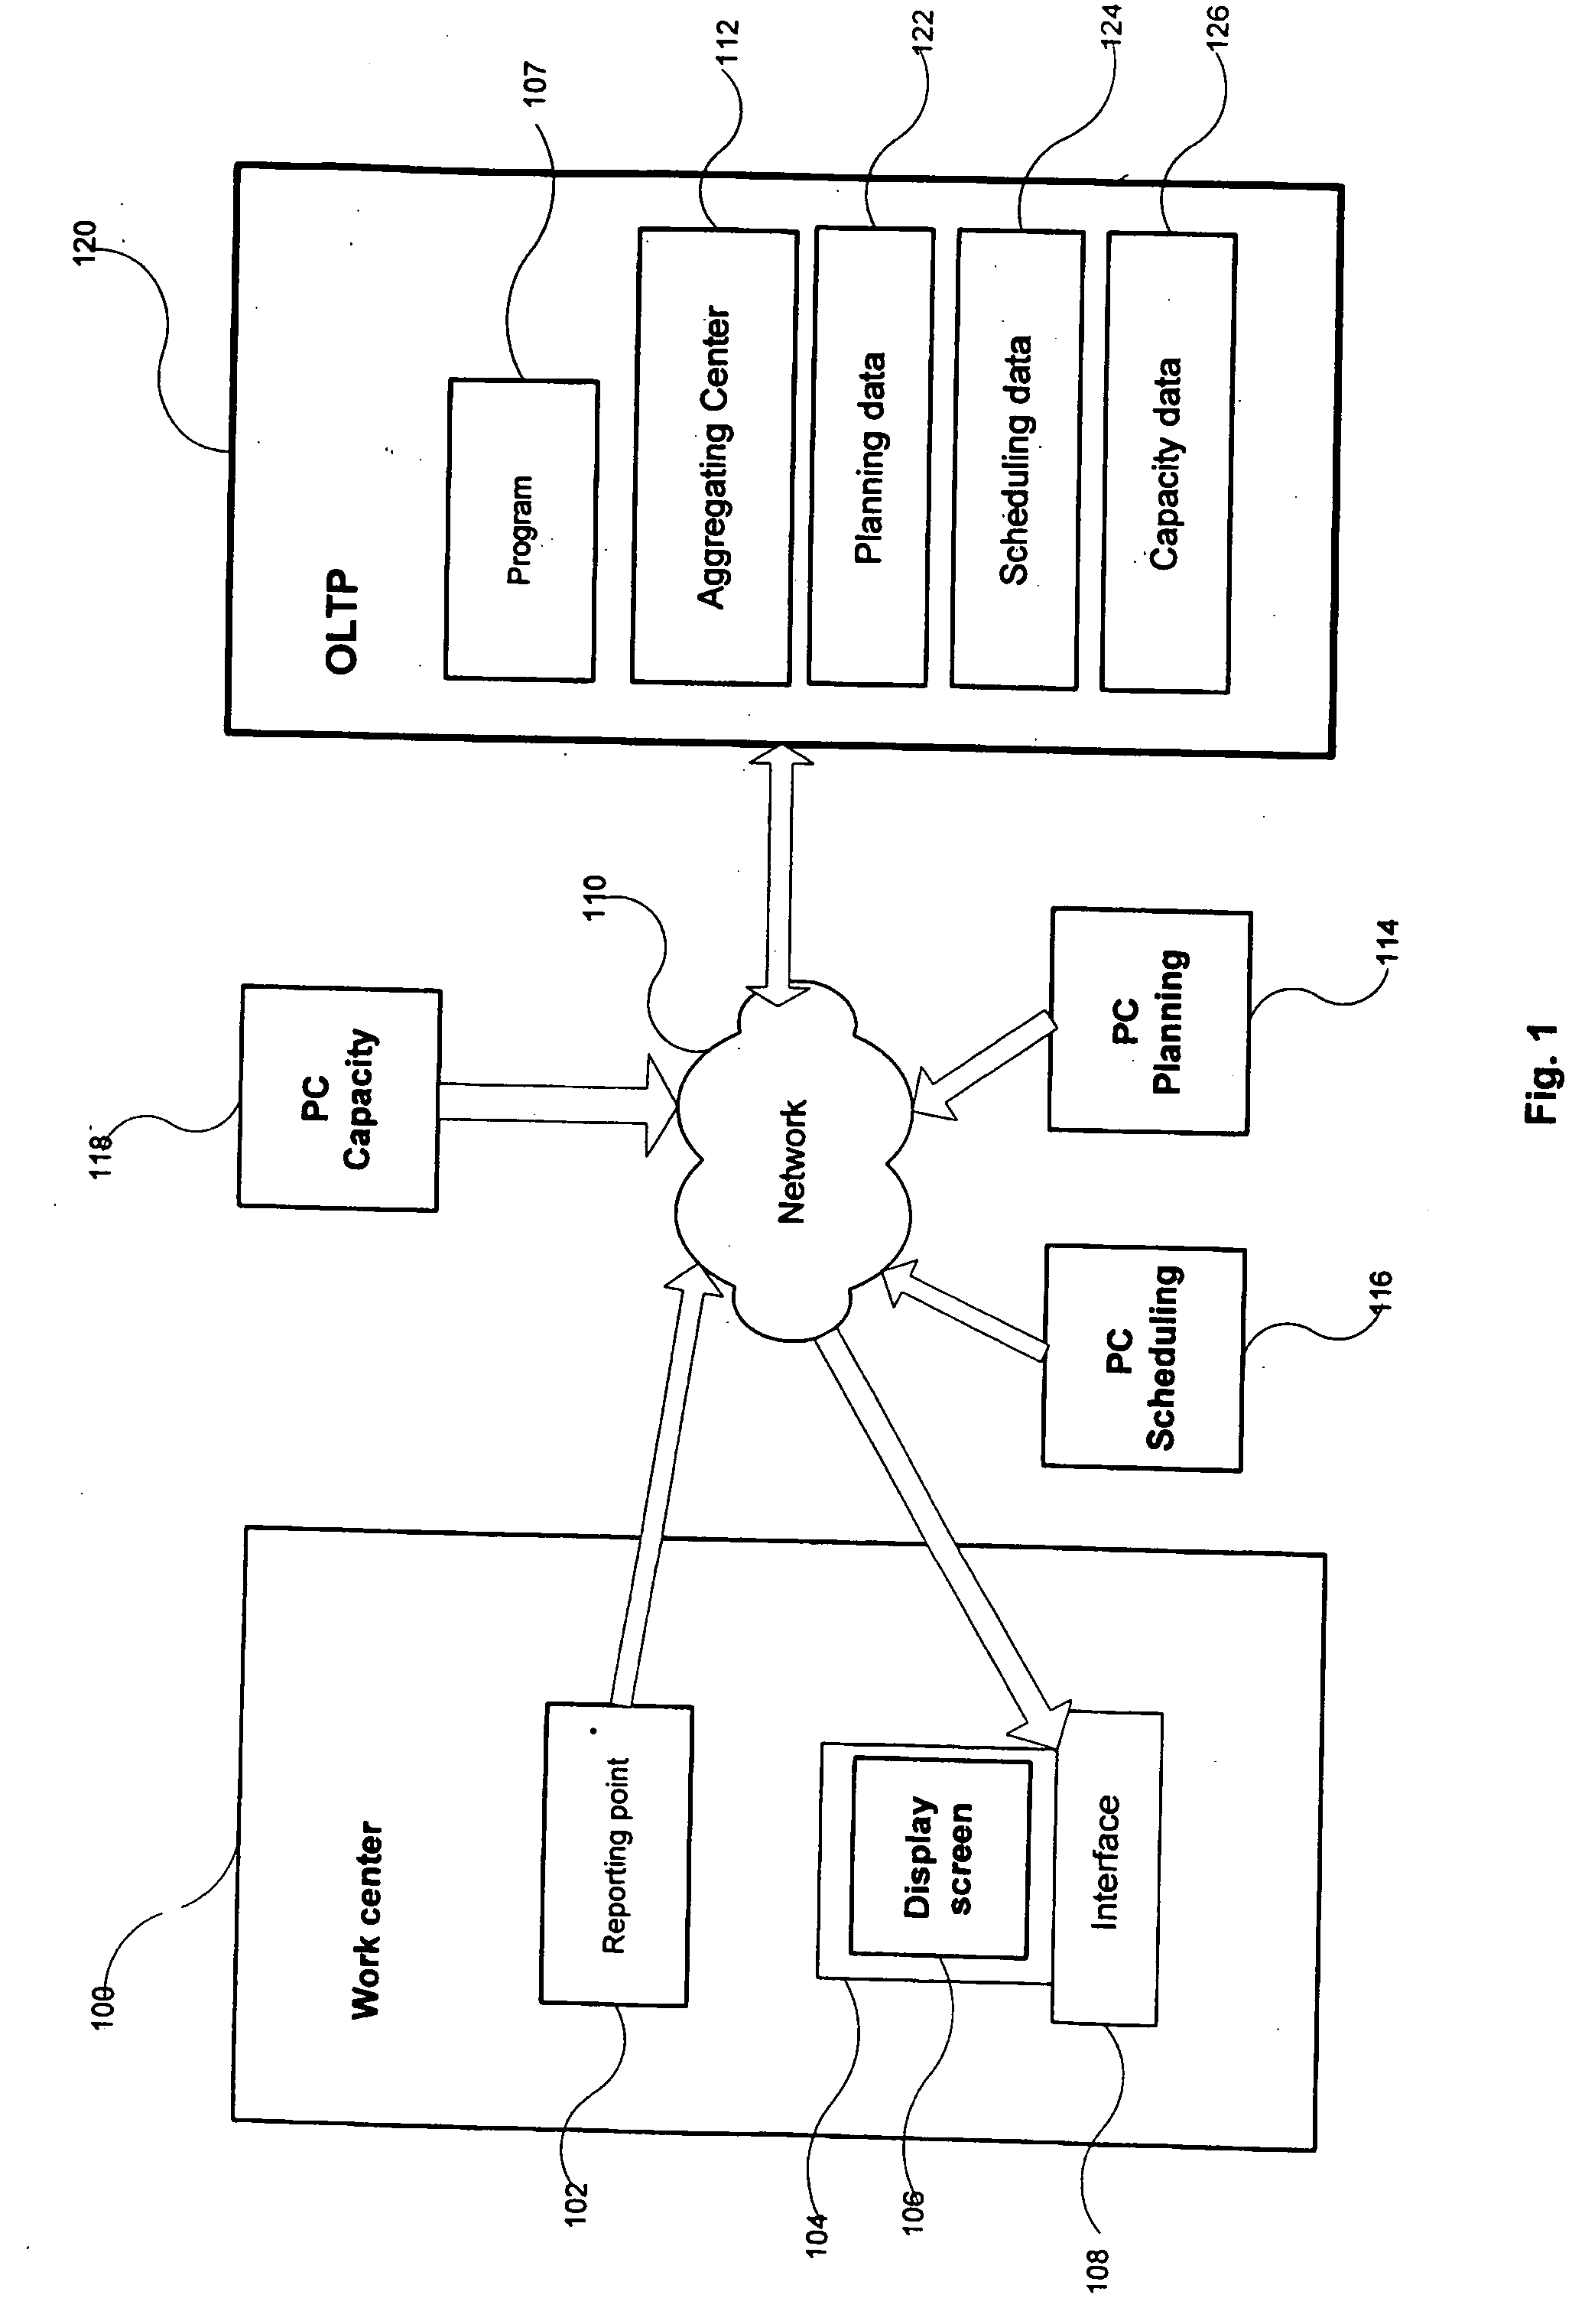
[0019]FIG. 1 is a block diagram schematically illustrating a graphical data display system according to an embodiment of the present invention. The system includes multiple client computers (104; 114-118), which are connected to Online Transaction Processing (OLTP) 120 which comprises data related to planning 122, scheduling 124 and capacity limitations 126, as well as program 107 that aggregates values for the aggregating center 112. In this exemplary embodiment, the display computer 104 is located in the work center 100 and it comprises display screen 106. The user interacts with the display computer through the interface 108. The client computers communicate with each other through a network 110.

[0020] The network 110 can be any network, such as a local area network, a wide area network, or the Internet. Each one of the client computers includes one or more processors and in this preferred embodiment they represent the work stations where planning 114, scheduling 116, capacity d...


PUM


Abstract

A method is provided to display a plurality of signals, on a display screen with an intuitive graphical interface, wherein a user has ability to monitor overall data from a single view. A plurality of signals having different frequencies and remaining in a complex relationship with each other may be visualized. Each signal may be displayed by using a symbol, wherein a quasi static signal is graphically depicted using a limit symbol while the dynamic signals are visualized using bar symbols. The symbols may be arranged horizontally, on multiple image planes, in close proximity to each other. A limit symbol may be positioned on the topmost image plane in such a way that if one bar reaches the limit symbol, the bar symbol is at least partially covered. The spatial relationship among the symbols is such that the user can easily determine if an actual signal output matches planned or scheduled output or if it does not exceed the total available capacity. A plurality of symbols may be allocated to correspond to a plurality of numeric values in such a way that numerical data directly corresponding to the graphical depiction is located in the same horizontal line as the symbols. Additionally, the user may be able to oversee the changes in signal in consecutive time segments.

Description

FIELD OF THE INVENTION [0001] The present invention relates in general to the field of data display and, in particular, to methods for displaying a plurality of signals having different frequencies. BACKGROUND AND PRIOR ART [0002] The increasing availability of large amounts of complex data requires development of methods that would allow a user to deal effectively with the available information. A common problem faced by the user is information overload. Graphical depictions of computer-generated data aid users in their analysis and understanding of data. Graphical representation of data provides also an insight into important characteristics of the data. [0003] However, when illustrating these data characteristics, many of graphical display methods of the prior art introduce data clutter into the graphical data displays. As a result, a demand exists for a computer display technique applicable to a very wide range of fields that would be intuitive and clutter-free. [0004] An import...

Claims


Application Information

Patent Timeline
IPC IPC(8): G09G5/00G06Q10/00
CPCG06Q10/06G06T11/206
Inventor AHLERT, DIRKGUENTHER, CHRISTIANSKUTELA, ARLANETESCH, GUIDO
Owner SAP AG
Why Eureka
Try Eureka