
Stochastic variable selection method for model selection

a selection method and stochastic variable technology, applied in the field of statistical data analysis, can solve the problems of missing more subtle features of data, encroaching wealth of information, and posing data analysis challenges, and achieve the effect of facilitating the proper identification and/or classification of intermediate values

Inactive Publication Date: 2005-04-21
CASE WESTERN RESERVE UNIV +1
View PDF2 Cites 16 Cited by
  • Summary
  • Abstract
  • Description
  • Claims
  • Application Information

AI Technical Summary

Benefits of technology

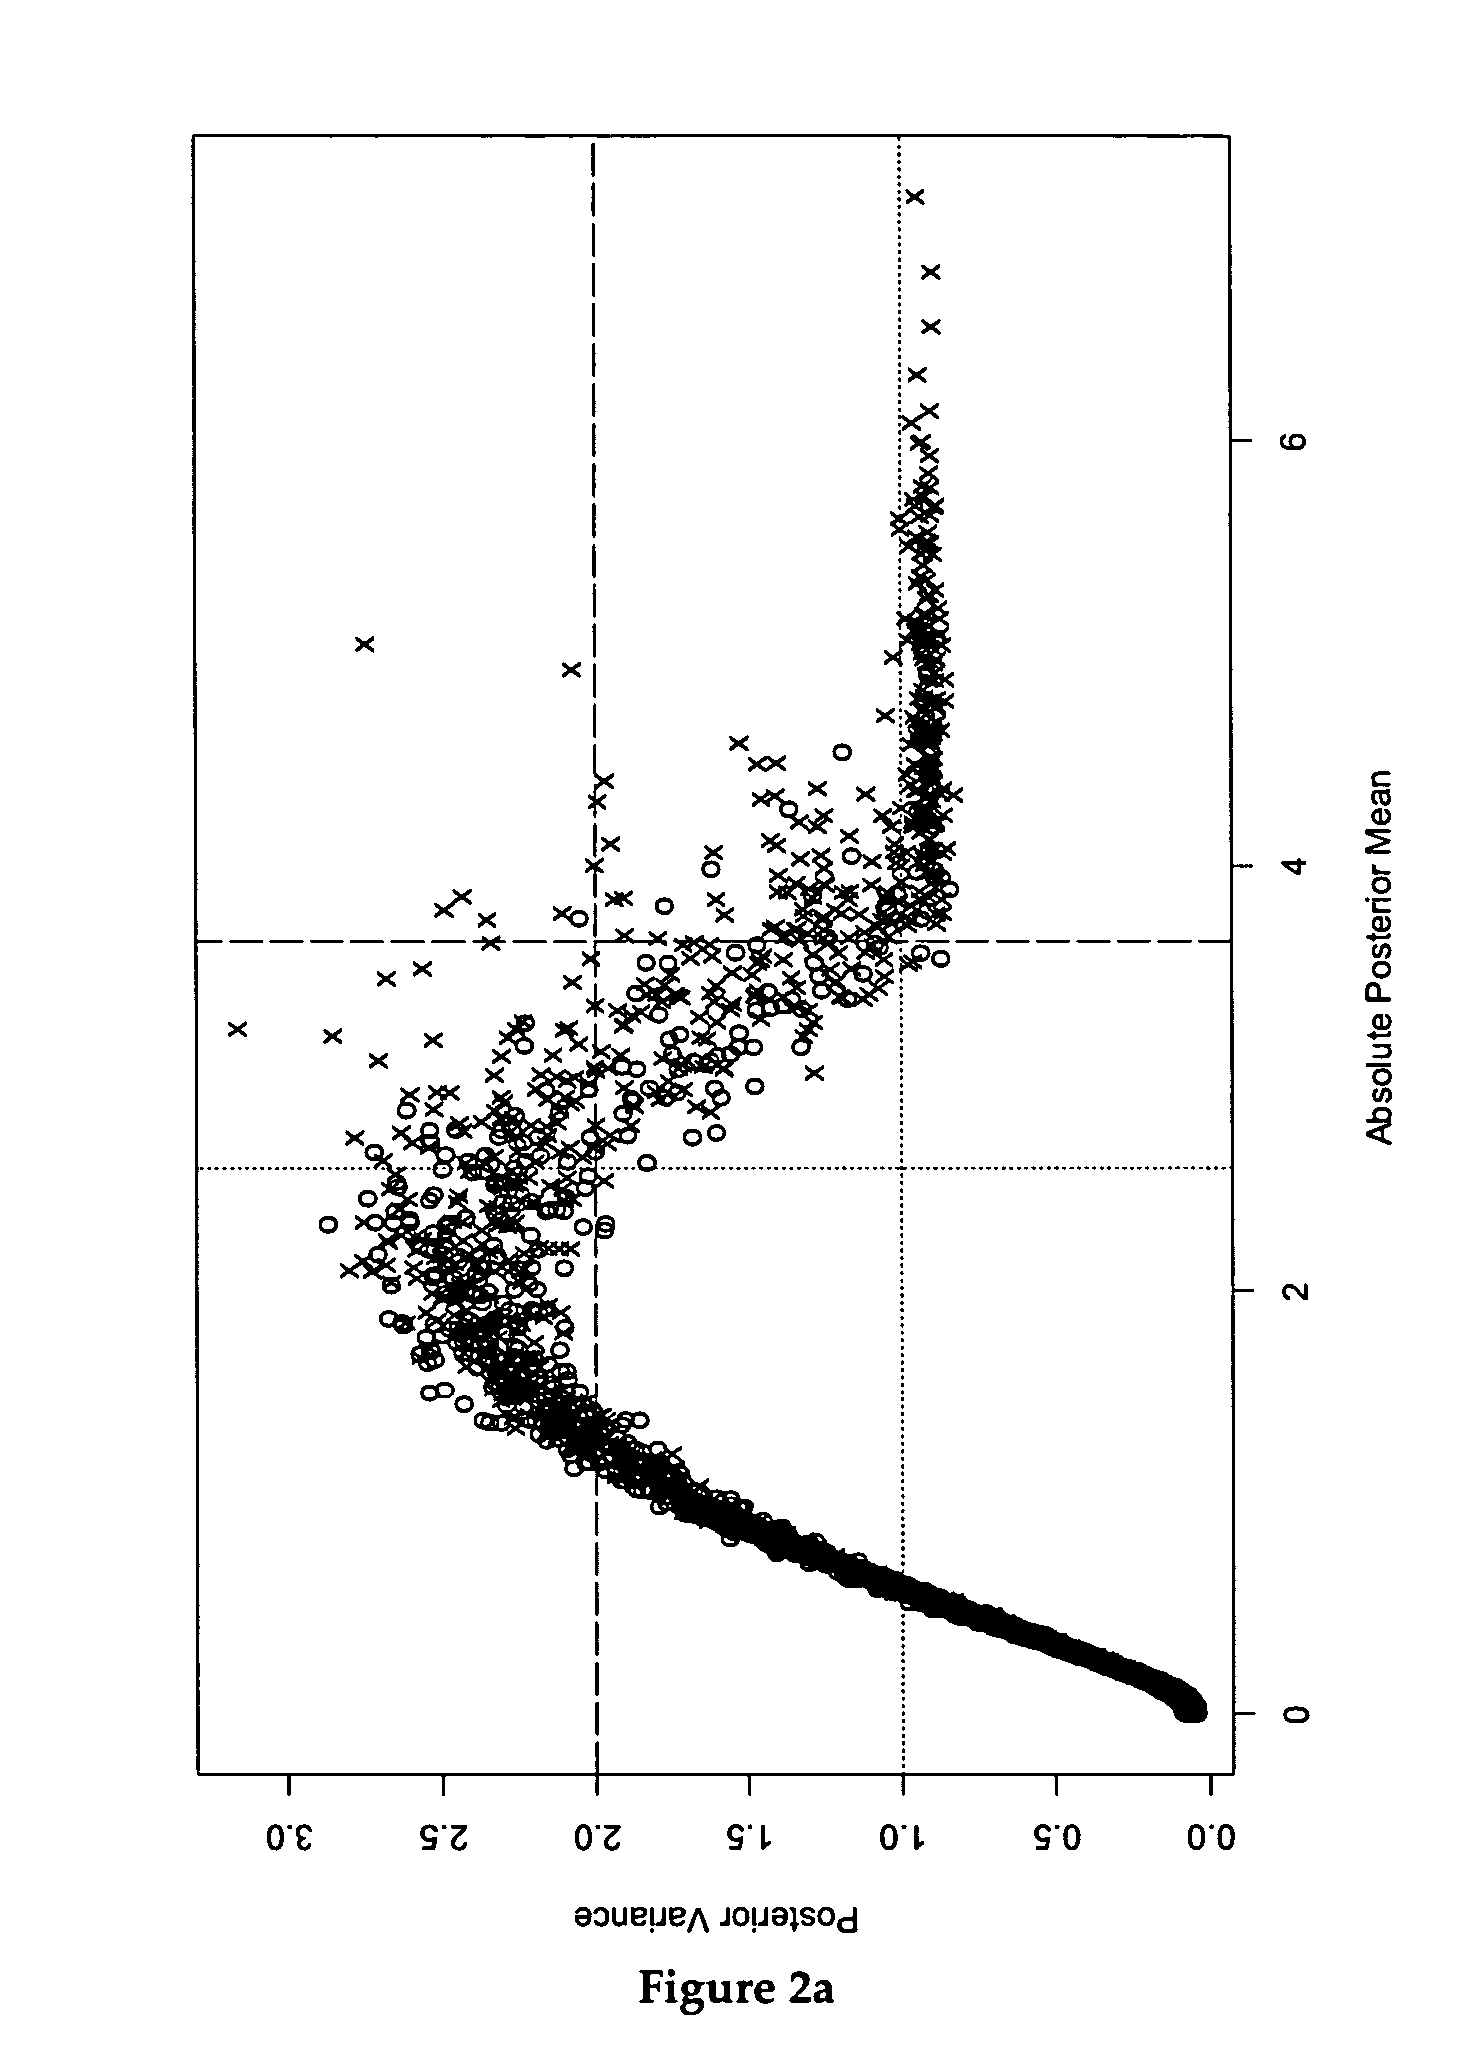
[0019] Another distinctive feature of the systems and methods described herein is a graphical method that facilitates the proper identification and / or classification of the intermediate values of the data. By plotting the posterior variance against the posterior mean of the model parameters, the systems and methods disclosed herein highlight a feature of the intermediate data points that may otherwise be missed by other methods known in the art. Those of ordinary skill in the art know, or can readily ascertain having read this specification, that variations of the plot just described are possible; for example, the posterior mean may be replaced by the posterior median. Moreover, a generalization exists of the two-group BAM shrinkage plot extended to multiple groups. In one embodiment, a particular group is designated as a baseline, and individual two dimensional plots of pairwise BAM test statistic values (also called Bayes test statistics)-which are group effect test statistics against the designated baseline group-are plotted. According to one practice, a number of two-dimensionals plots are generated based, at least in part, on the total number of groups under study. Such variations and / or generalizations do not depart from the scope of the claimed subject matter.

Problems solved by technology

The high data-throughput nature of instruments at our disposal not only creates an enormous wealth of information, but also poses a data-analysis challenge, because of the large multiple testing or classification problems involved.
A drawback of such a method is that more subtle features of the data are missed, features that might give analysts more insight into how to test various hypotheses on collected data.

Method used


Image

  • Stochastic variable selection method for model selection
  • Stochastic variable selection method for model selection
  • Stochastic variable selection method for model selection

Examples


Embodiment Construction

[0043] To provide an overall understanding of the systems and methods described herein, certain illustrative practices and embodiments will now be described. However, it will be understood by one of ordinary skill in the art that the systems and methods described herein can be adapted and modified and applied in other applications, and that such other additions, modifications, and uses will not depart from the scope hereof.

Overview

[0044] Unless defined otherwise, all technical and scientific terms used herein have the same meaning as commonly understood by one of ordinary skill in the art to which the systems and methods described herein pertain.

[0045] The embodiments described herein comprise statistical data analysis methods, and the systems that implement those methods, which may be used in various contexts and applications. Although by no means limited to large-scale systems, in terms of scope, the systems and methods described herein are suitable for applications wherein a ...


PUM

PropertyMeasurementUnit
probability densityaaaaaaaaaa
two-point probability densityaaaaaaaaaa
sizeaaaaaaaaaa

Abstract

A method of identifying differentially-expressed genes includes deriving an analysis of variance (ANOVA) or analysis of covariance (ANCOVA) model for expression data associated with a number of genes; from the ANOVA or ANCOVA model, deriving a linear regression model defined at least in part by an observation vector representative of an observed subset of the gene-expression data, a design matrix of regressor variables, a vector of regression coefficients representing gene contribution to the observation vector, and a measurement error vector; and to the linear regression model, applying a hierarchical selection algorithm to designate a subset of the regression coefficients as significant regression coefficients, the selection algorithm representing at least one of the observation vector, the design matrix, and the measurement error vector as being hierarchically dependent on parameters having predetermined probabilistic properties, wherein the designated subset corresponds to a respective subset of the genes identified as differentially expressed.

Description

CROSS-REFERENCE TO RELATED APPLICATIONS [0001] This application incorporates by reference in entirety, and claims priority to and benefit of, U.S. Provisional Patent Application No. 60 / 474,456, filed on 30 May 2003.STATEMENT REGARDING FEDERAL FUNDING [0002] Work described herein was funded, in part, by the National Institutes of Health, Grant No. K25-CA89867. The United States government has certain rights in the invention.BACKGROUND [0003] The systems and methods described herein pertain to statistical data analysis in general, and to model selection in particular. [0004] Multiple hypothesis testing—also known by model selection, data classification, multiple detection, and other descriptors—has become important in an age of increasingly sophisticated data-gathering technologies. The high data-throughput nature of instruments at our disposal not only creates an enormous wealth of information, but also poses a data-analysis challenge, because of the large multiple testing or classif...

Claims


Application Information

Patent Timeline
Patent Type & Authority Applications(United States)
IPC IPC(8): G16B40/10G01N33/48G01N33/50G16B25/00
CPCG06F19/24G06F19/20G16B25/00G16B40/00G16B40/10
Inventor RAO, JONNAGADDA SUNILISHWARAN, HEMANT
Owner CASE WESTERN RESERVE UNIV
Learn More