
Apparatus and method for monitoring system health based on fuzzy metric data ranges and fuzzy rules

a technology of fuzzy metric data and fuzzy rules, applied in the field of computation and display, can solve the problems of difficult selection of appropriate threshold values, poor indicators of overall system state of individual metrics, and complex task of monitoring computer system or application performance, etc., and achieves easy specification, large reduction of data amount, and reduced maintenance costs

Inactive Publication Date: 2005-03-24
IBM CORP
View PDF9 Cites 81 Cited by
  • Summary
  • Abstract
  • Description
  • Claims
  • Application Information

AI Technical Summary

Benefits of technology

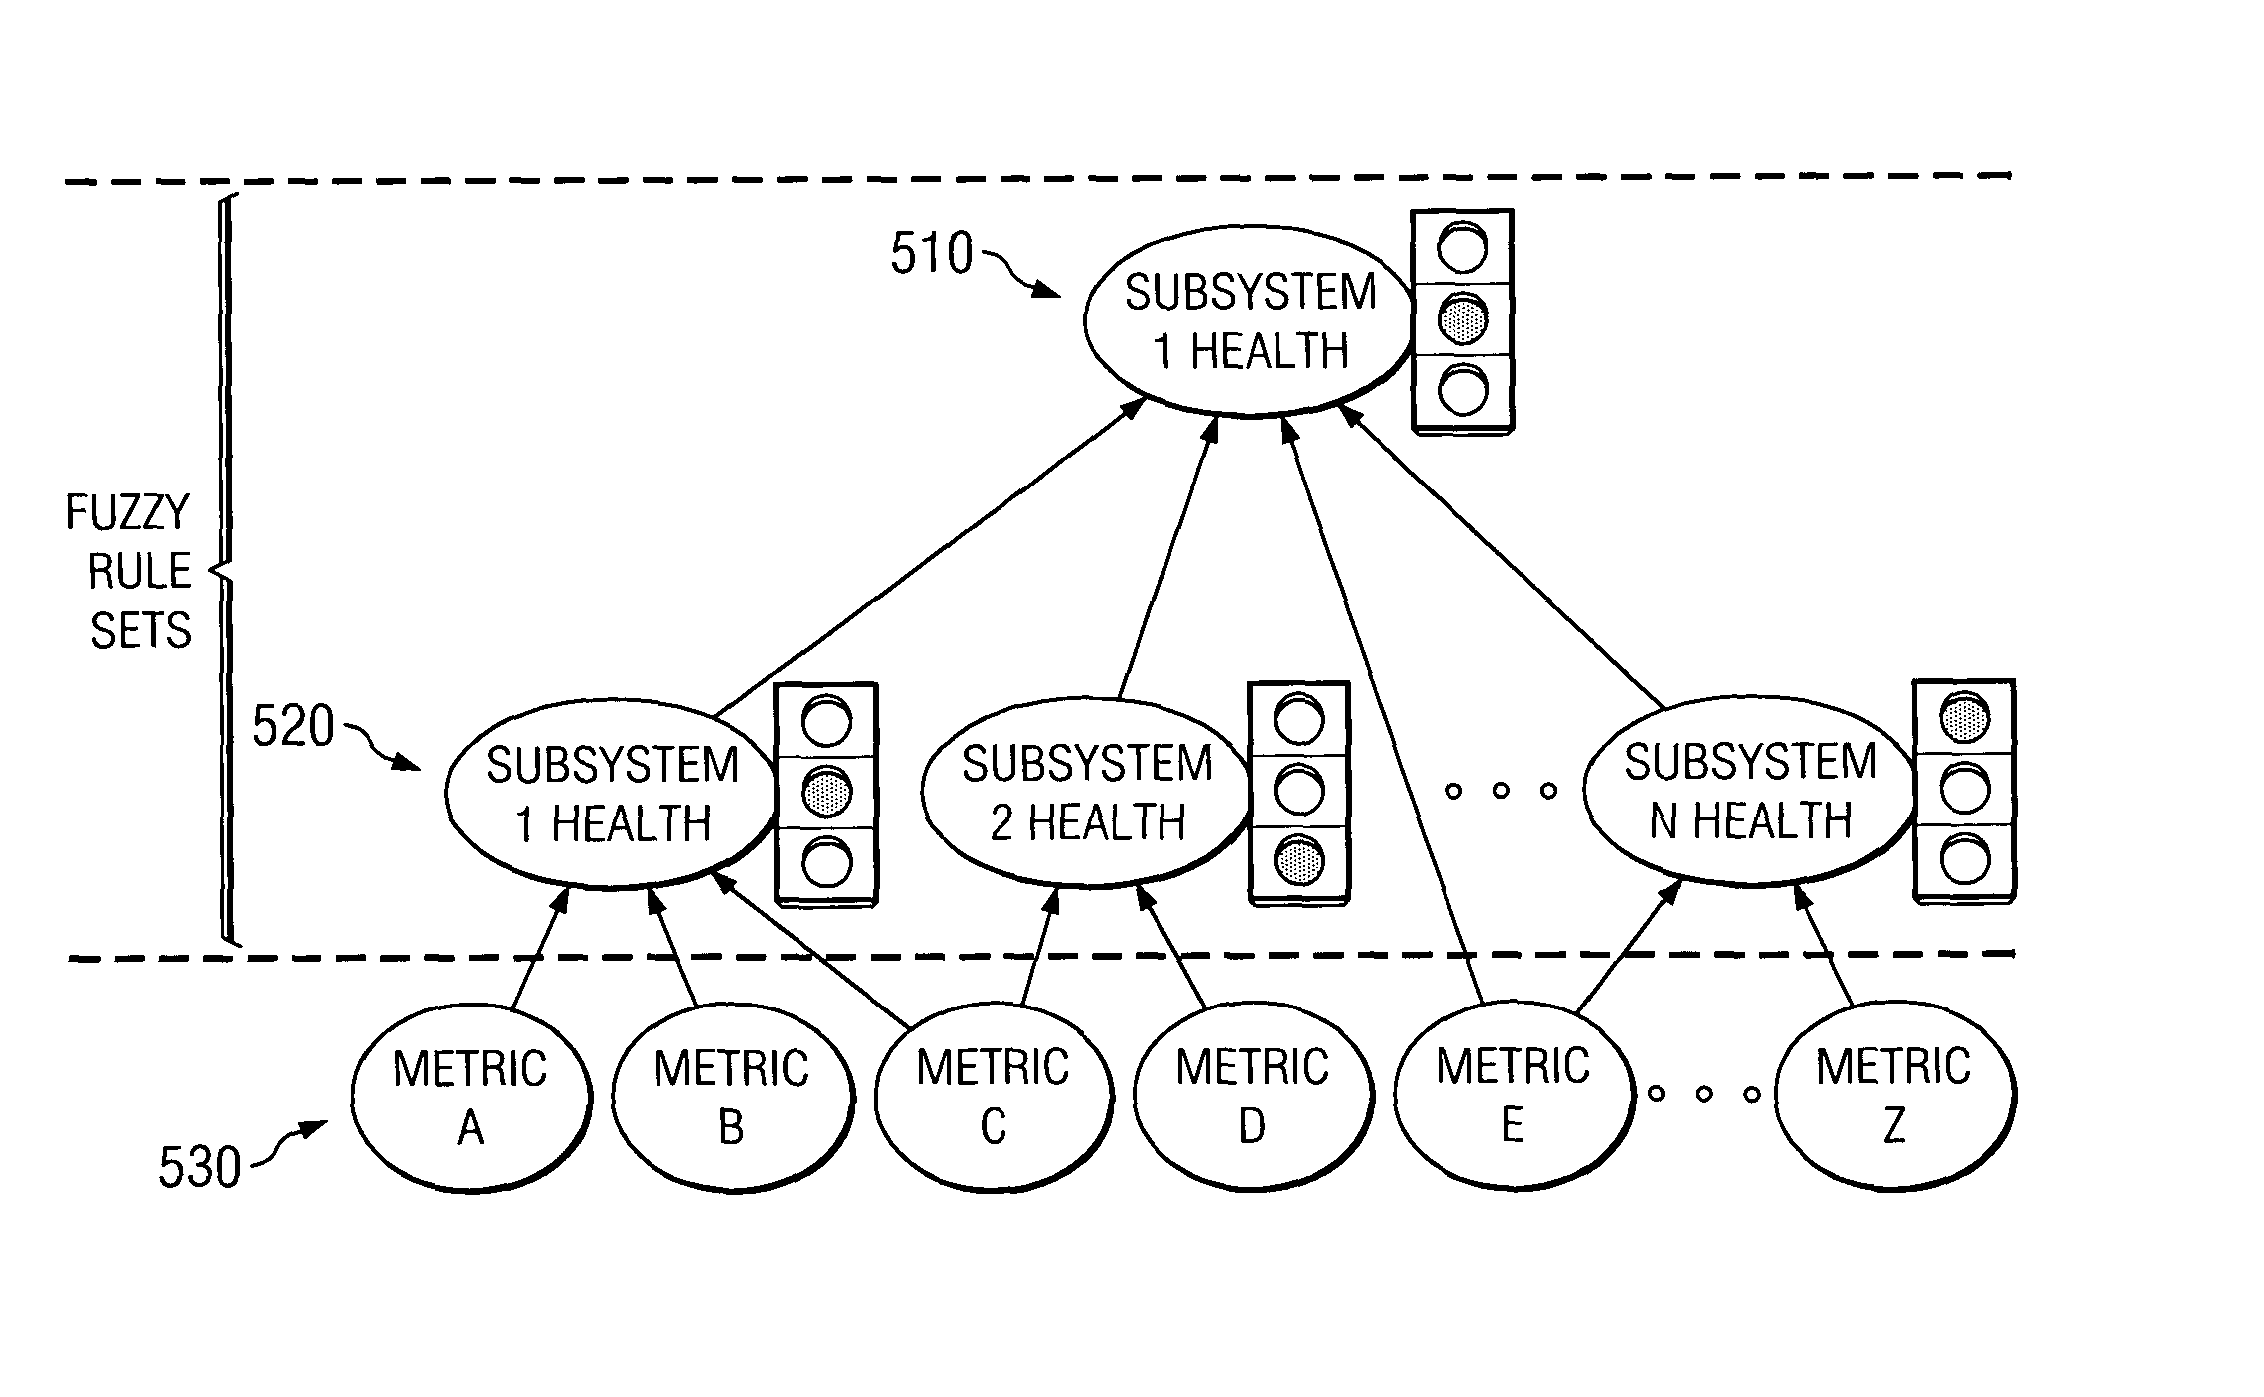
[0015] Thus, the present invention provides a method and apparatus to collect and mine performance data to define fuzzy sets over the anticipated discourse or domain for that metric. Fuzzy rules are then used to reason about the metrics in a natural language format. The invention also enables the hierarchical construction of groups of system monitors using fuzzy rules, resulting in a large reduction in the amount of data that an administrator needs to attend to.
[0016] One principle advantage of this invention is to allow the monitoring of metrics using a natural language knowledge representation (e.g., fuzzy if-then rules) and a way to ignore “normal” behavior of a metric (or set of metrics) while easily specifying the actions to be taken when the metric (or set of metrics) goes out of “normal” range. In one exemplary embodiment, the present invention solves the problems of the prior art noted above by formulating metric “normal” states as Gaussian or other kernel-shaped fuzzy sets and then using fuzzy rules to reason about the metrics rather than using simple Boolean threshold tests. The fuzzy rule formulation of this problem is more natural to experts because the fuzzy rules allow the use of linguistic hedges (some, almost, very) to be used in describing metric states.
[0017] As system performance or status changes, the monitoring system can adapt by changing the shape of the “normal” fuzzy set based on the distribution of metric values. The rules may remain the same but the fuzzy set may change dynamically. This greatly reduces maintenance costs since the monitoring rule set can be slowly tuned over time, while the underlying “normal” fuzzy sets could be adjusted as often as needed. In fact, the normal range for a metric is highly dependent on the particular system and workload being handled on that system. The present invention provides a mechanism to express the knowledge about the key underlying relationships as fuzzy rules and then to automatically tailor the fuzzy sets that are referenced in the fuzzy rules using statistical data mining techniques.

Problems solved by technology

Monitoring computer system or application performance is a complex task.
While this traditional approach is simple, it has many drawbacks.
Individual metrics are poor indicators of overall system state.
Additionally, metric values may naturally vary over a wide range, making the selection of an appropriate threshold value very difficult.
Consequently, many false alarms are usually issued.
Although more sophisticated, these alternate monitoring algorithms still result in a binary alarm or no-alarm decision resulting in an alert event being sent to the administration console.
While this type of display provides more information than the binary alert approach, it adds increased complexity to the monitoring system because an algorithm must be derived to compute the ternary system state from the set of performance metrics or from a stream of binary alarm events.
Often these algorithms are not exposed to the end-users or administrators and so they are unable to gauge the appropriateness of the green / yellow / red state classifications to the underlying performance metrics.

Method used


Image

  • Apparatus and method for monitoring system health based on fuzzy metric data ranges and fuzzy rules
  • Apparatus and method for monitoring system health based on fuzzy metric data ranges and fuzzy rules
  • Apparatus and method for monitoring system health based on fuzzy metric data ranges and fuzzy rules

Examples


Embodiment Construction

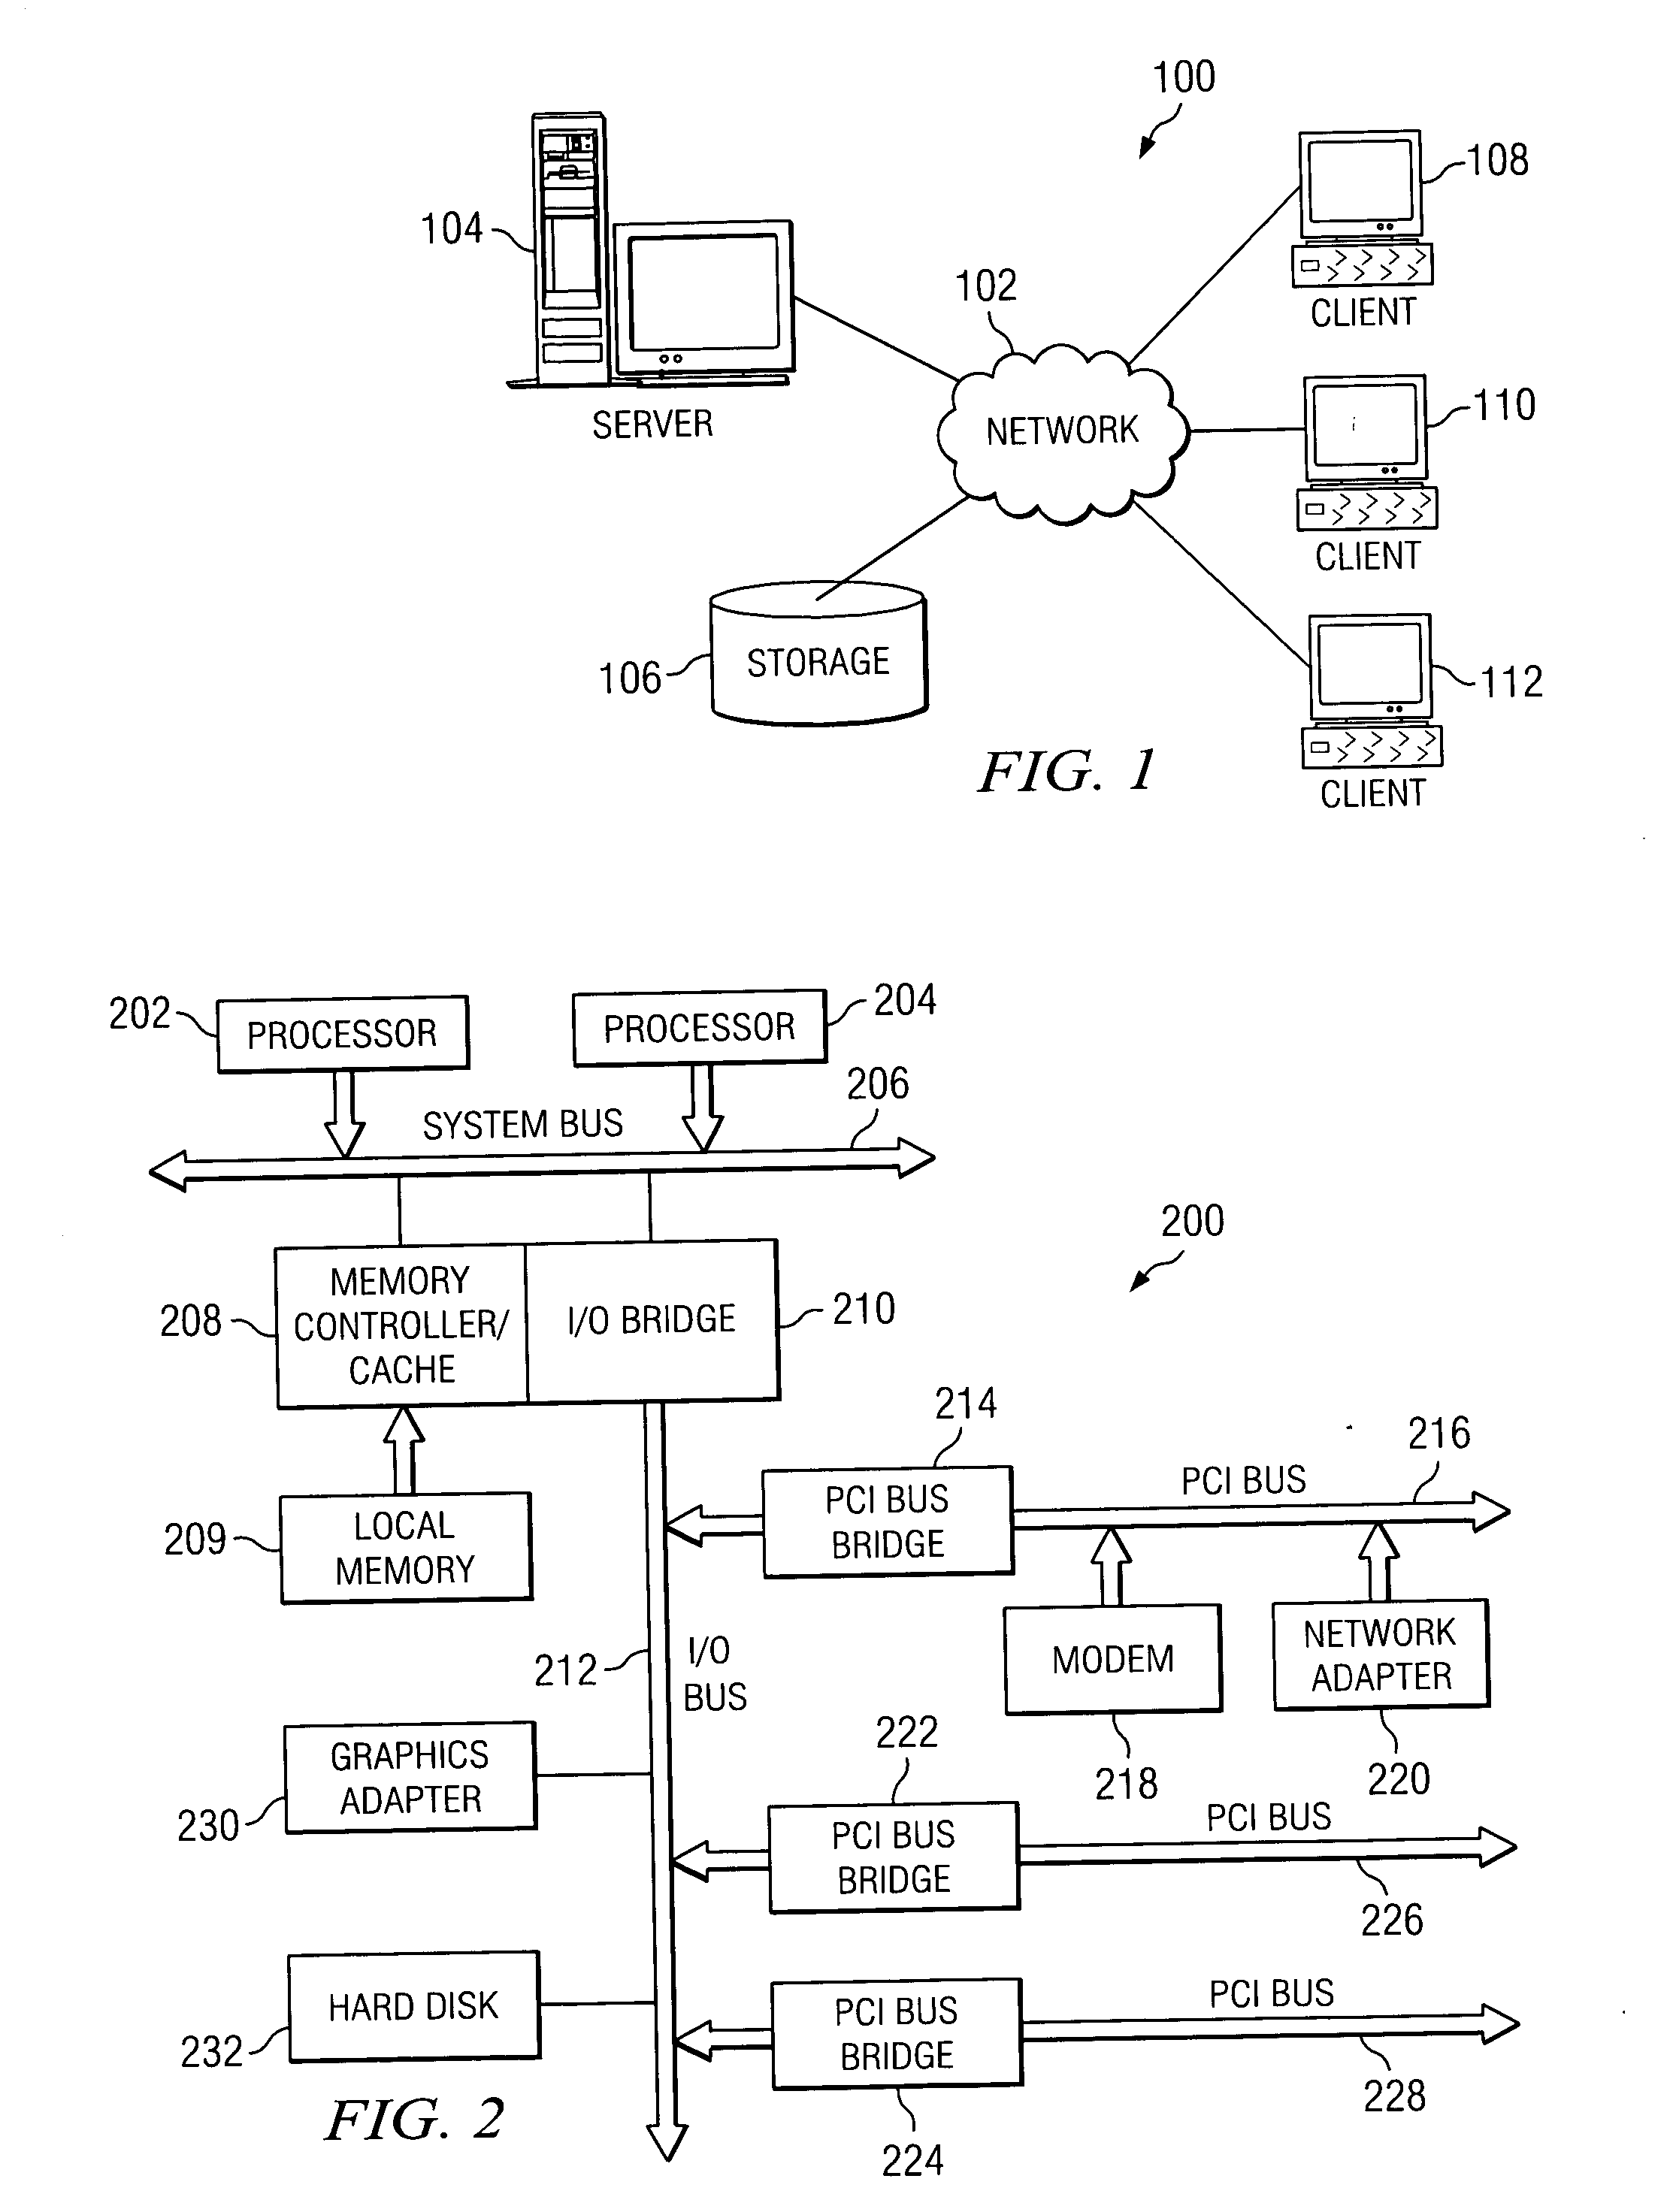
[0030] The present invention provides mechanisms for monitoring the health of applications, subsystems, and systems in which the underlying “normal” set may defined in accordance with statistical data mining of metric history data and in which the rules defining the relationships between metrics and system health are defined in a natural language manner. The embodiments of the present invention may be implemented in a stand-alone computing system or a distributed computing system. As such, the following FIGS. 1-3 are intended to provide a context for the description of the functions and operations of the present invention following thereafter. That is, the functions and operations described herein may be performed in one or more of the computing devices described in FIGS. 1-3.

[0031] With reference now to the figures, FIG. 1 depicts a pictorial representation of a network of data processing systems in which the present invention may be implemented. Network data processing system 100...


PUM


Abstract

A method and apparatus for determining the status of a computer system and software applications running on that system and displaying the status to a system administrator are provided. With the apparatus and method, metrics related to a particular application or subsystem are identified and then collected over a predetermined period of time using a data monitoring or collection facility to generate metric history data. Once collected, the metric history data is analyzed by computing a set of parameters representing statistical measures of the metric history data. A set of fuzzy rules are used to define the relationships between metrics and the ultimate application or subsystem status. This metric history analysis phase may be performed periodically such that the fuzzy sets are dynamically redefined at periodic intervals. The fuzzy rules are then evaluated using a fuzzy reasoning process and an overall status indication is generated. As system performance or status changes, the monitoring system can adapt by changing the shape of the “normal” fuzzy set based on the distribution of metric values. The rules may remain the same but the fuzzy set may change dynamically. This greatly reduces maintenance costs since the monitoring rule set can be slowly tuned over time, while the underlying “normal” fuzzy sets could be adjusted as often as needed. Thus, the method and apparatus provide a mechanism to express the knowledge about the key underlying relationships as fuzzy rules and then to automatically tailor the fuzzy sets that are referenced in the fuzzy rules using statistical data mining techniques.

Description

BACKGROUND OF THE INVENTION [0001] 1. Technical Field [0002] The present invention relates to the field of computer system monitoring, and in particular, to the computation and display of the status of operating system, middleware, and application software running on a computer system. [0003] 2. Description of Related Art [0004] Monitoring computer system or application performance is a complex task. There can be tens or hundreds of underlying metrics (CPU utilization, queue lengths, number of threads, etc.) which contribute to an overall measure of system performance. The most common approach is to identify the appropriate metrics for a specific purpose and set explicit numeric thresholds for the monitoring software to test these metrics against at specified intervals. When metrics go over specified thresholds then alert events are usually signaled to a centralized administration console indicating an error condition. [0005] While this traditional approach is simple, it has many dr...

Claims


Application Information

Patent Timeline
IPC IPC(8): G06F9/44G06F11/30G06F15/00G06N7/02G06N7/06G21C17/00
CPCG06F11/3409G06N5/048G06F11/3447
Inventor BIGUS, JOSEPH PHILLIPSCHLOSNAGLE, DONALD ALLEN
Owner IBM CORP
Learn More