
Analytical device with prediction module and related methods

an analytical device and prediction module technology, applied in the field of analytical devices, can solve the problems of inaccuracy of isf analytical devices, affecting the analysis of analyte volume errors, sensor fouling, etc., and achieve the effects of dampening noise, removing noise from data, and increasing the accuracy of analytical devices

Inactive Publication Date: 2004-12-16
LIFESCAN INC
View PDF47 Cites 176 Cited by
  • Summary
  • Abstract
  • Description
  • Claims
  • Application Information

AI Technical Summary

Benefits of technology

[0008] Embodiments of the present invention include analytical devices and methods that accurately account for physiological lag and bias effects. In addition, the analytical device and associated methods do not require samples of capillary blood for calibration.
[0012] Embodiments of analytical devices and methods according to the present invention predict a subject's blood analyte concentration based solely on a series of ISF analyte concentrations derived from ISF samples extracted in a continuous or semi-continuous manner. The analytical devices and methods do so using an algorithm that predicts the subject's blood analyte concentration based on the series of ISF analyte concentrations. The algorithm accounts for physiological lag and bias effects. In addition, the analytical device does not require calibration using capillary blood.
[0036] The determination of suitable weighting factors can be, for example, an iterative process in which a weighting factor(s) is applied in a model, the weighting factor's effect on model results observed, and the weighting factor(s) adjusted based on model error reduction. The choice of weighting factors in the mathematical modeling method can also be determined, for example, by the relative importance of data ranges and / or trending direction. For example, when glucose is the analyte of interest, greater accuracy for the low end of the physiological glucose concentration range may be deemed important, and thus a weighting factor that enhances the importance of lower glucose concentrations can be employed. Such an enhancement can be accomplished, for example, by multiplying observed glucose concentrations by the inverse of the observed value raised to a predetermined power. Similarly, weighting factors can be determined which will enhance the importance of certain events or trends in observed values, such as a magnitude of the gradient of an observed rate and / or a change in direction. Furthermore, prospective weighting factors can also be arbitrarily chosen with suitable weighting factors chosen from the prospective weighting factors based on their effect on model error reduction.
[0049] Eqn 2 includes moving average rates (i.e., ma.sub.nrate.sub.m) to smooth the data (i.e., the series of ISF analyte concentrations and / or rates) with respect to both rate and the trending direction of an analyte concentration, thereby removing noise from the data and increasing the analytical device's accuracy. Although significant (i.e., major) changes in adjacent ISF values can be regarded as important in terms of algorithm accuracy, significant changes can also be due to noise that can adversely effect an algorithm's accuracy. The moving average rate, which is the rate of change between the means of adjacent (and overlapping) groupings of ISF values, dampens noise caused by outlier values that do not represent a true trend in the data.

Problems solved by technology

In practice, however, such analytical devices can have drawbacks.
The use of various sites and penetration depths for obtaining an ISF sample can be a contributing factor in an ISF analytical devices' inaccuracy.
For example, ISF collected from the subcutaneous region of a subject's skin can be more prone to containing contaminating substances such as triglycerides, which can affect analyte analysis in terms of volume error and sensor fouling.
Furthermore, conventional ISF analytical devices can require inconvenient and cumbersome calibration procedures involving samples of capillary blood.

Method used


Image

  • Analytical device with prediction module and related methods
  • Analytical device with prediction module and related methods
  • Analytical device with prediction module and related methods

Examples


example 2

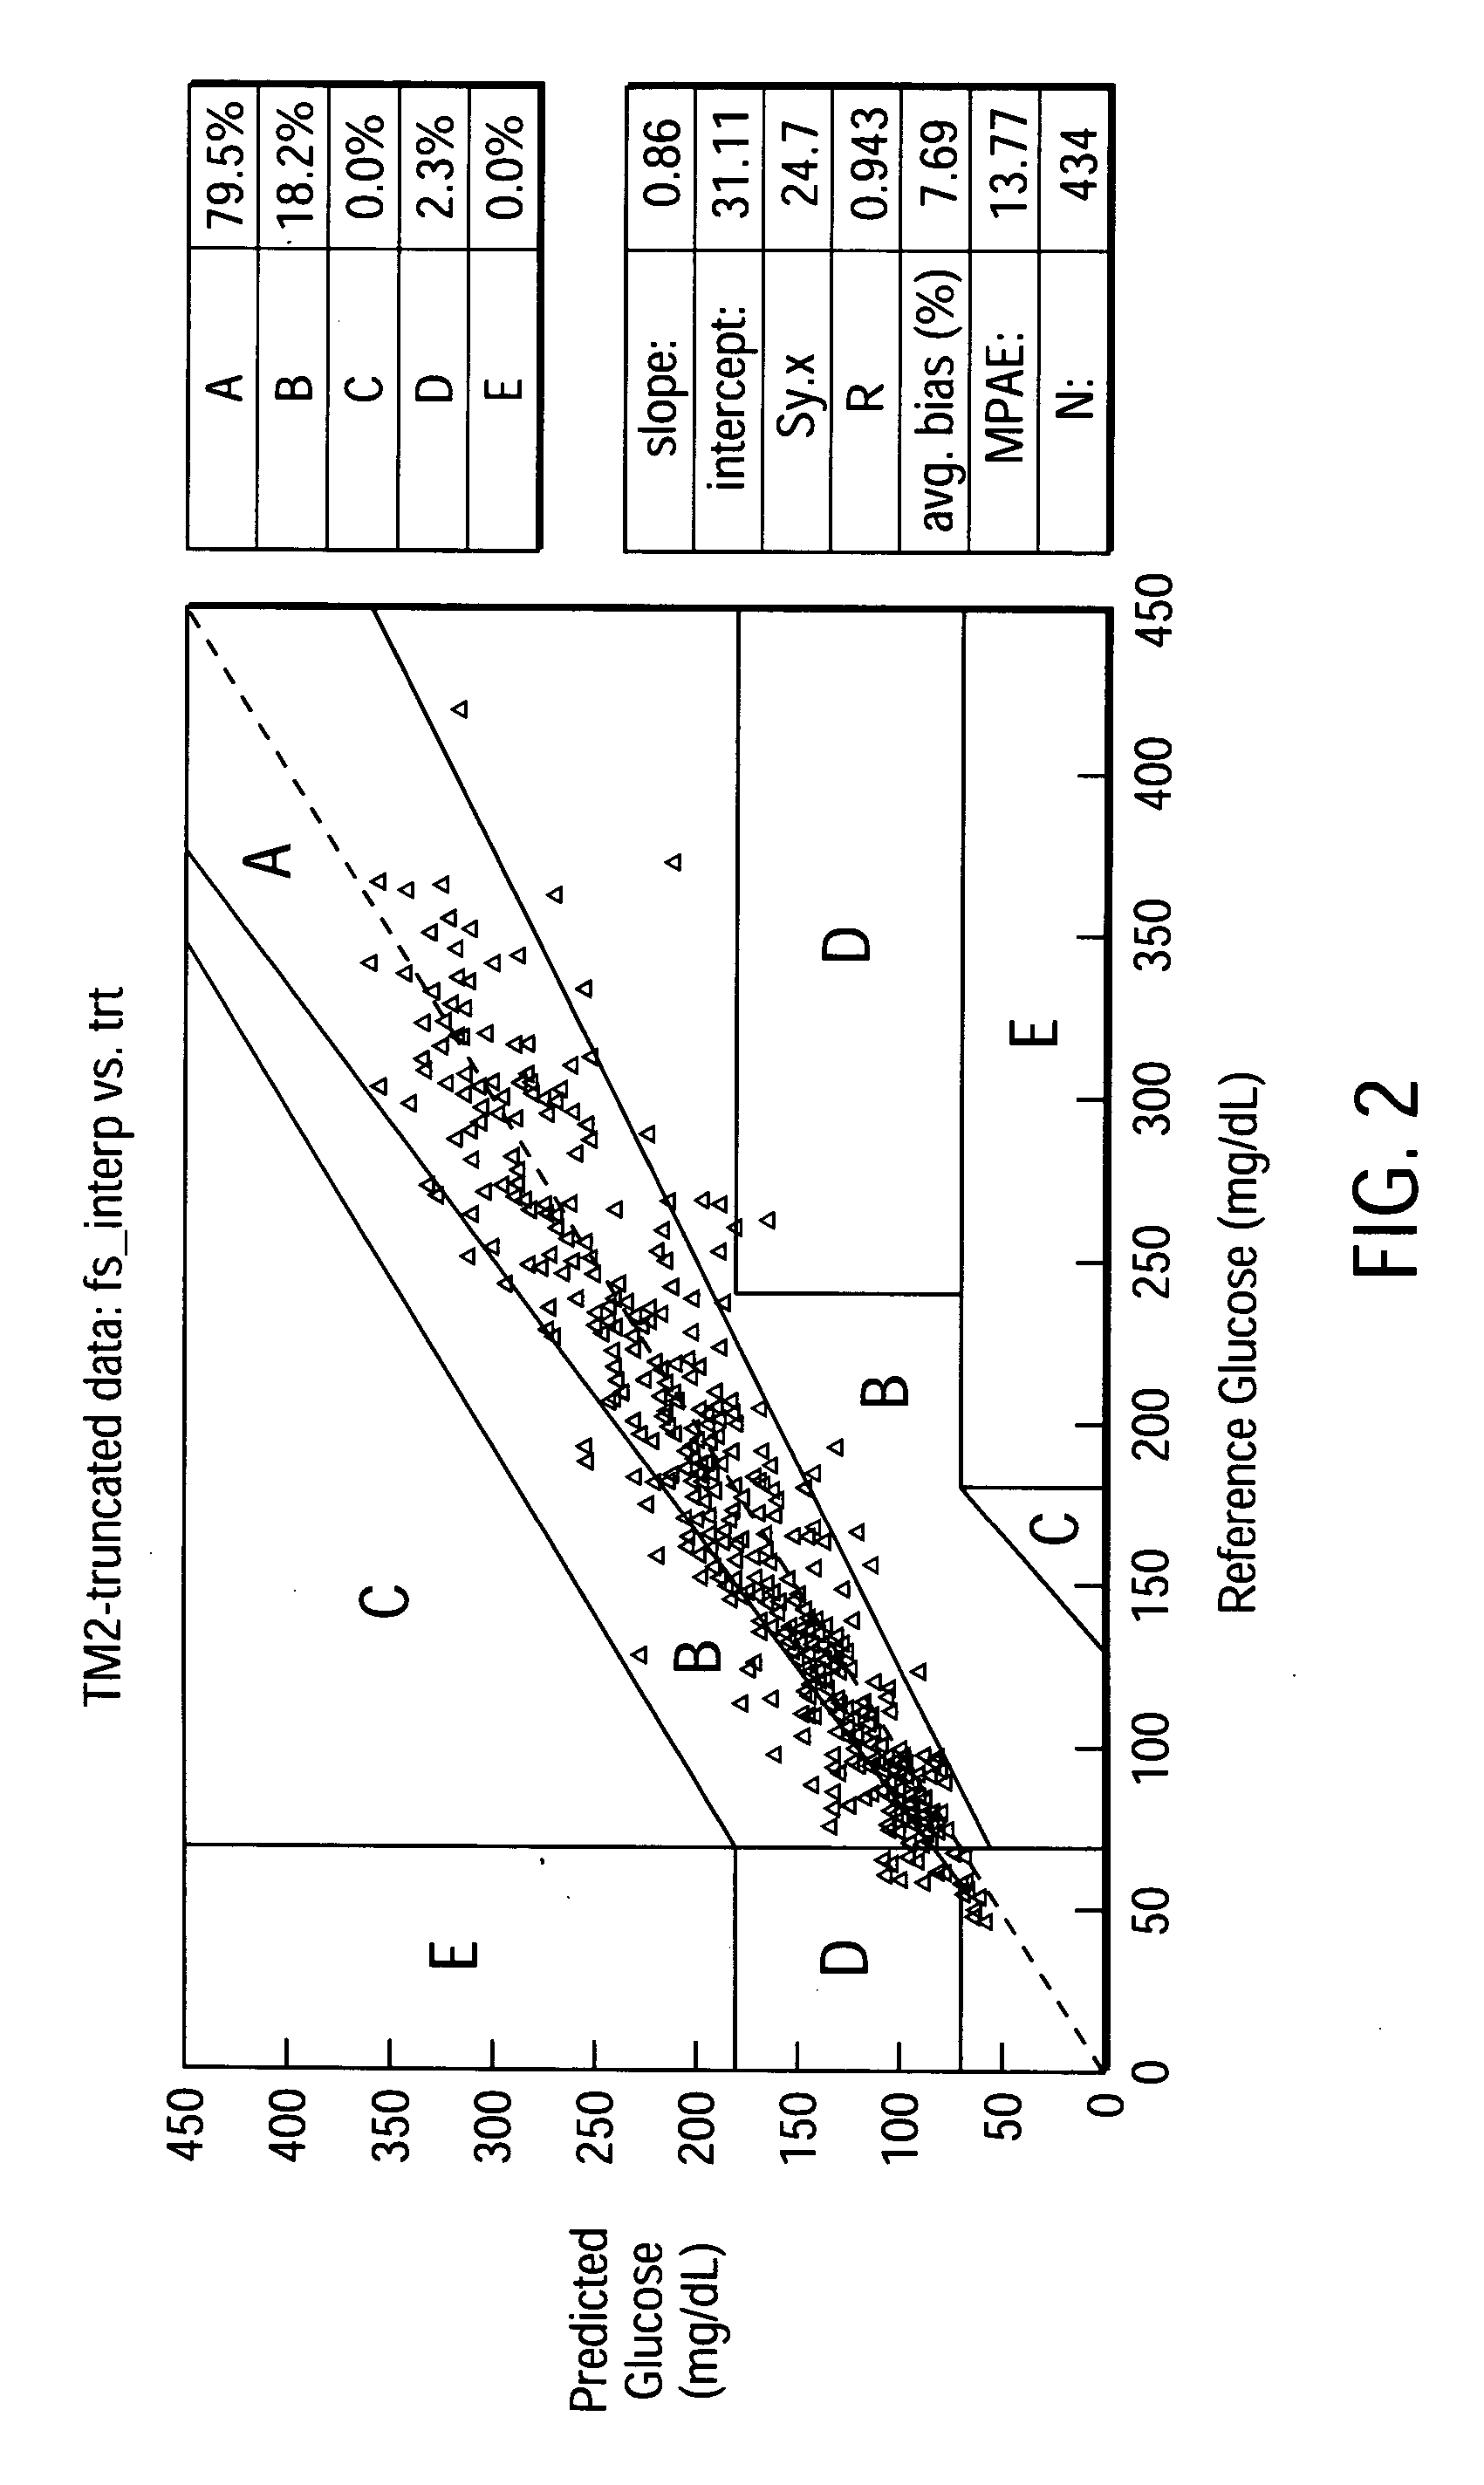
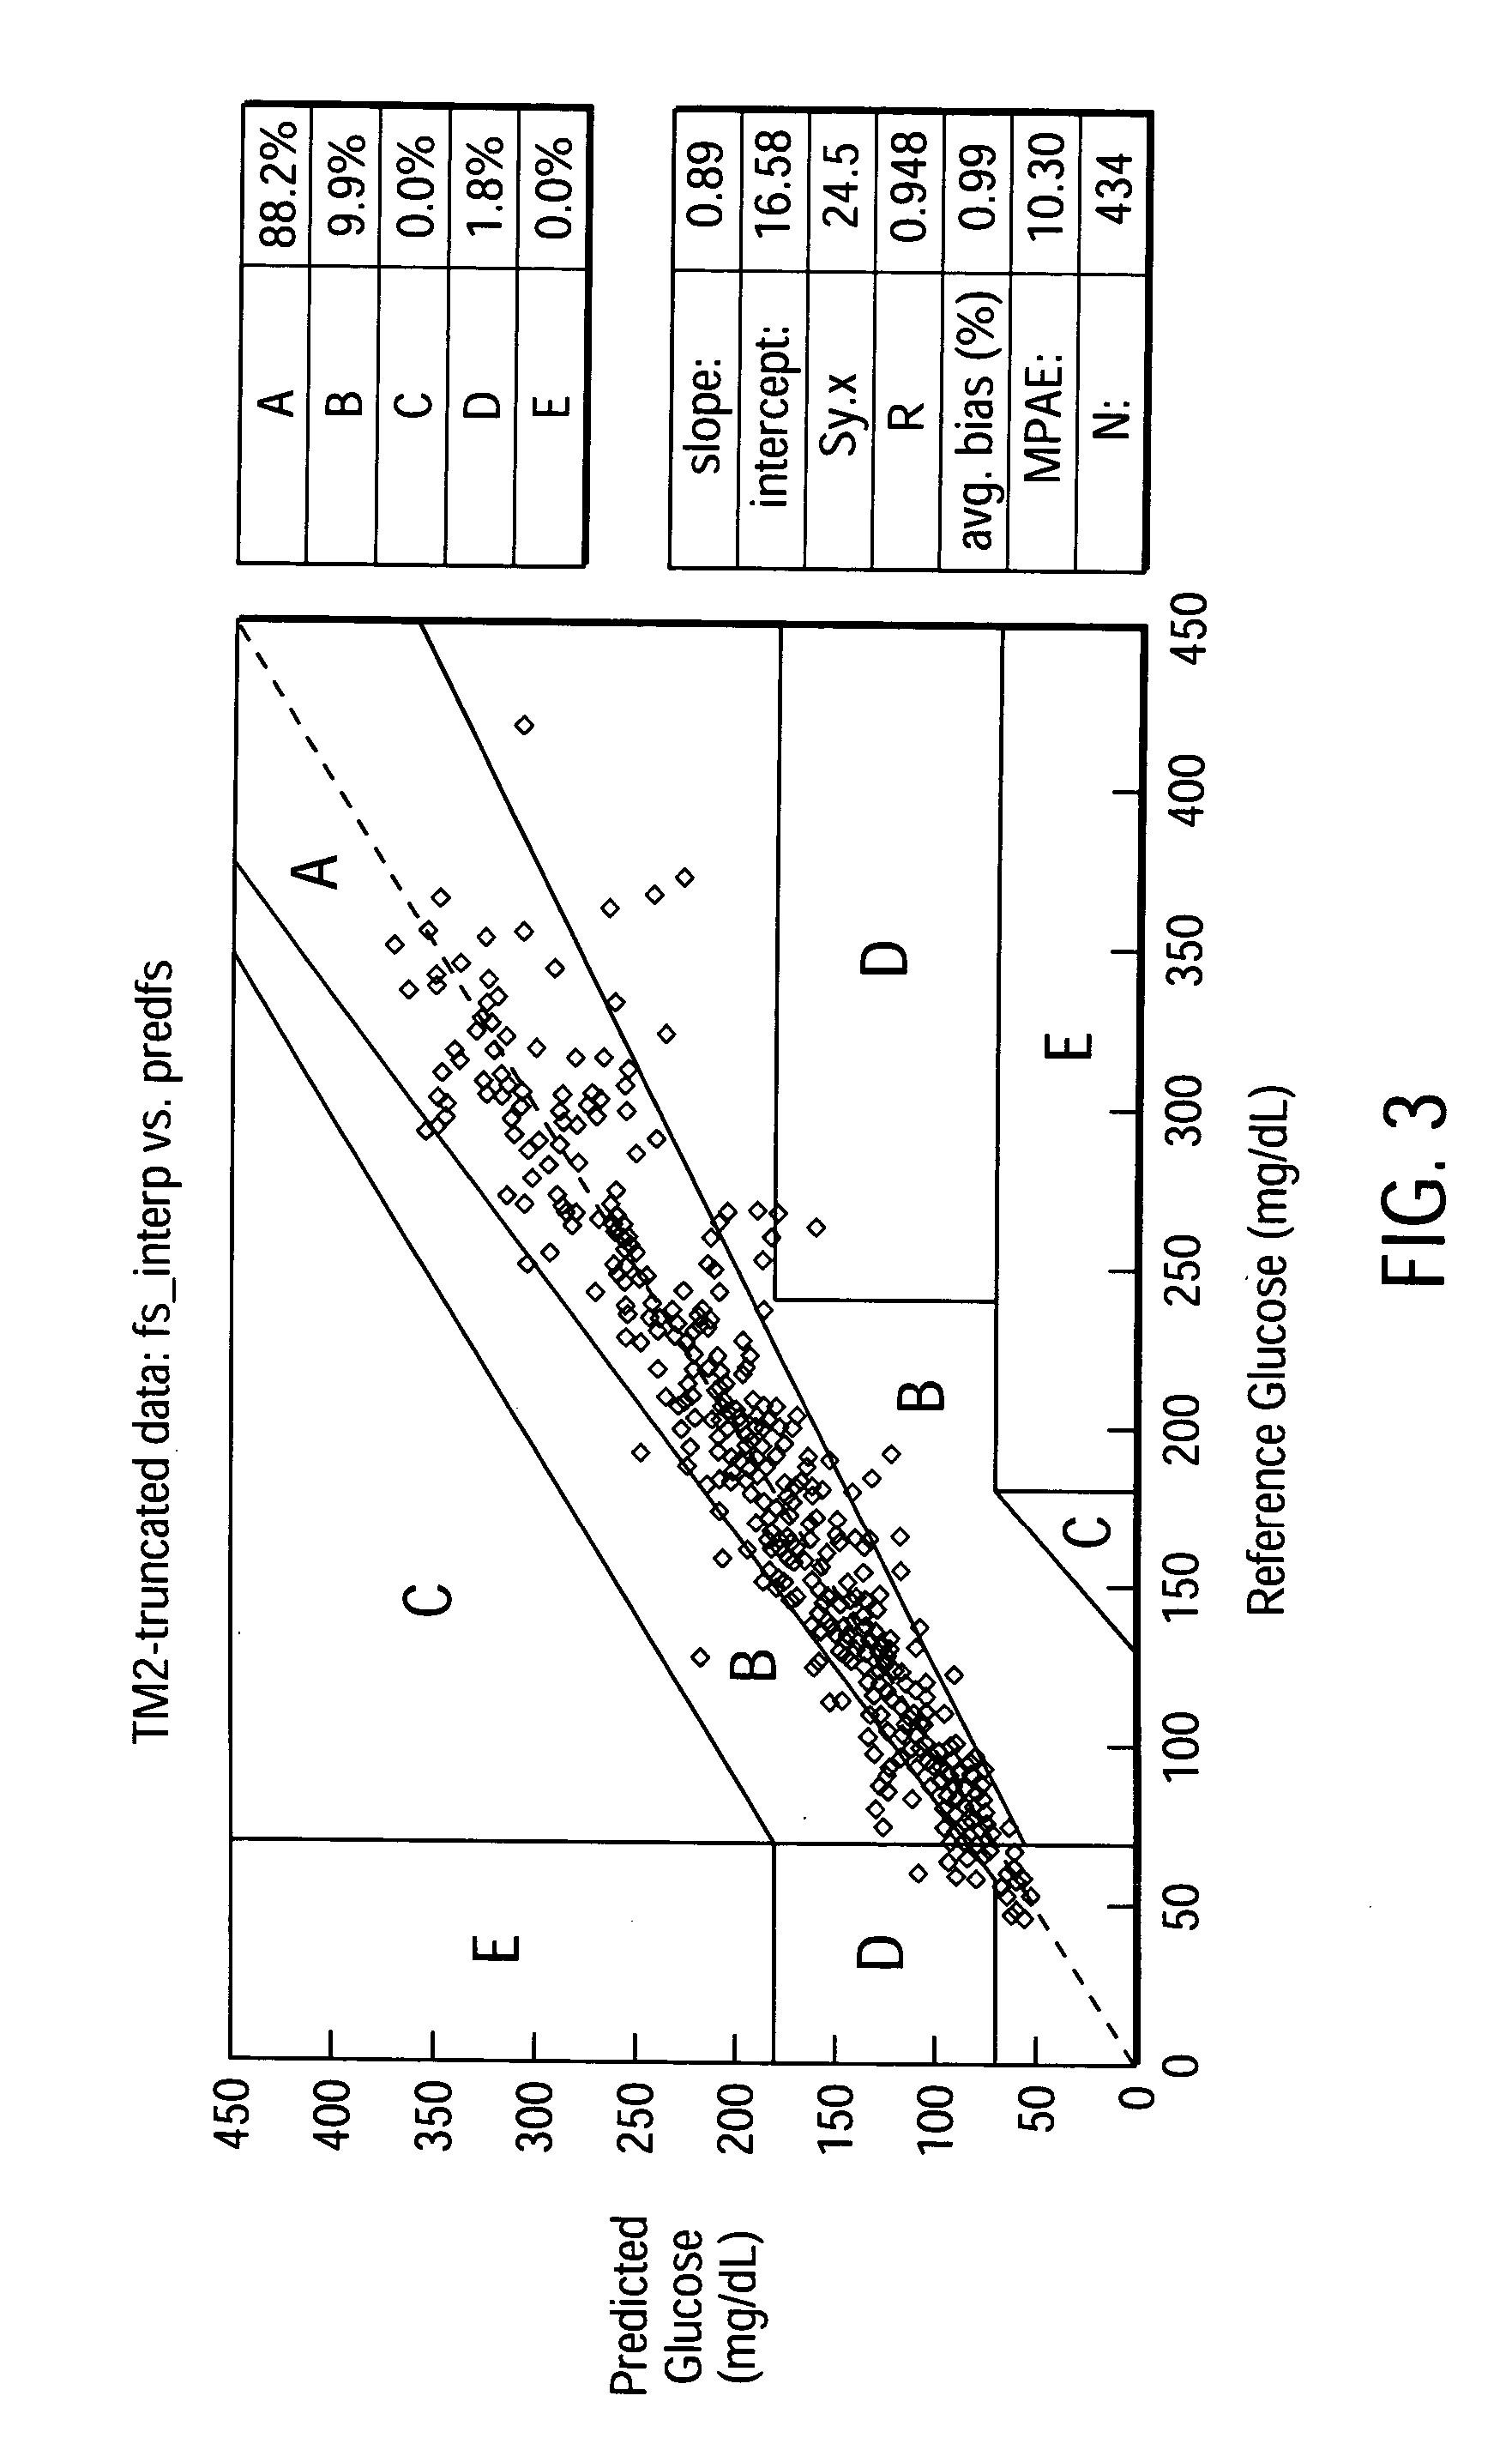
[0068] Predictive Algorithm for a Glucose Analytical Device Utilizing ISF.sub.i.sup.k, rate.sub.j, ma.sub.nrate.sub.m.sup.p, Significant Interaction Terms

[0069] Employing the same data set as in Example 1 above, algorithms employing ISF.sub.i.sup.k, rate.sub.j, ma.sub.nrate.sub.m.sup.p, significant interaction terms were developed as described below. The algorithms employed smoothing variables of the general form ma.sub.nrate.sub.m (discussed above) using two to four point moving averages. Weighting variables were also included to improve the algorithms' ability to accurately predict blood glucose concentration from the series of ISF glucose concentrations. The weighting algorithm used was as follows (in SAS.RTM. code):

2 weight4=ISF**-4; newweight=200; if ma1rate1 0 then newweight=(weight4*(abs(ma1rate1)+1)**2) / (1+rate1); end; if ma1rate1 > 0 and ma3rate1 >= 0 then do; if rate1 >= 0 then newweight=weight4*(1*rate1+1)**2; if rate1 0 then do; if rate1 >= 0 then newweight=(weight4*(1...


PUM


Abstract

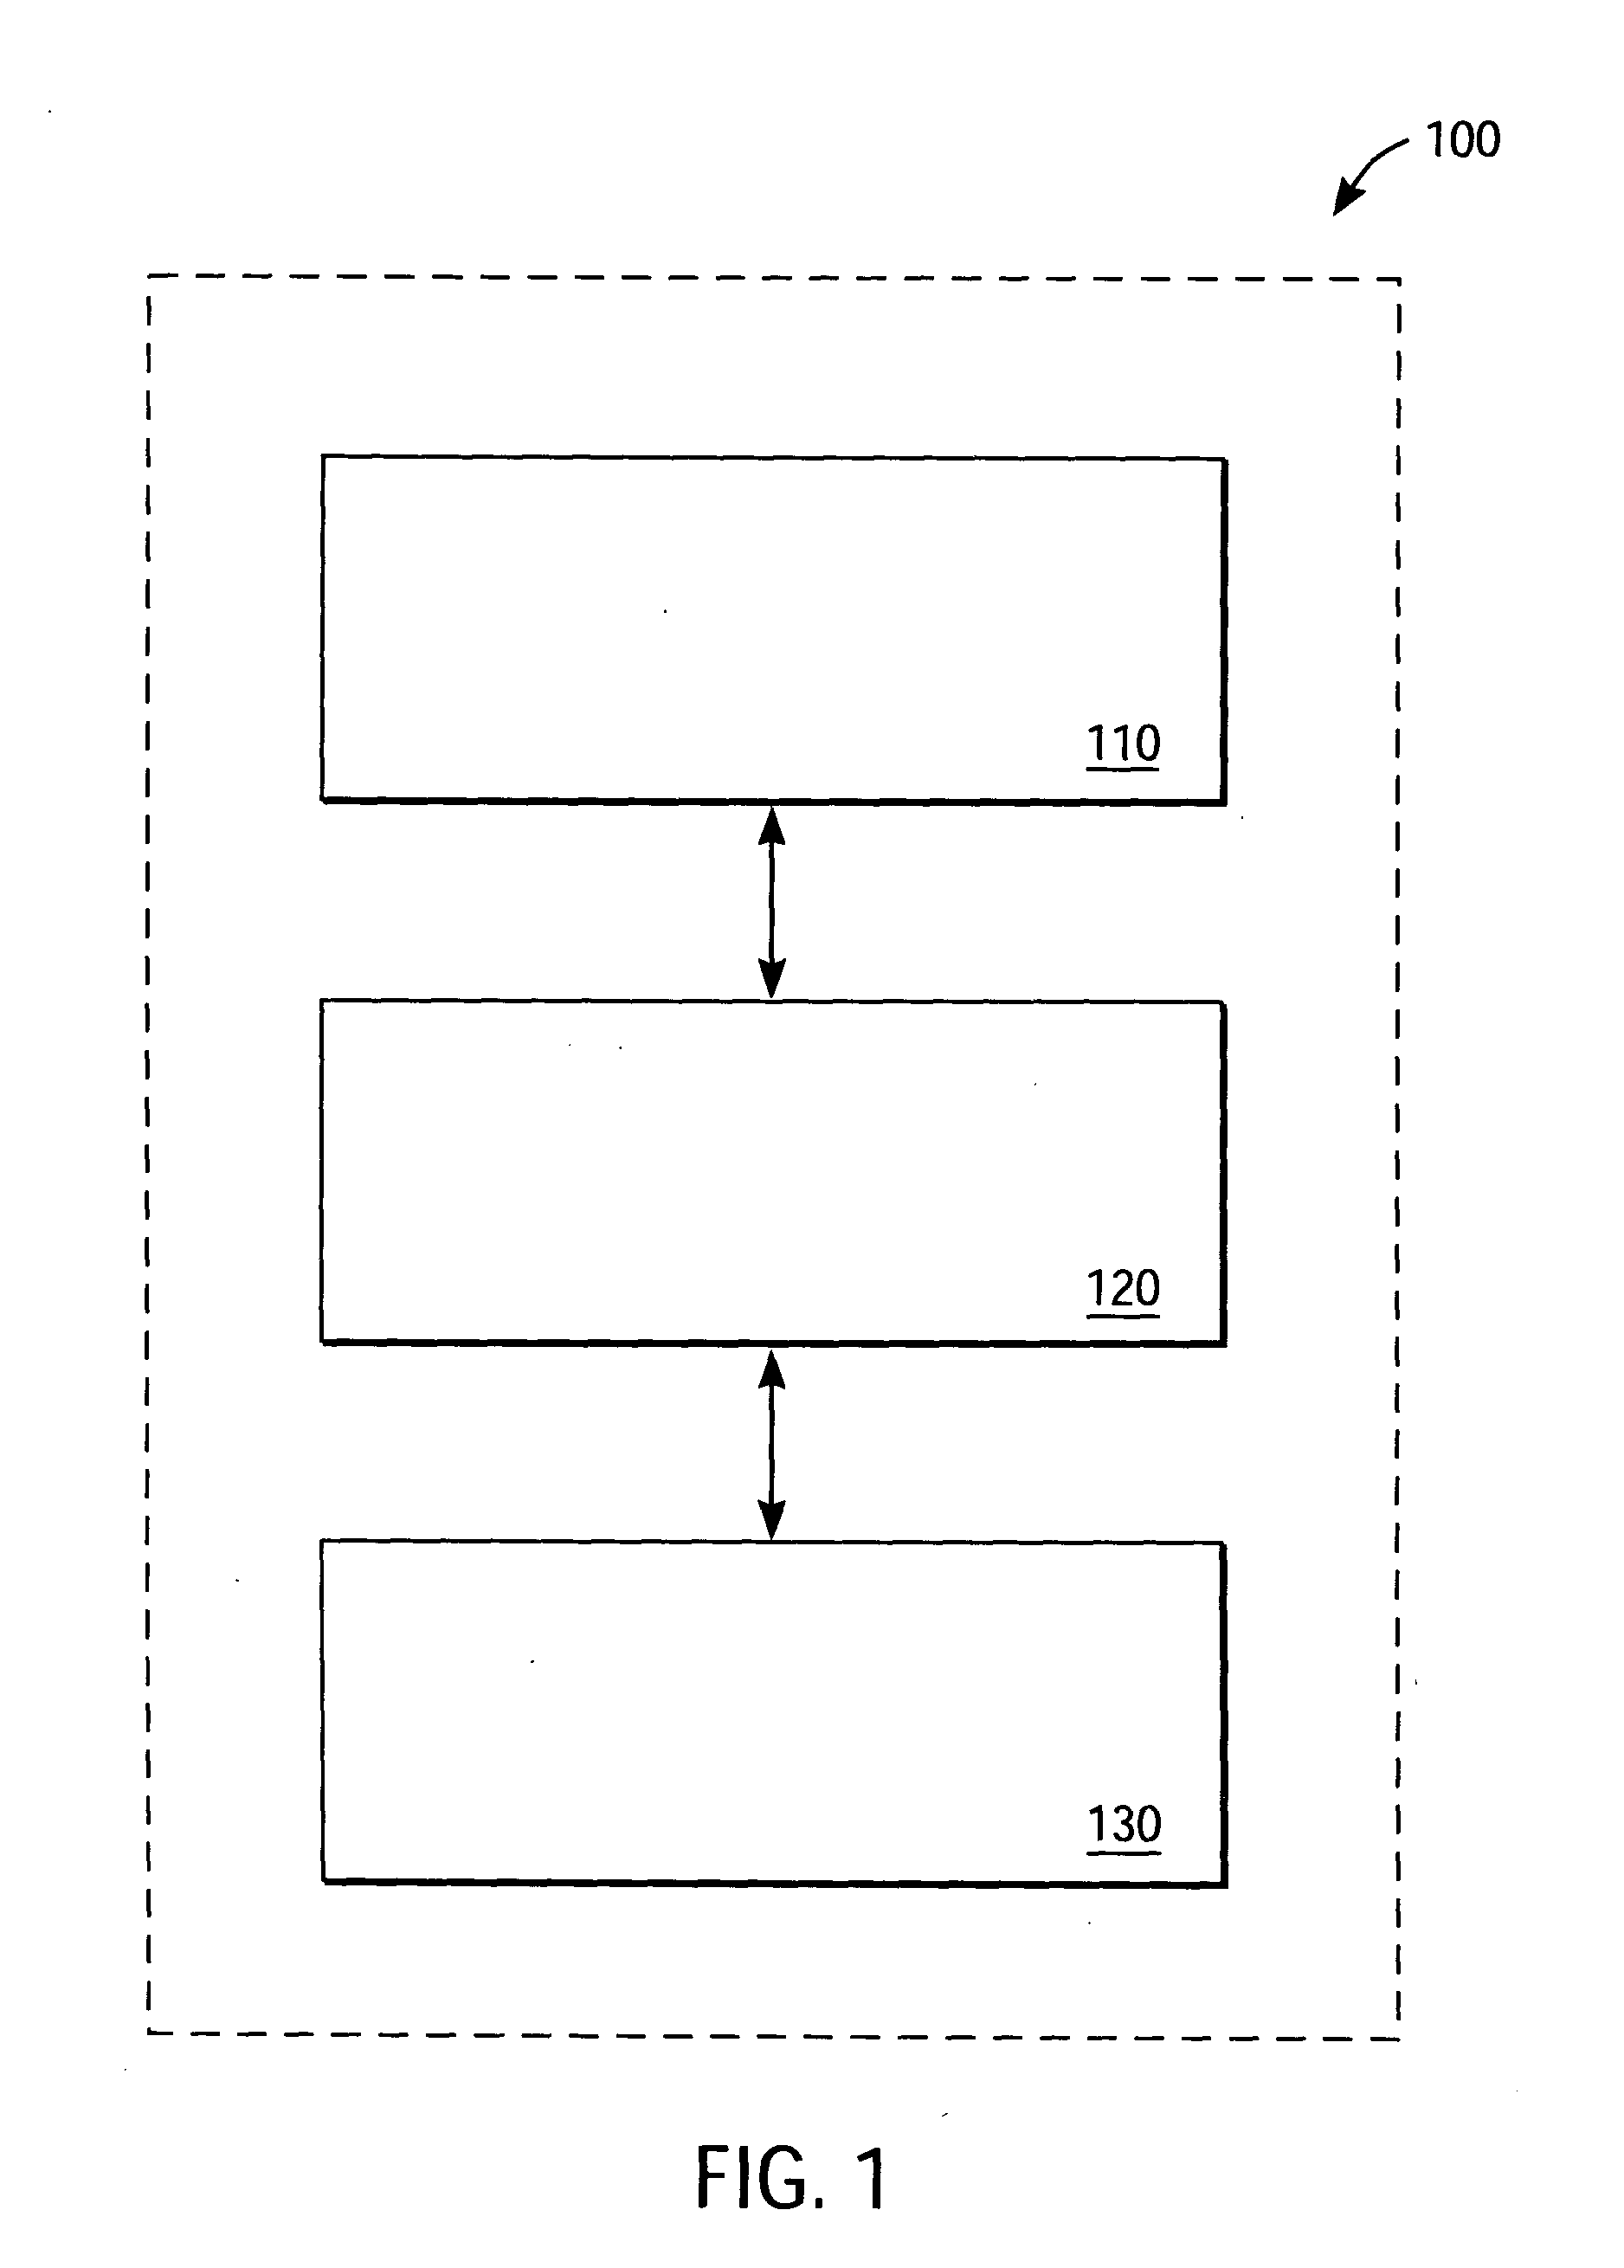
An analytical device for predicting a subject's whole blood analyte concentration based on the subject's interstitial fluid (ISF) analyte concentration includes an ISF sampling module, an analysis module and a prediction module. The ISF sampling module is configured to sequentially extract a plurality of ISF samples from a subject. The analysis module is configured to sequentially determining an ISF analyte concentration (e.g., ISF glucose concentration) in each of the ISF samples, resulting in a series of ISF analyte concentrations. The prediction module is configured for storing the series of ISF analyte concentrations and predicting the subject's whole blood analyte concentration based on the series by performing at least one algorithm. A method for predicting a subject's whole blood analyte concentration based on the subject's interstitial fluid analyte concentration includes extracting a plurality of interstitial fluid (ISF) samples from a subject in a sequential manner and sequentially determining an ISF analyte concentration in each of the plurality of ISF samples to create a series of ISF analyte concentrations. The subject's blood analyte concentration is then predicted based on the series of ISF analyte concentrations by performing at least one algorithm.

Description

BACKGROUND OF INVENTION[0001] 1. Field of the Invention[0002] The present invention relates, in general, to analytical devices and, in particular, to analytical devices and associated methods for predicting a subject's blood analyte concentration from a subject's interstitial fluid (ISF) analyte concentration.[0003] 2. Description of the Related Art[0004] In the field of analyte (e.g., glucose) monitoring, continuous or semi-continuous analytical devices and methods are advantageous in that they provide enhanced insight into analyte concentration trends, a subject's overall analyte control and the effect of food, exercise and / or medication on an analyte's concentration. In practice, however, such analytical devices can have drawbacks. For example, interstitial fluid (ISF) analytical devices can suffer inaccuracies due to, for instance, physiological lag (i.e., the time-dependent difference between a subject's ISF analyte concentration and a subject's blood analyte concentration) and...

Claims


Application Information

Patent Timeline
IPC IPC(8): A61B5/00G01N1/00A61B5/022A61B5/145A61B5/1473A61B5/15G01N1/10G01N33/48G01N33/49
CPCA61B5/0002A61B5/022A61B5/1411A61B5/14532Y10T436/11A61B5/1486A61B5/6824A61B2560/0431A61B2562/0295A61B5/1455A61B5/150022A61B5/150358A61B5/157A61B5/14
Inventor STOUT, PHILMELANDER, TODD
Owner LIFESCAN INC
Learn More