
Computer-implemented impact analysis of energy facilities

a technology of energy facilities and impact analysis, applied in the field of computer-based generation of score values, can solve problems such as inability to represent scores, serious consequences for people and the environment, and inability to meet the needs of users, and achieve only the effect of achieving the effect of achieving representative scores

Active Publication Date: 2020-06-02
INDEPENDENT ENERGY STANDARDS CORP
View PDF0 Cites 20 Cited by
  • Summary
  • Abstract
  • Description
  • Claims
  • Application Information

AI Technical Summary

Benefits of technology

The patent text describes an invention that has certain technical effects. These effects may include improving a certain process or providing a better solution to a certain problem. The patent text may also describe how the invention was developed or how it can be used. Overall, the patent text aims to explain the technical effects of the invention in simple terms for easy understanding by R&D personnel.

Problems solved by technology

However, if these facilities are not constructed, maintained or operated according to recognized practices pertaining to safety, operations and maintenance, accidents or failures can occur with serious consequences to people and the environment.
A lack of industry self-governance is expected to cause government to intrude with new regulations based upon guidelines or metrics with which industry may disagree.
However, condensing a vast number of data fields into a single, representative score is technically challenging and has only been accomplished in a few ways.
This method adds a bit more intelligence to a simple check list and allows the most important elements to carry more weight; however the check list method is inherently limited in several ways.
First, it is inflexible because it explicitly requires specific components without considering the relative exposure.
Exposure,” in this context, refers to the likelihood of occurrence of an incident, such as the risk of a safety violation or apparatus failure resulting in damage to persons, property or environment.
This inflexible approach results in a weak, bare minimum rating, which cannot consider the nuances of different areas or an overly harsh or conservative rating which is not normalized across different exposures.
Second, the method cannot consider the relative importance of combinatorics problems.
Third, this method cannot appropriately account for uncertainty.
If an answer is unknown it must be checked “No.” Users of check lists, like the USGBC, have simply given a 0 for each item which cannot be verified, encouraging their clients to provide information, but this approach can severely limit the usefulness of an assessment and is not practical when uncertainty stems from more than just document availability.
Additionally the best performers are not given recognition for going above and beyond this standard, reducing incentive to do so.
This is a problem that regulatory rule makers face alongside those groups creating standards.
Finally, none of the checklist methods purport to offer an estimate of “expected impact.” They are neither comprehensive nor analytical enough to do so.
In the end, checklists represent a version of reality but are severely limited due to the above shortcomings.
The FICO score algorithm does not solve the four problems listed it above; it avoids the first, third and fourth by leveraging the abundance of data and resulting correlations, and uses a relative weighting scheme to address the second, which is largely sufficient because all the parts are statistically related.
The process measurement approach is challenged by limited data and has a complicated link between process and performance.

Method used


Image

  • Computer-implemented impact analysis of energy facilities
  • Computer-implemented impact analysis of energy facilities
  • Computer-implemented impact analysis of energy facilities

Examples


implementation example

8. Implementation Example

[0211]FIG. 27 illustrates an example objective score in accordance with an embodiment. FIG. 27 depicts a table 2700 comprising a plurality of rows 2702 and columns 2704. Rows 2702 represent stored digital data for different operational risks and columns 2704 store values of impact data associated with each risk. For example, a first row 2706 identifies the operational risk of “Equipment Leaks”, and column values in columns 2704 specify an event profile value of 78, control effects value of 78%, water value of 141, land value of 127, null community value, for a normalized score of 134. Various other operational risks may be stored in the table 2700, such as waste impacts, well collision, well control—drilling, and transportation leaks. Each of these risks has an associated event profile which provides a normalized score. Similarly, each risk has control efforts associated with the risk. The control efforts are represented as a percentage of a maximum possible...


PUM


Abstract

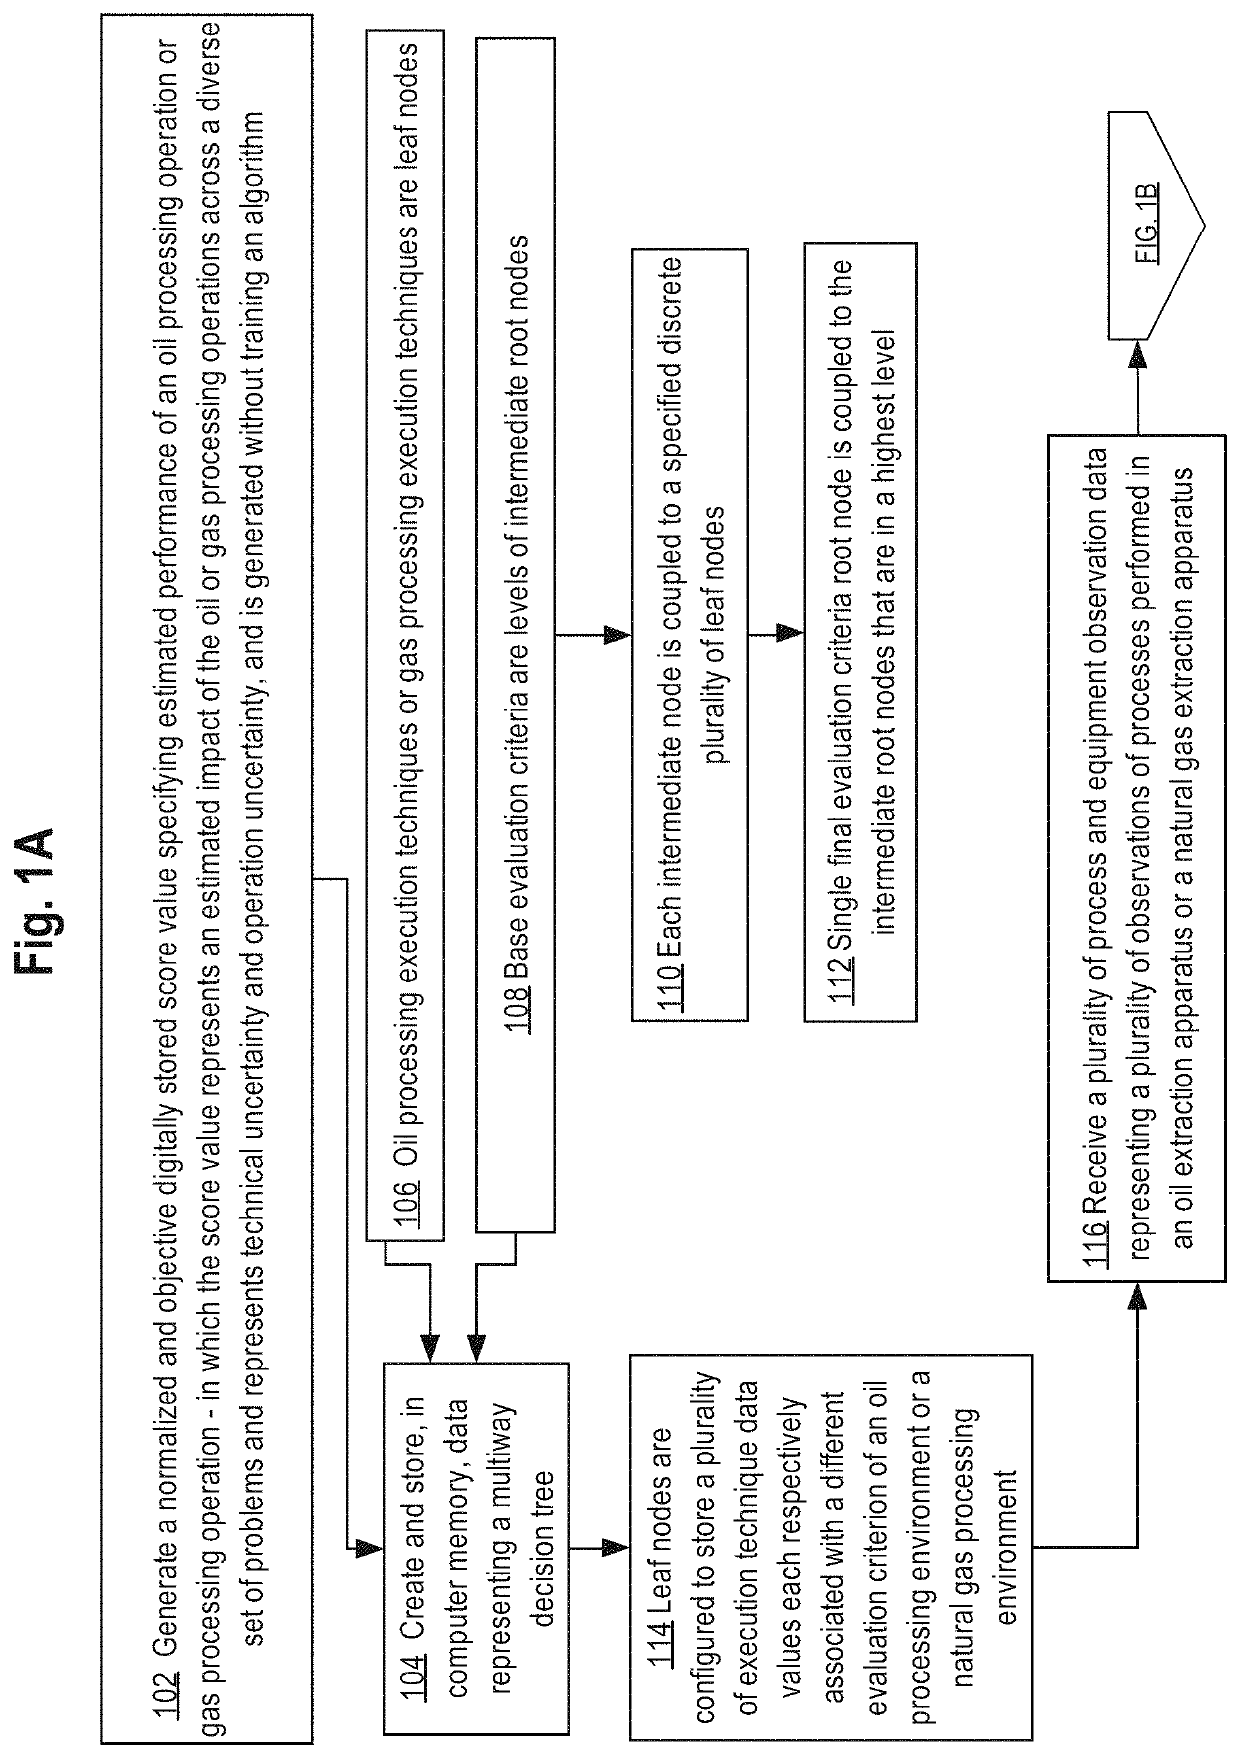
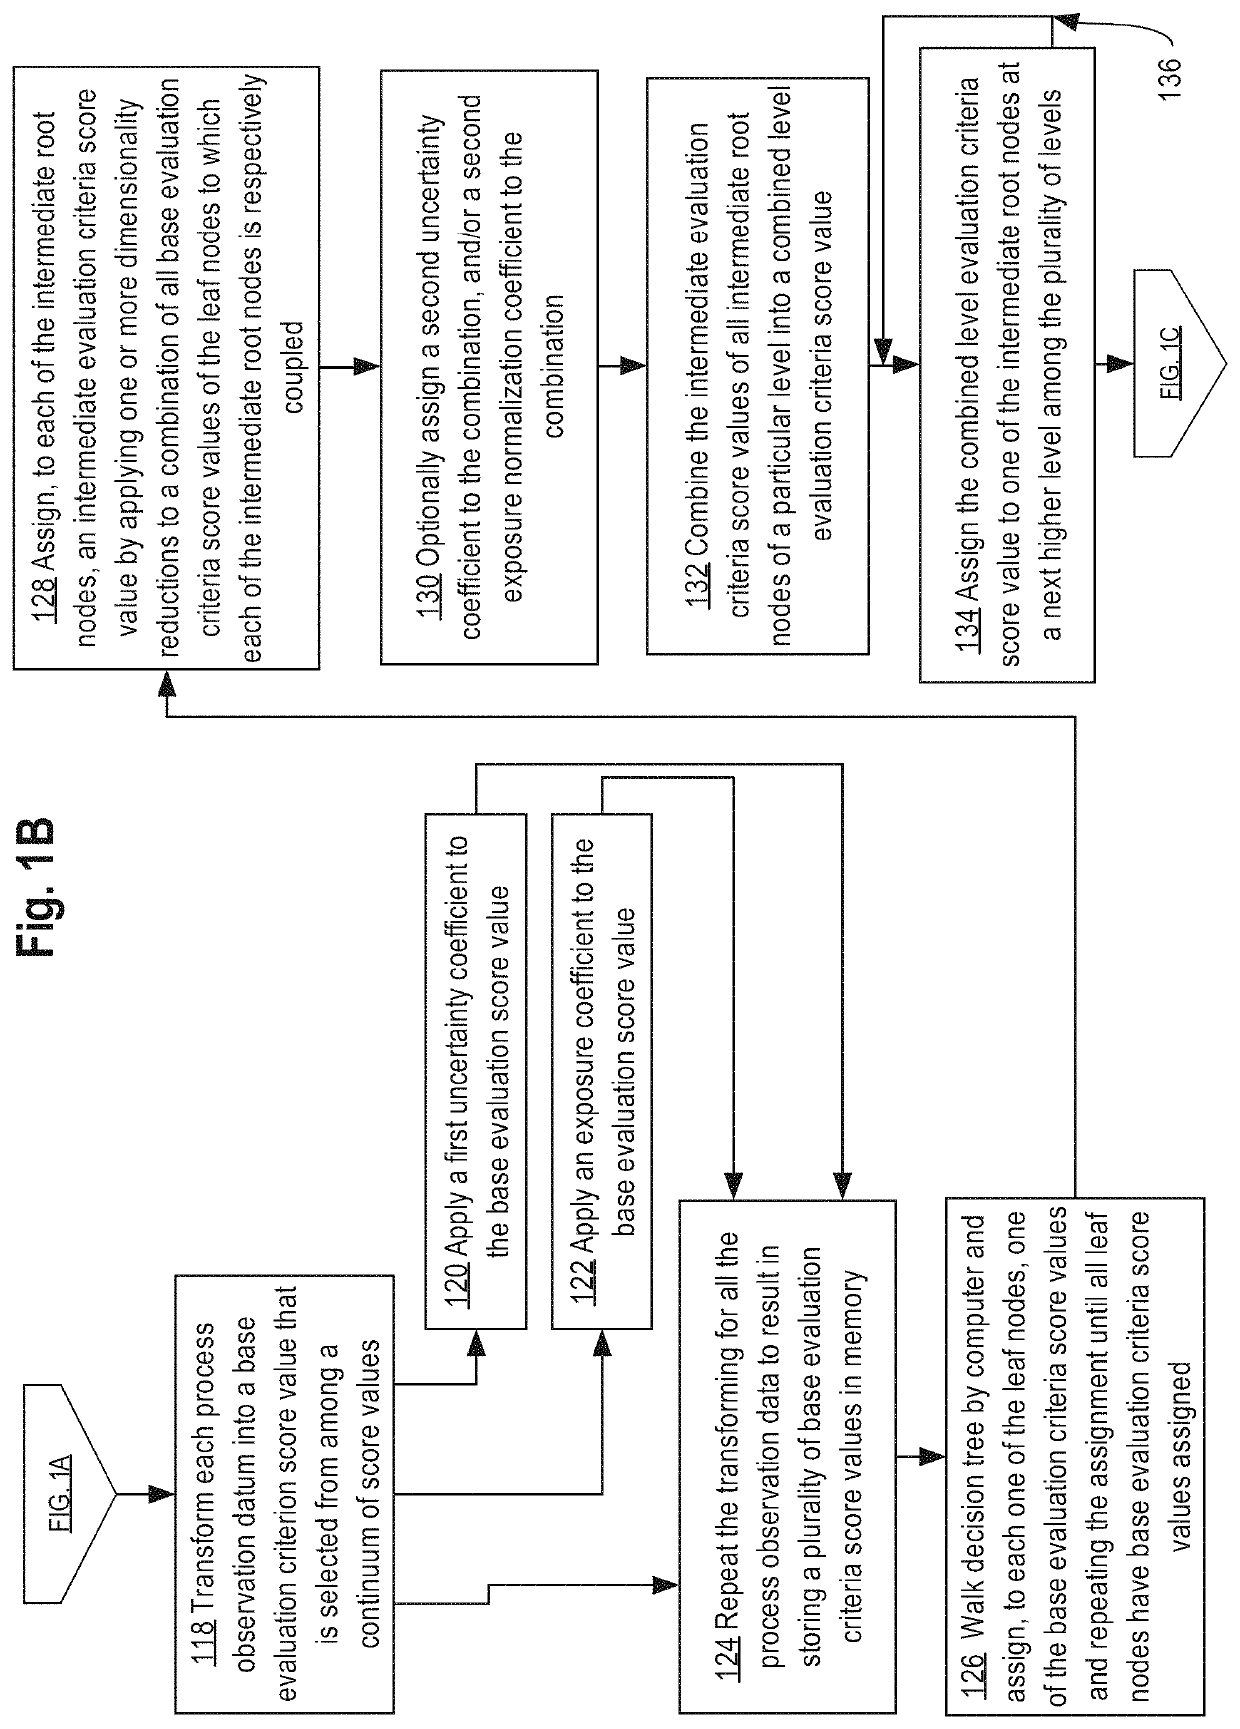
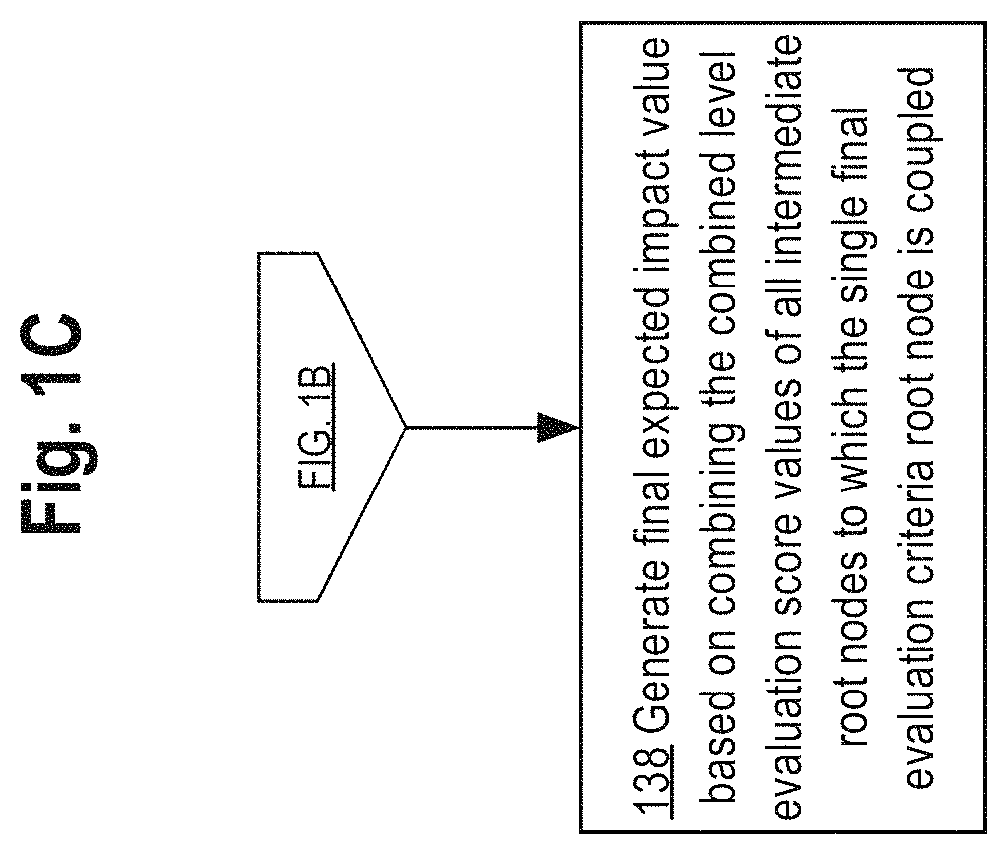
A data processing method for execution using a programmed computer to generate an objective score value specifying an estimated impact of an oil or gas processing operation comprises: receiving a plurality of data associated with the oil or gas processing operation; identifying, using the plurality of data, a plurality of events that may occur during the oil or gas processing operation; for each event of the plurality of events, determining a relative weighting of potential impact of the event for the oil or gas processing operation using local conditions and a master event profile for the event; for each event of the plurality of events, determining an effectiveness of one or more control efforts; for each event of the plurality of events, determining a score using the relative weighting of the potential impact of the event and the effectiveness of the one or more control efforts; determining the objective digitally stored score value for the oil or gas processing operation using the score for each event of the plurality of events and benchmarking the objective digitally stored score value to a plurality of objective digitally stored score values for other oil or gas processing operations.

Description

BENEFIT CLAIM[0001]This application claims the benefit under 35 U.S.C. § 119 of provisional application 62 / 214,715, filed Sep. 4, 2015, the entire contents of which are hereby incorporated by reference for all purposes as if fully set forth herein.FIELD OF THE DISCLOSURE[0002]The present disclosure generally relates to computer-based generation of score values pertaining to industrial facilities. The disclosure relates more specifically to a scoring process that is particularly applied by computer for scoring the conformance of oil facilities or gas facilities to practice guidelines.BACKGROUND[0003]The approaches described in this section are approaches that could be pursued, but not necessarily approaches that have been previously conceived or pursued. Therefore, unless otherwise indicated, it should not be assumed that any of the approaches described in this section qualify as prior art merely by virtue of their inclusion in this section.[0004]Oil and gas facilities, such as wells...

Claims


Application Information

Patent Timeline
Patent Type & Authority Patents(United States)
IPC IPC(8): G06F30/20G06Q50/06G06Q10/06
CPCG06F30/20G06Q10/0639G06Q50/06Y02P90/82
Inventor LUQUIST, DEVINCAULKINS, V, HORACE JAMES
Owner INDEPENDENT ENERGY STANDARDS CORP
Learn More