
Frequency conversion sweep measuring method

A technology of frequency scanning and measurement methods, applied in the direction of measuring devices, spectrum analysis, measuring electrical variables, etc.

Inactive Publication Date: 2004-01-14
ADVANTEST CORP
View PDF1 Cites 6 Cited by
  • Summary
  • Abstract
  • Description
  • Claims
  • Application Information

AI Technical Summary

Problems solved by technology

[0025] However, a correct measurement is possible only if the measured signal input together with the spurious signal generated inside the measuring device, does not appear at the image frequency point during the frequency sweep or as FN5a, FN5c considered in Fig. 5

Method used


Image

  • Frequency conversion sweep measuring method
  • Frequency conversion sweep measuring method
  • Frequency conversion sweep measuring method

Examples


no. 1 approach

[0058] Application of an embodiment of the present invention to a spectrum analyzer will be described. Fig. 7 shows an embodiment of a spectrum analyzer to which the present invention is applied, and parts corresponding to those shown in Fig. 1 are denoted by the same reference symbols as previously used.

[0059] The signal to be measured is passed from the input terminal T1 through a variable attenuator 10 and, if necessary, fed to a mixer 40, wherein the attenuator causes the signal to be measured to be adjusted to within a given level range. It should be noted that there are no pre-selectors operating on the signal being measured. The frequency sweep signal from the sweep oscillator 20 is input to the mixer 40 as a local signal. The mixer 40 may be a harmonic mixer, which frequency mixes the measured signal not only with the fundamental of the sweep signal, but also with its harmonics. Additionally, the sweep signal of sweep oscillator 20 may be frequency multiplexed in ...

no. 2 approach

[0089] An embodiment (second embodiment) of another aspect of the present invention, which should be referred to as a spectrum analyzer, will now be described. The functional structure of the spectrum analyzer is basically similar to that shown in Fig. 7, except that a data separator 80 is inserted on the input side of the image canceller 70, as indicated by the dotted line. An example of the processing procedure of the second embodiment is shown in FIG. 15 .

[0090] Start, get the center frequency f c and frequency range F s To determine the range (S1) of the measured frequency F1 ~ F2, select an intermediate frequency Fi (S2) to determine M, scan the range between the signal scanning frequency F1-Fi or scan the setting of subtracting Fi from it in the frequency range of the side The lower limit value F1 and the frequency F2+Fi or the upper limit value F2 with Fi added to the acquired sided data (S3).

[0091] Scanning between F1-Fi~F2+Fi is called concentrated mode scann...


PUM


Abstract

A preselector is omitted in a spectrum analyzer, for example, which is used to prevent an image signal from being inputted. In addition, an image signal of a signal which is located outside a range of set-up measured frequencies is suppressed as much as possible. For a range of set-up measured frequencies F1~F2, and for each of a plurality of intermediate frequencies Fi, the frequency of the sweep signal is swept over a range F1+Fi~F2+Fi to determine first measured data, and is also swept over a range F1-Fi~F2-Fi to determine second measured data. The first and the second measured data are compared against each other for each measured frequency point, and if they are equal, the data value obtained or a data value having a minimum value unless they are not of an equal value is delivered to obtain measured data in which image data based on image signals has been suppressed.

Description

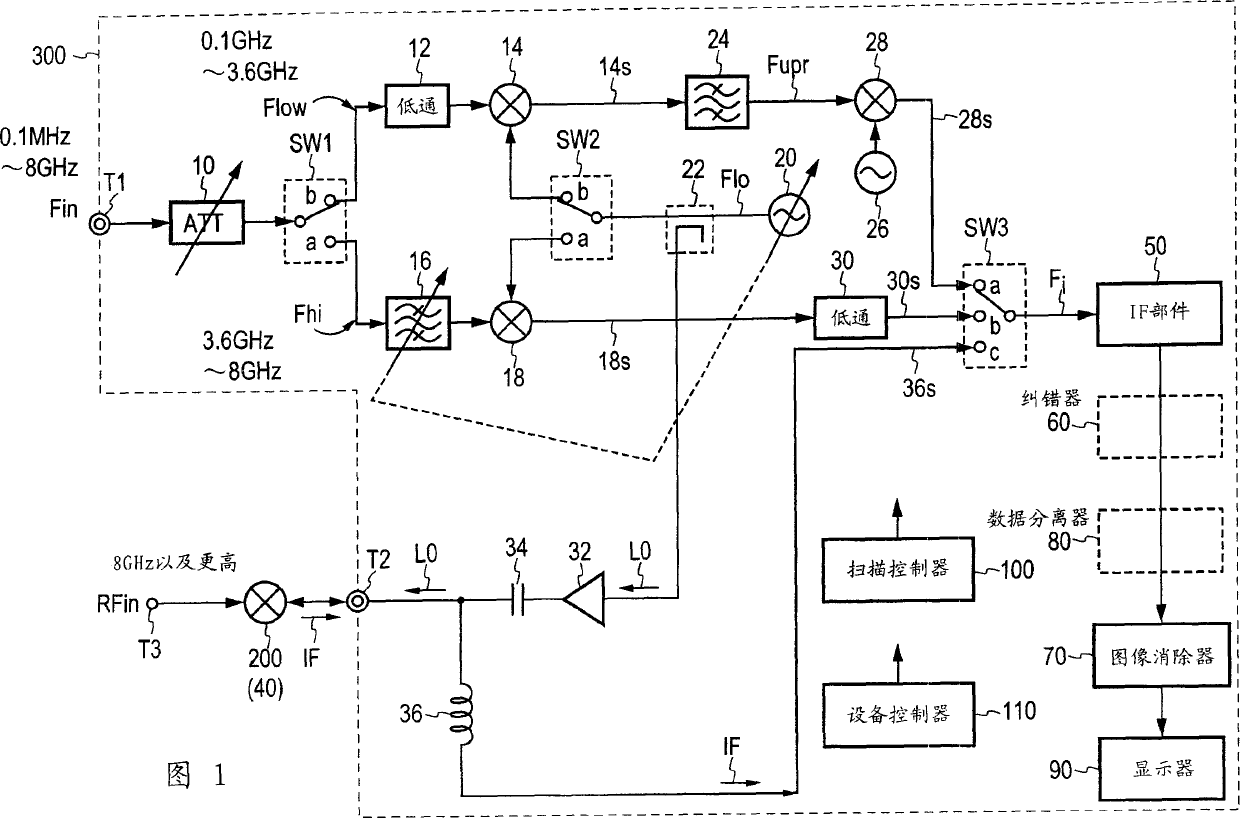
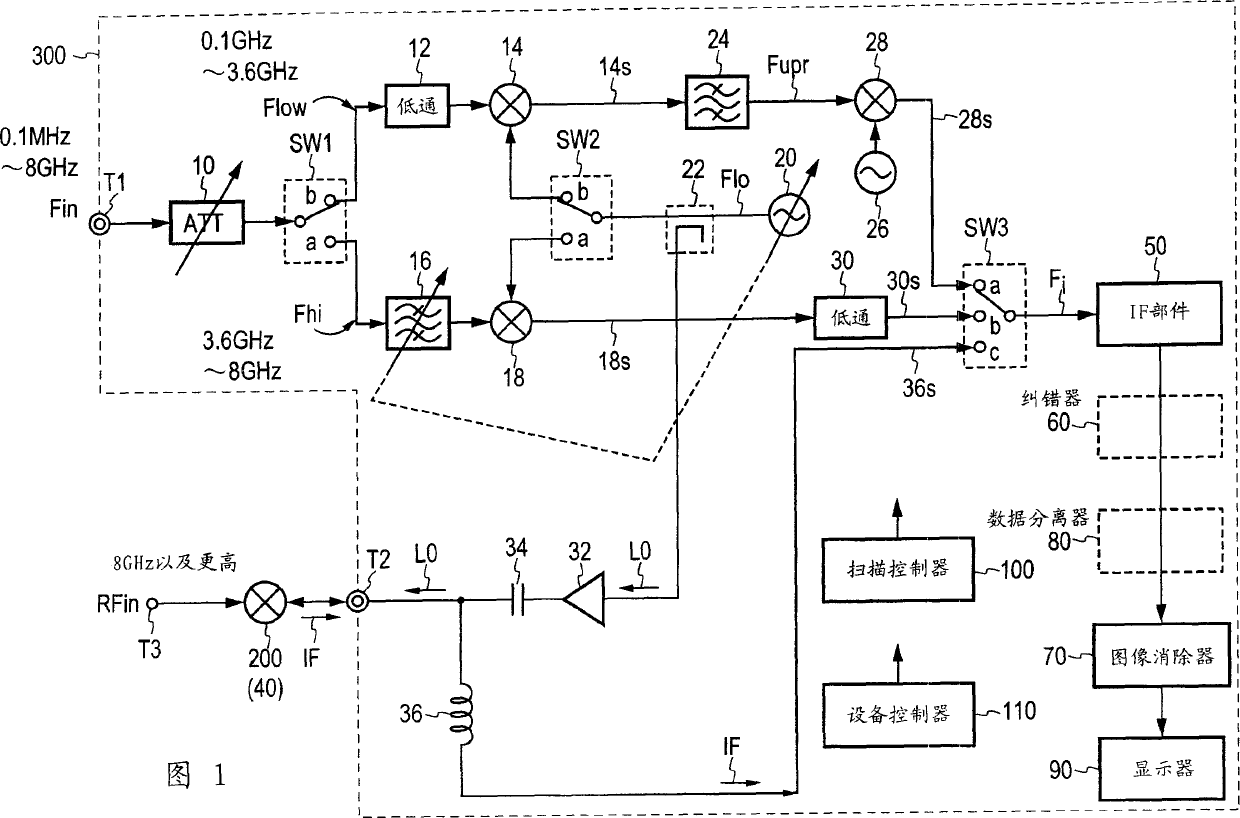
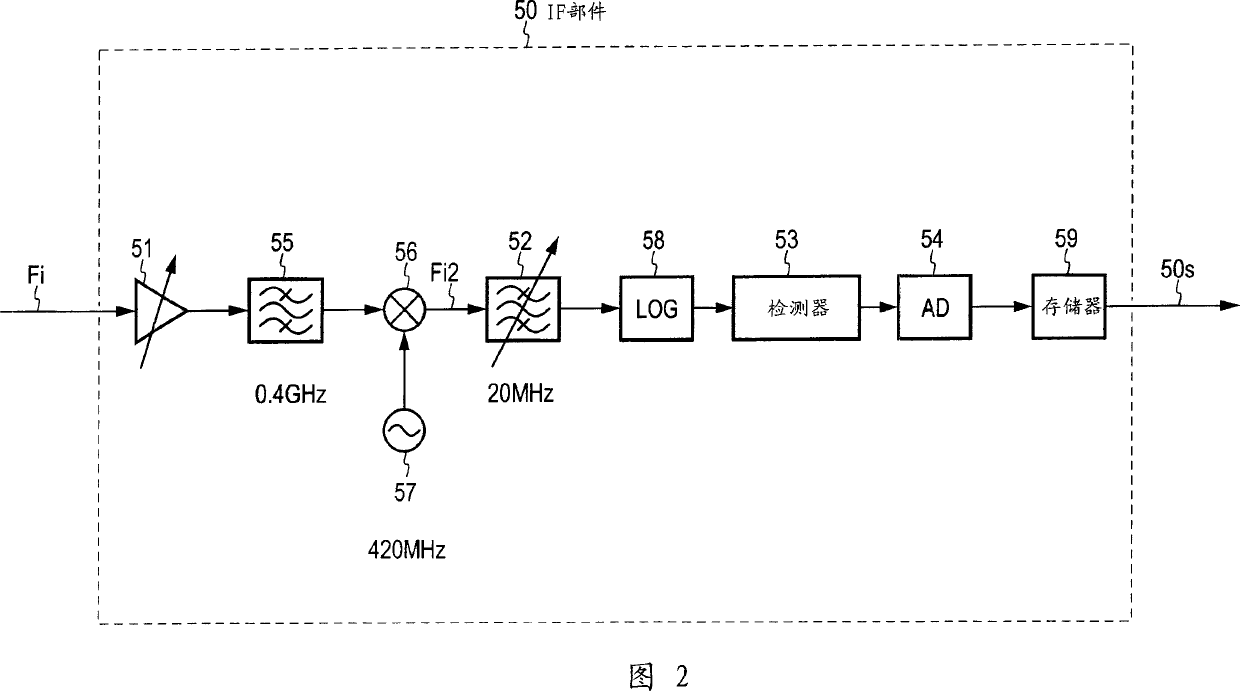
technical field [0001] The invention relates to a measurement method for a device such as a spectrum analyzer, a spurious signal measurement unit or the like comprising a mixer, wherein for measurement purposes the signal to be measured is converted into an intermediate frequency signal with a frequency sweep signal, or to A method of measurement by scanning frequency conversion, in particular to a method of image response (image signal) suppression. Background technique [0002] For the sake of illustration, the prior art of this type of frequency-sweeping measurement unit will be described below with reference to a spectrum analyzer as an example. [0003] FIG. 1 shows the principle and structure of a conventional spectrum analyzer, and FIG. 2 shows a specific example of the structure of the IF section 50 shown in FIG. 1 . [0004] The spectrum analyzer shown in Figure 1 includes three frequency converter channels, which divide the frequency range...

Claims


Application Information

Patent Timeline
Patent Type & Authority Applications(China)
IPC IPC(8): G01R23/173
CPCG01R23/173
Inventor 宫内康司
Owner ADVANTEST CORP
Learn More