
Analysis method for actually measured pressure data in hydraulic transient process

A technology of transient process and actual pressure measurement, applied in the electric power field, can solve problems such as reducing safety risks, inversion calculation uncertainty, and inability to calculate accurately, achieving high accuracy and accurate and reliable processing results

Active Publication Date: 2022-06-24
DONGFANG ELECTRIC MACHINERY
View PDF4 Cites 0 Cited by
  • Summary
  • Abstract
  • Description
  • Claims
  • Application Information

AI Technical Summary

Problems solved by technology

[0009] In this comparison file, the wavelet analysis method is used to decompose the measured hydrodynamic pressure signal during the transition process of the load shedding test of the pumped storage unit to obtain the measured average pressure and fluctuating pressure. Combined with the calculation of the one-dimensional transient flow transition process, the load shedding inversion calculation is carried out step by step It can better solve the technical problem that the random pressure fluctuation cannot be accurately calculated, and the prediction accuracy is high, which greatly reduces the safety risk of the load shedding test of one tube and multiple machines in the pumped storage power station, but this method focuses on extracting the average value of the data Scholars use the original measured data to subtract the mean data after the noise reduction processing is the pulsation data, focusing on the noise reduction processing of the mean pressure. different, the average pressure obtained is different, and the pulsation data obtained by processing is also quite different, which has great uncertainty for the inversion calculation of the transition process

Method used


Image

  • Analysis method for actually measured pressure data in hydraulic transient process
  • Analysis method for actually measured pressure data in hydraulic transient process
  • Analysis method for actually measured pressure data in hydraulic transient process

Examples


Embodiment approach

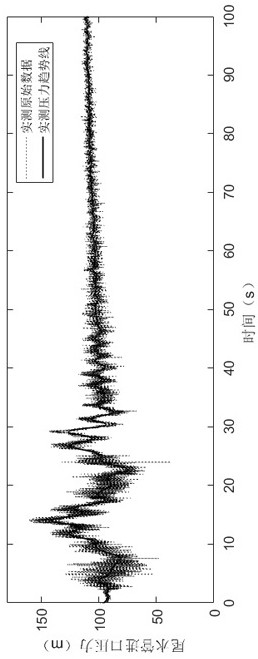
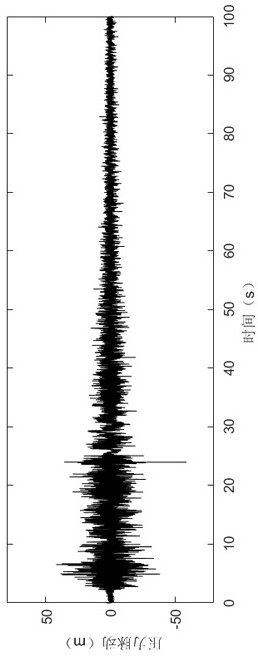
[0050] As a preferred embodiment of the present invention, the present embodiment discloses a method for analyzing measured pressure data in a hydraulic transient process, including the following steps:

[0051] S1. Extract the data mean value from the measured data through noise reduction, and obtain instantaneous pressure fluctuation data by making a difference between the data mean value and the measured data;

[0052] S2. The obtained pressure fluctuation data is divided into time-domain grid distribution by grid division method, and in the time domain of all test data, it is divided into multiple time grid regions according to time intervals;

[0053] S3. Use the empirical cumulative distribution function to analyze the pressure fluctuation data in each time grid area in turn, obtain the probability distribution of each data, perform confidence probability processing, retain the data whose probability distribution is within the confidence probability range, and combine eac...

Embodiment 2

[0057] As another preferred embodiment of the present invention, refer to the appendix of the description Figure 1-6 , provides a hydraulic transient process measured pressure data analysis method, including the following steps:

[0058] S1. Extract the average pressure from the measured data through smoothing filtering, and make the difference between the average pressure and the measured data to obtain instantaneous pressure fluctuation data;

[0059] S2. Use the grid division method to divide the obtained pressure fluctuation data into time-domain grid distribution. In the time domain of all the test data, it is divided into multiple time-grid areas according to time intervals, and the time-grid areas are set to overlap calculation time, the overlap calculation time is considered according to the data overlap rate, and the data overlap degree is expressed in percentage. Generally speaking, the higher the overlap degree, the higher the accuracy of data processing;

[0060]...

Embodiment 3

[0065] As another preferred embodiment of the present invention, a method for analyzing measured pressure data in a hydraulic transient process is provided, comprising the following steps:

[0066] S1. Extract the average pressure from the measured data through smoothing filtering, and make the difference between the average pressure and the measured data to obtain instantaneous pressure fluctuation data;

[0067] S2. The obtained pressure fluctuation data is divided into time-domain grid distribution by grid division method, and in the time domain of all test data, it is divided into multiple time grid regions according to time intervals;

[0068] S3. Analyze the pressure fluctuation data in each time grid area in turn using the empirical cumulative distribution function inferred from the samples of multiple samples to obtain the probability distribution of each data, and exclude the probability distribution lower than 3% and higher than 97% of the data, retain the data with ...


PUM


Abstract

The invention discloses a method for analyzing actually measured pressure data in a hydraulic transient process, which relates to the field of electric power and comprises the following steps of: extracting mean pressure to obtain instantaneously changed pressure fluctuation data; performing time-domain grid distribution division on the obtained pressure fluctuation data to divide the pressure fluctuation data into a plurality of time grid regions, analyzing the pressure fluctuation data in each time grid region by using an empirical cumulative distribution function to obtain probability distribution of each data, performing confidence probability processing, and combining processed data groups of each time grid region to obtain the probability distribution of each data; obtaining processed pressure fluctuation data; the average pressure is added back to the processed pressure fluctuation data, and the total pressure data subjected to confidence probability processing in the whole time domain are obtained.According to the method, the test actual measurement extreme value result and the transition process pressure change process can be well evaluated, the draft tube pressure fluctuation process can be well analyzed and evaluated, safe and stable operation of a unit is ensured, and the reliability of the draft tube is improved. And a solid technical guarantee is provided for safe and stable operation of a power station.

Description

technical field [0001] The invention relates to the field of electric power, in particular to a method for analyzing measured pressure data in a hydraulic transient process. Background technique [0002] A large number of operating practices have shown that accidents in hydropower stations often occur during the transition process of hydraulic units. During this process, due to the dramatic changes in unit pressure and rotational speed, it may cause accidents such as rupture of pressure pipes, overflow of surge chambers and damage to unit components. serious security issues. Therefore, before the hydropower station performs the transition process, it is necessary to carry out the numerical simulation calculation of the transition process to evaluate the safety of the unit transition process. However, the current numerical simulation calculation can only calculate the average pressure value in the transition process of the unit, and cannot accurately simulate the fluctuation...

Claims


Application Information

Patent Timeline
Patent Type & Authority Applications(China)
IPC IPC(8): G06F30/20G06K9/00G06Q50/06G06F119/14
CPCG06F30/20G06Q50/06G06F2119/14G06F2218/04
Inventor 凡家异马艳梅梁权伟曾明富张建荀洪运陈太平宋敏胡江艺邓斗波王伦其周顺马安婷
Owner DONGFANG ELECTRIC MACHINERY
Learn More