
Android mobile phone user abnormal use behavior analysis and visualization method

A mobile phone user and behavior technology, applied in other database browsing/visualization, branch office equipment, special data processing applications, etc., can solve the problems of complex operation process, low efficiency, and analysis results that cannot show abnormal user behavior, etc., to achieve operational Simple, clear logical effect

Active Publication Date: 2021-11-26
XLY SALVATIONDATA TECHNOLOGY INC
View PDF6 Cites 0 Cited by
  • Summary
  • Abstract
  • Description
  • Claims
  • Application Information

AI Technical Summary

Problems solved by technology

[0006]1. It is not efficient to copy all the data in the Android phone;
[0007]2. The analysis results cannot show the abnormal behavior of users;
[0008]3. The operation process is complicated and requires the cooperation of professional personnel to complete the evidence collection work
[0009] To sum up, in the field of electronic forensics, there is no method for analysis and visualization of abnormal behavior of Android mobile phones that is easy to operate, high in evidence collection efficiency, and good in display effect

Method used


Image

  • Android mobile phone user abnormal use behavior analysis and visualization method
  • Android mobile phone user abnormal use behavior analysis and visualization method
  • Android mobile phone user abnormal use behavior analysis and visualization method

Examples


Embodiment Construction

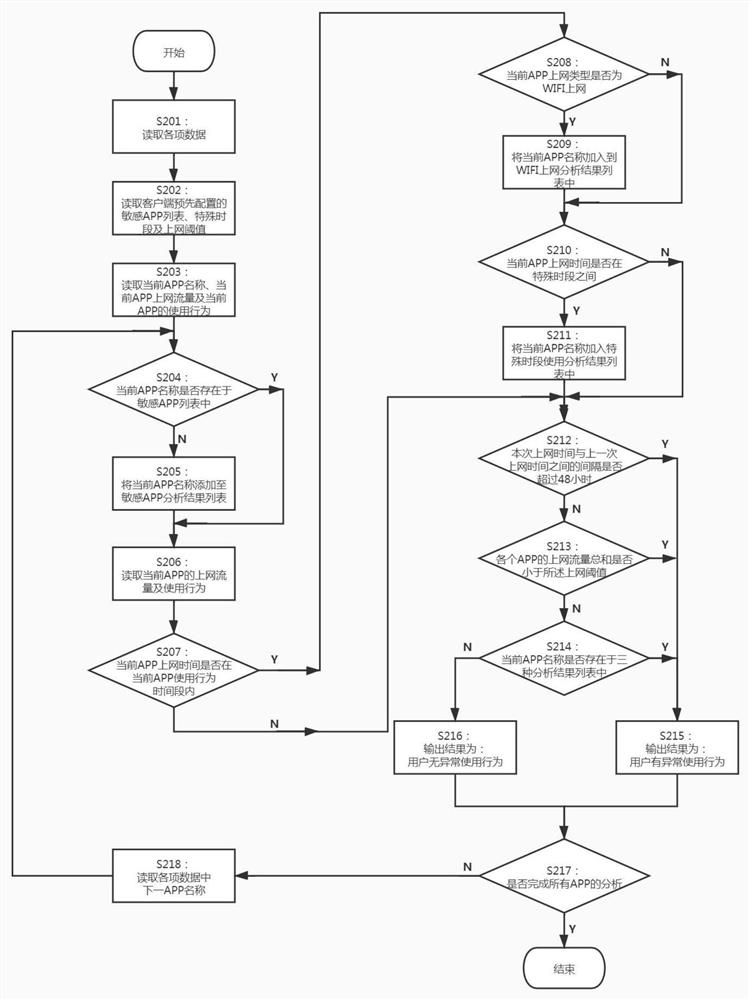
[0061] figure 1 A general flow chart of the method provided by the present invention is shown. like figure 1 As shown, the method of the present invention comprises the following steps:

[0062] S100: Extracting data: including acquiring an application package, extracting data, and uploading it to the client. There is an application package of this type in the prior art, which is used to extract various data in the Android mobile phone; step S100 includes the following steps:

[0063] S101: Build a download environment for the application package: the client builds a Web server, stores the application package in the server, and provides a download QR code;

[0064] S102: Download the application package on the mobile phone: Open the browser on the Android phone to scan and download the QR code, download and install the application package;

[0065] S103: Run the application package to extract the Internet traffic information of each APP and the usage behavior of each APP o...


PUM


Abstract

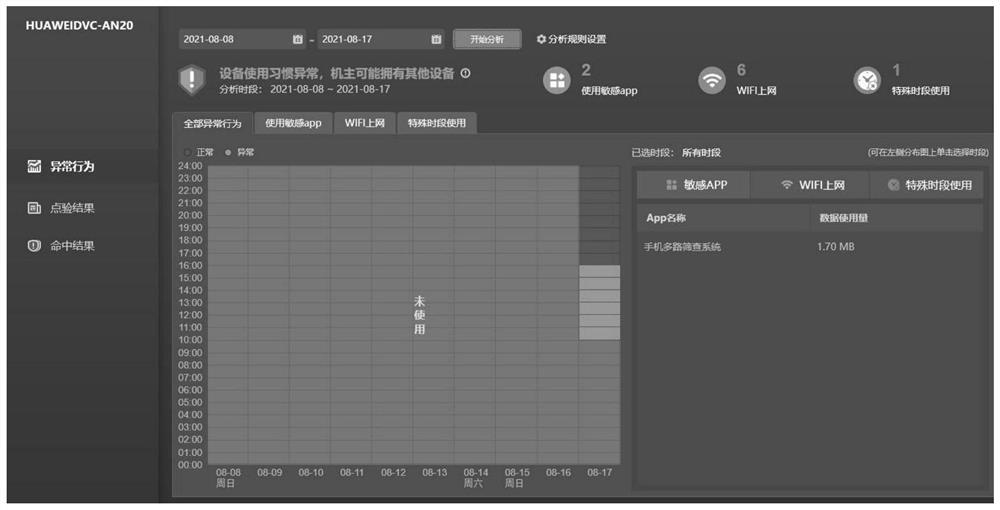
The invention discloses an Android mobile phone user abnormal use behavior analysis and visualization method, and the method comprises the following steps: S100, data extraction: obtaining an application package, extracting data, and uploading the data to a client, the application package being used for extracting various data in an Android mobile phone; S200, analyzing the data; and S300, visualizing an analysis result. According to the method provided by the invention, the APP use information and the internet surfing information of the user are accurately analyzed aiming at the extracted data, the data are assembled by taking time and behaviors as main lines, and the analysis result is displayed in a thermodynamic diagram and histogram mode, so that the user operation is very simple, the visual display logic is clear and visual, and the analysis result is easy to understand.

Description

technical field [0001] The invention belongs to the field of electronic forensics, and relates to an analysis and visualization method of an Android mobile phone user's abnormal use behavior. Background technique [0002] The popular use of Android mobile phones has created tens of thousands of Android-based application APPs that have sprung up. The application APP not only greatly enriches people's daily life and improves the efficiency of people's work, but also makes people's way of life better. qualitative improvement and transformation. [0003] When people use Android mobile phones, a large amount of user information is recorded in the mobile phone. These information are temporarily or permanently stored in the mobile phone after the user uses the Android mobile phone every day, and are invisible to ordinary users or cannot intuitively understand the meaning of the information. These include the traces of the user's APP usage, Internet access information and many mor...

Claims


Application Information

Patent Timeline
Patent Type & Authority Applications(China)
IPC IPC(8): H04M1/72403G06F16/901G06F16/904G06F16/906H04M1/72406H04M1/72445H04M1/72451H04M1/72463
CPCH04M1/72403H04M1/72451H04M1/72463H04M1/72445H04M1/72406G06F16/9024G06F16/904G06F16/906
Inventor 张佳强冯火军
Owner XLY SALVATIONDATA TECHNOLOGY INC
Learn More