Visual display method for automatic monitoring data based on application software

A technology of monitoring data and application software, which is applied in the field of visual display of automatic monitoring data based on application software, can solve problems such as insufficient control and insufficient dimensions, so as to improve the efficiency of operation and maintenance, improve the level of operation and maintenance management, and meet the timeliness required effect

Pending Publication Date: 2021-02-23
CITY CLOUD TECH HANGZHOU CO LTD
View PDF4 Cites 0 Cited by
  • Summary
  • Abstract
  • Description
  • Claims
  • Application Information

AI Technical Summary

Problems solved by technology

[0007] The purpose of the present invention is to provide a visual display method based on application software automatic monitoring data, so as to solve the problems of insufficient dimension and insufficient control in the data visualization of existing open source tools

Method used


Image

  • Visual display method for automatic monitoring data based on application software

Examples


Embodiment Construction

[0033] The present invention will be further described below in conjunction with the accompanying drawings and embodiments.

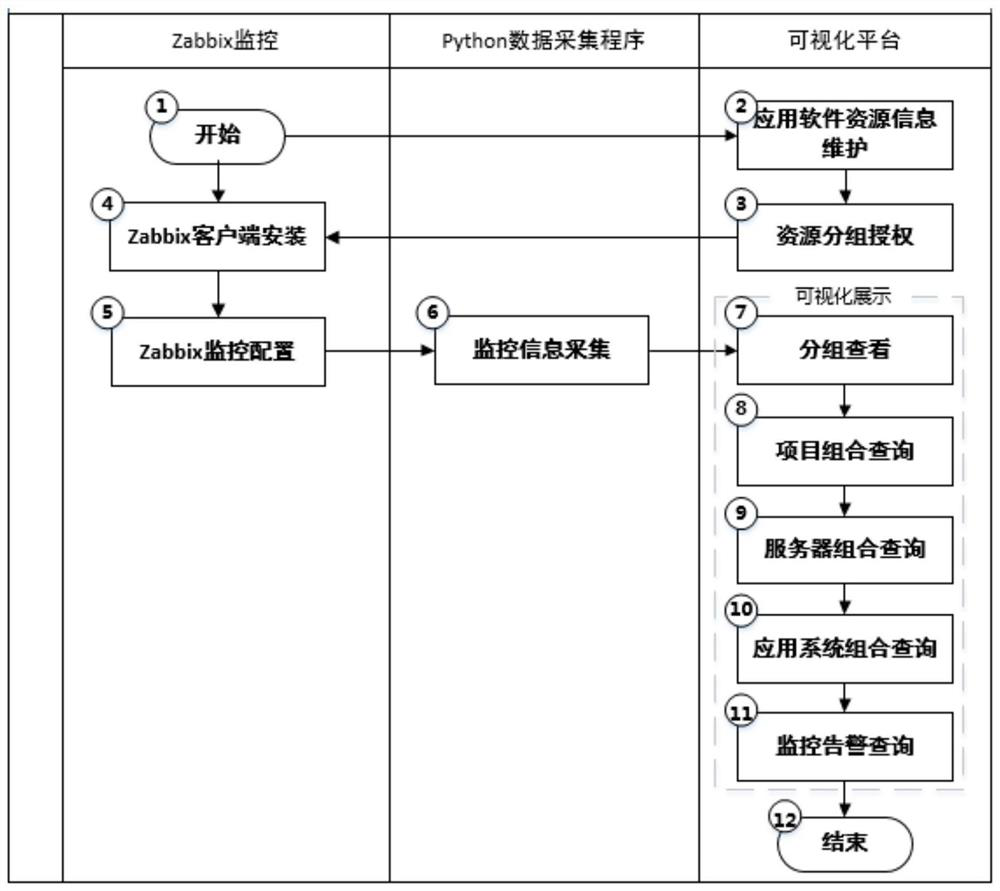
[0034] Such as figure 1 As shown, the visual display method based on application software automation monitoring data includes the following steps:

[0035] (1) The project operation and maintenance personnel install the monitoring program in the operation and maintenance project server, and the monitoring program monitors the resource information of the operation and maintenance project server and generates alarm information corresponding to the resource information, and then the resource information and alarm information are collected by the monitoring information collection package The information is collected and stored in the visualization platform; the resource information of the operation and maintenance project includes project information, server information, middleware information, application program information, and application system informa...


PUM


Abstract

The invention discloses a visual display method for automatic monitoring data based on application software. The method comprises the following steps: (1) constructing a visual platform; (2) installing a monitoring program in an operation and maintenance project server by project operation and maintenance personnel, monitoring resource information of the operation and maintenance project server bythe monitoring program, generating alarm information, and then acquiring and storing the alarm information into a visual platform by a monitoring information acquisition program package; (3) establishing an association relationship of resource information by project operation and maintenance personnel through the visual platform; (4) grouping the resource information by the project operation andmaintenance personnel, and setting the viewing data permission of each resource group to be allocated to the user; and (5) accessing the visual platform by a user to obtain related resource information and alarm information and inquiring. By adopting the method of the invention, project customers can effectively and comprehensively master the running states of servers and application systems involved in projects, and the operation and maintenance management level is improved.

Description

technical field [0001] The invention relates to the field of data visualization methods, in particular to a visualization display method based on application software automatic monitoring data. Background technique [0002] Currently, data visualization can generally be developed using open source tools such as Zabbix and Grafana. However, when existing open source tools such as Zabbix and Grafana graphically display the results of automated monitoring, the main problems are: [0003] First: The data display method is relatively simple, such as: independently displaying the monitoring status of various monitoring items of a certain server, which cannot be combined with the application scenarios of resources for comprehensive display. [0004] Second: The dimension of data display is not enough, and it cannot be combined and viewed through the dimensions of servers, middleware, and application systems. For example, when viewing server information, you cannot view the runnin...

Claims


Application Information

Patent Timeline
IPC IPC(8): G06F11/32G06F11/30
CPCG06F11/323G06F11/302G06F11/3051
Inventor 郁强周建安黄练纲豆汝松童利平
Owner CITY CLOUD TECH HANGZHOU CO LTD
Why Eureka
Try Eureka