
Reservoir scheduling graph drawing method for coupling ensemble forecast information

An ensemble forecasting and scheduling map technology, applied in image data processing, 2D image generation, resources, etc., can solve problems such as large computational burden, and achieve the effect of reducing computational burden, avoiding local optimality, and avoiding violent fluctuations

Pending Publication Date: 2020-05-05
XIAN UNIV OF TECH
View PDF0 Cites 4 Cited by
  • Summary
  • Abstract
  • Description
  • Claims
  • Application Information

AI Technical Summary

Problems solved by technology

The ensemble forecast method can effectively describe the uncertainty of the forecast, but directly coupling the ensemble forecast information into the scheduling diagram optimization model will cause a huge computational burden

Method used


Image

  • Reservoir scheduling graph drawing method for coupling ensemble forecast information
  • Reservoir scheduling graph drawing method for coupling ensemble forecast information
  • Reservoir scheduling graph drawing method for coupling ensemble forecast information

Examples


Embodiment

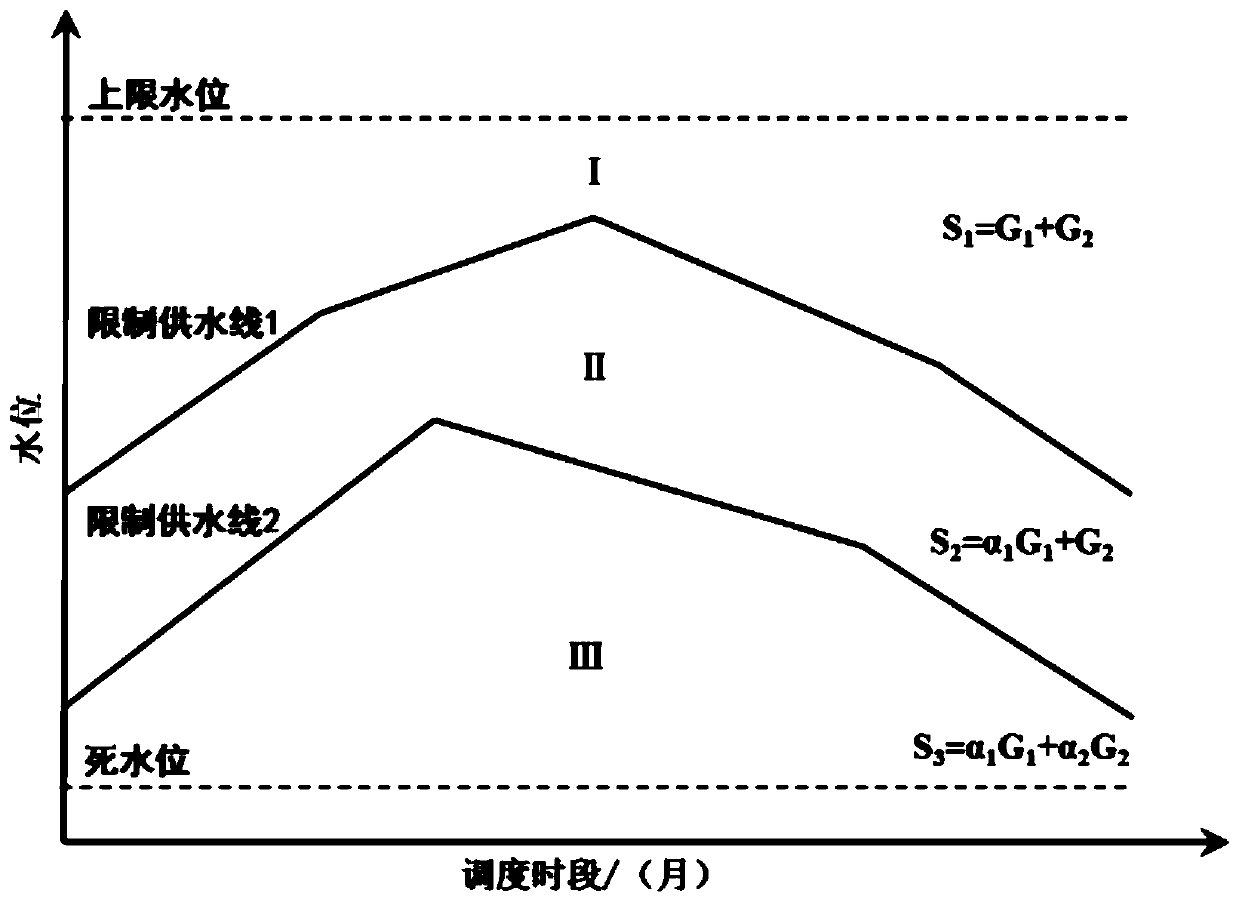
[0093] Based on the constructed scheduling chart parameter-simulation-optimization model, the control parameters of the scheduling chart are simulated, and the scheduling chart with two water supply limit lines is taken as an example to illustrate:

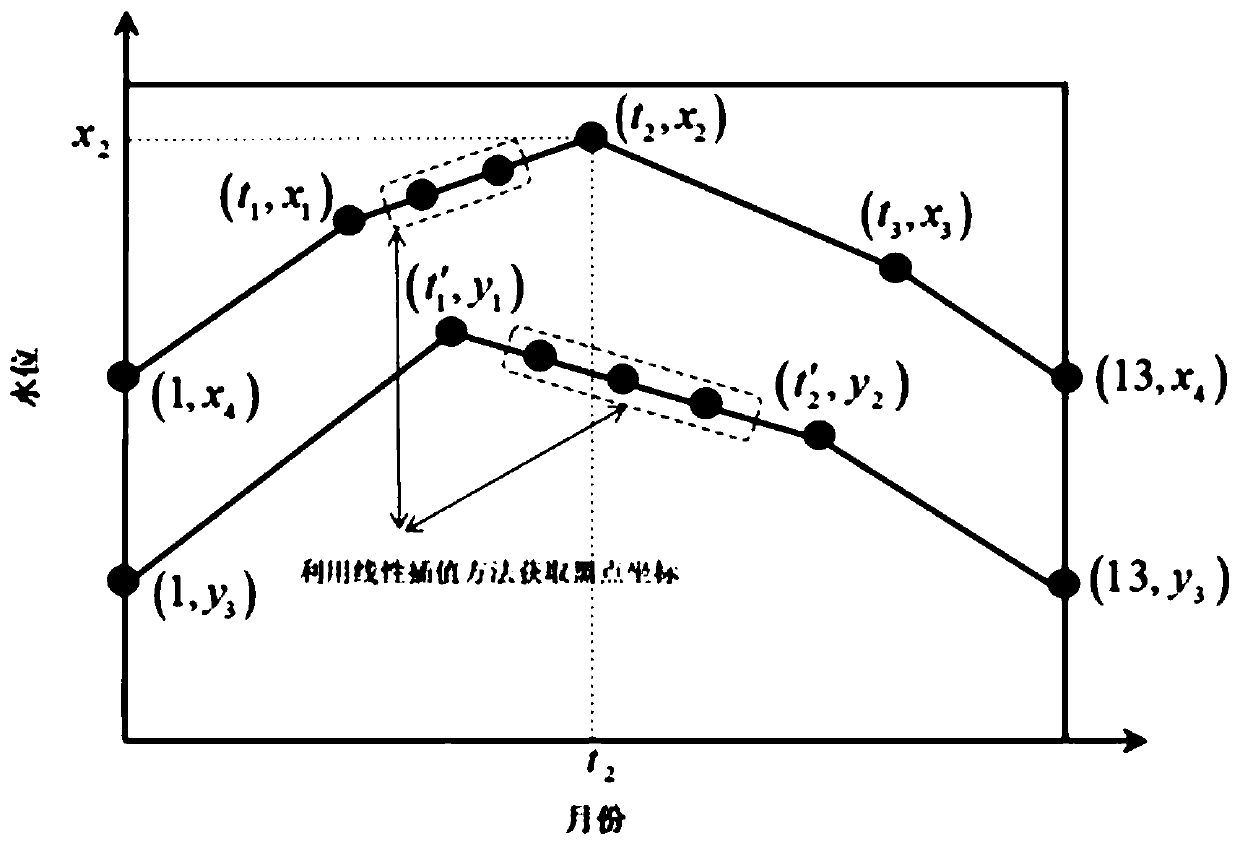
[0094] (1) The two-dimensional coding method is used to code the key nodes of the dispatching graph, and the water level values ​​of other nodes between key nodes are obtained by linear interpolation method, such as figure 2 As shown, the composition type of the multi-objective algorithm solution is expressed as:

[0095] solution=[t 1 ,...,t n ,x 1 ...x n+1 ,t′ 1 ,...,t' n ,y 1 ...,y n+1 ]

[0096] In the formula, n is the number of key nodes; t 1 ,...,t n (t 1 2 ,...,n ) and x 1 ...x n+1 Respectively, the abscissa (time) and ordinate (water level) of key nodes in the upper scheduling line; t′ 1 ,...,t' n (t' 1 2 ,...,n ) and y 1 ...,y n+1 are the abscissa (time) and ordinate (water level) of the key nodes in t...


PUM


Abstract

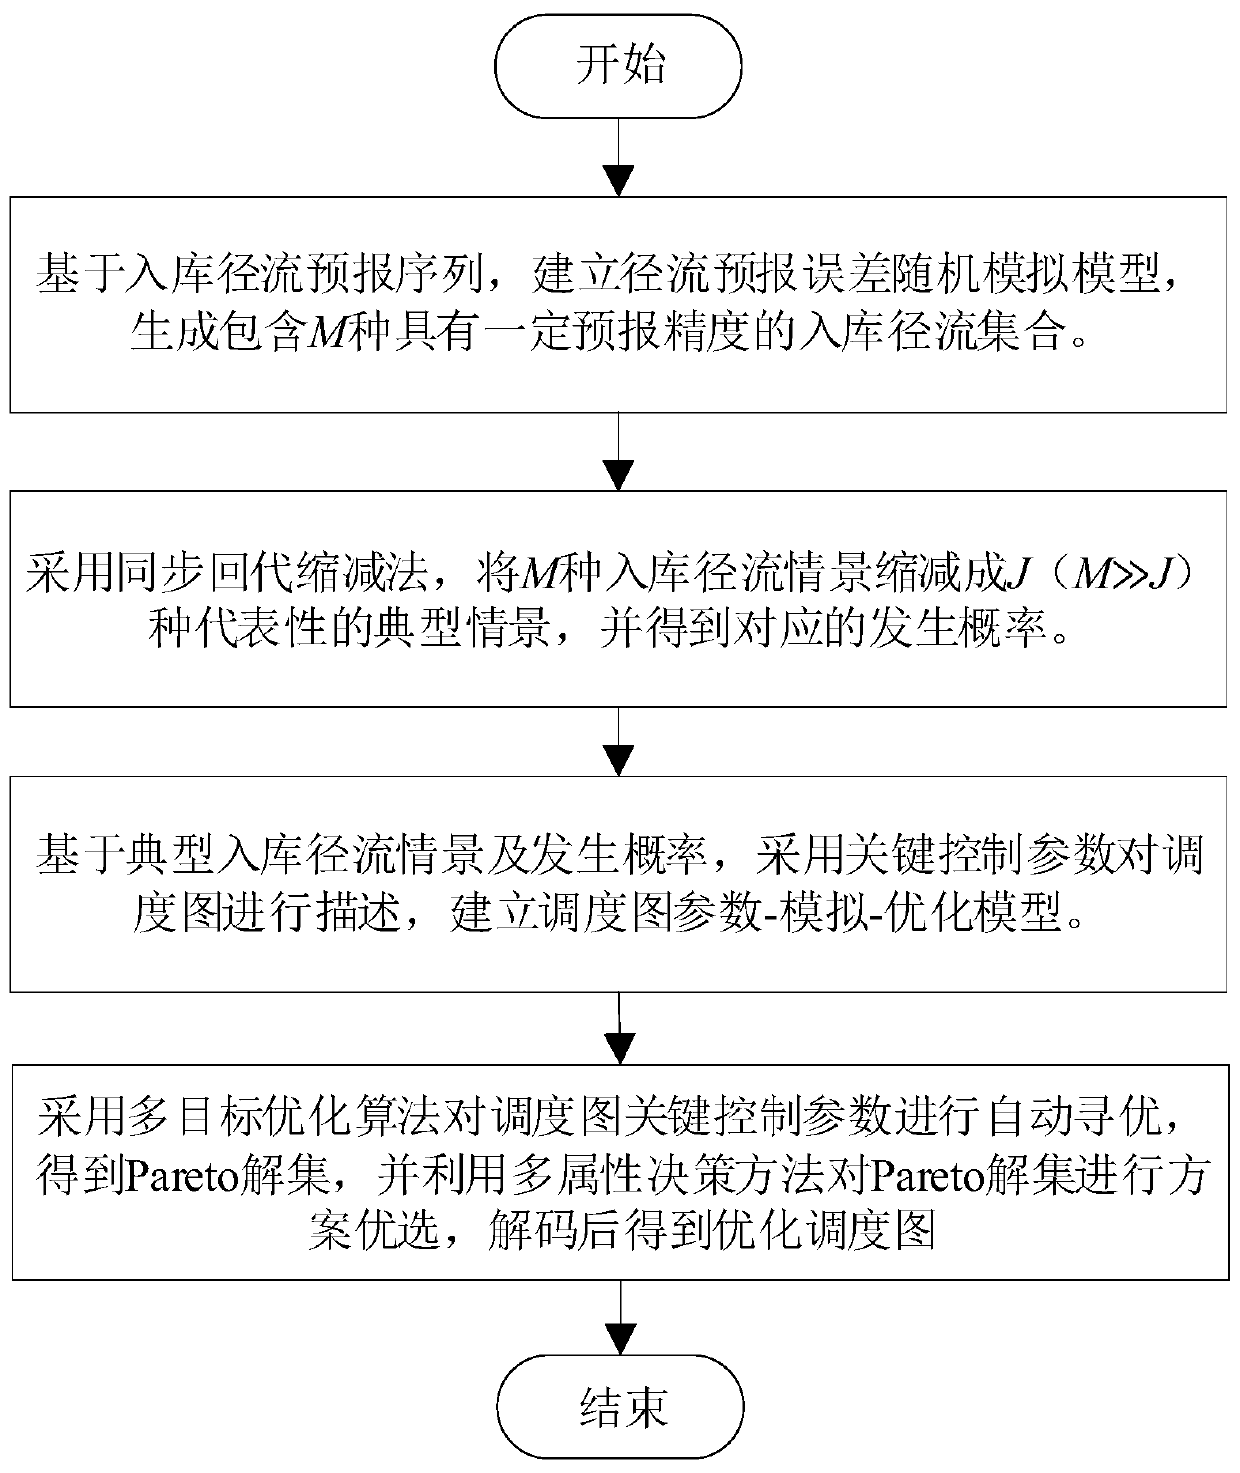
The invention discloses a reservoir scheduling graph drawing method for coupling ensemble forecast information, and the method comprises the steps: building a runoff forecast error random simulation model based on an in-reservoir runoff forecast sequence, and generating M in-reservoir runoff sets with certain forecast precision; reducing the M in-reservoir runoff scenes into J (M>>J) representative typical scenes by adopting a synchronous back substitution reduction method, and obtaining corresponding occurrence probabilities; describing the scheduling graph by adopting key control parametersbased on the typical in-reservoir runoff situation and the occurrence probability, and establishing a scheduling graph parameter-simulation-optimization model, namely a multi-objective optimization model; and automatically optimizing the key control parameters of the scheduling graph by adopting a multi-objective optimization algorithm to obtain a Pareto solution set, performing scheme optimization on the Pareto solution set by utilizing a multi-attribute decision-making method, and performing decoding to obtain an optimized scheduling graph. According to the method, the forecast uncertainty can be efficiently coupled in the decision process of the scheduling graph, and meanwhile, the calculation burden is greatly reduced.

Description

technical field [0001] The invention belongs to the technical field of reservoir dispatching, and in particular relates to a method for drawing reservoir dispatching diagrams coupled with aggregate forecast information. Background technique [0002] Reservoirs are one of the most effective ways to directly regulate water resources. Reservoir dams meet the requirements of economic and social development for comprehensive utilization such as flood control, power generation, water supply, irrigation, and shipping by blocking and regulating natural runoff. Scheduling charts are one of the most efficient and robust tools for guiding reservoir operations. When using the traditional scheduling chart to guide the operation of the reservoir, the reservoir scheduling decision in the current period (such as discharge flow, output, and final storage capacity) is generally determined according to the storage capacity or water level at the beginning of the period. [0003] Because the r...

Claims


Application Information

Patent Timeline
IPC IPC(8): G06F30/20G06T11/20G06Q10/06G06Q50/06G06F111/06
CPCG06T11/206G06Q10/0631G06Q50/06
Inventor 明波钟华昱黄强王义民赵泽谦李研陈晶
Owner XIAN UNIV OF TECH
Learn More