
Product competition relation visual analysis method, device and equipment

A product and relationship technology, applied in the field of visual analysis of product competition relationship, can solve the problems of centralized or scattered coordinate points, chaotic graphics display, inability to accurately and effectively display product competition relationship, etc., to achieve accurate and effective display and convenient analysis and use.

Pending Publication Date: 2020-01-07
BEIJING QIHOO TECH CO LTD
View PDF4 Cites 1 Cited by
  • Summary
  • Abstract
  • Description
  • Claims
  • Application Information

AI Technical Summary

Problems solved by technology

[0004] However, when using the above method for analysis, it is found that the product coordinates and attribute coordinates output by the corresponding analysis method, the scatter diagram displayed directly in the two-dimensional space, the coordinate points will be too concentrated or scattered, and some of the coordinates Points are far away from other points, resulting in confusing graphic display, unable to accurately and effectively display the competitive relationship between products, which is not conducive to advertisers' analysis and use

Method used


Image

  • Product competition relation visual analysis method, device and equipment
  • Product competition relation visual analysis method, device and equipment
  • Product competition relation visual analysis method, device and equipment

Examples


Embodiment 1

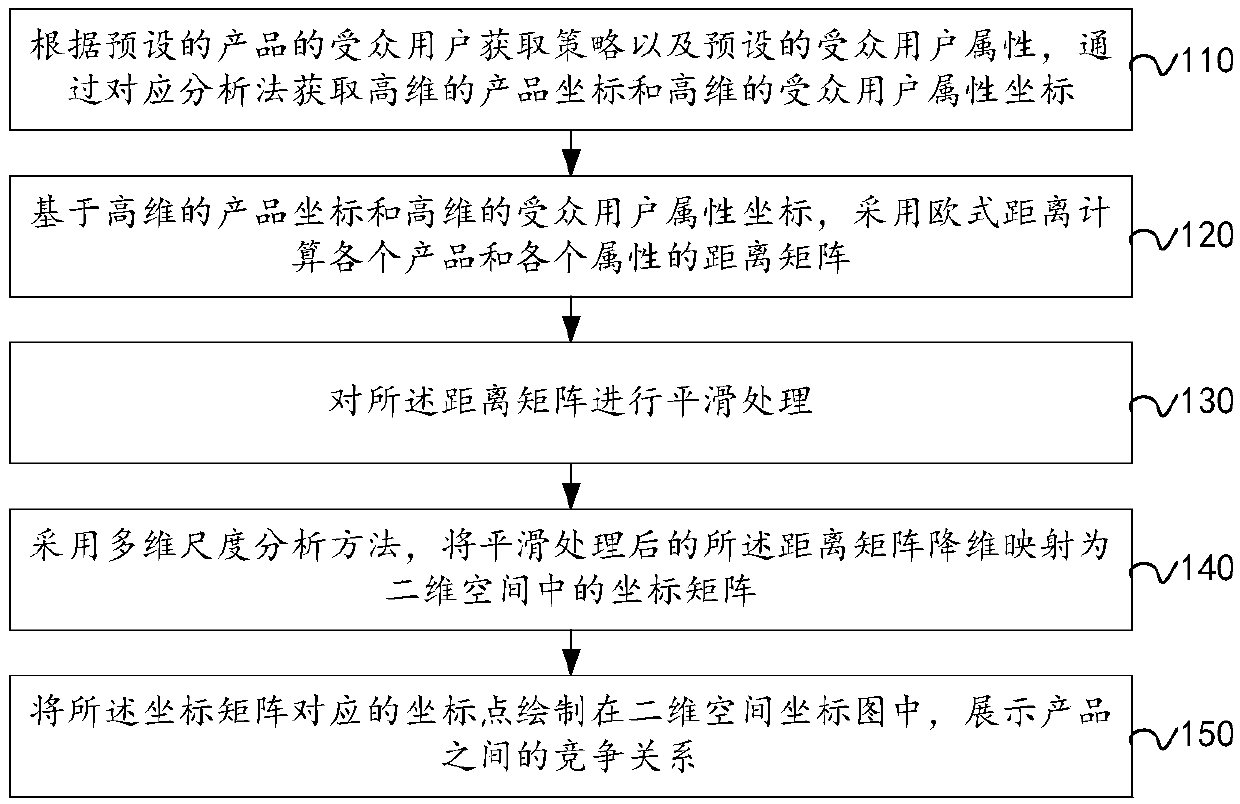
[0082] A method for visual analysis of product competition relationship provided by an embodiment of the present invention is introduced in detail.

[0083] refer to figure 1 , shows a flowchart of steps of a method for visual analysis of product competition relationship in an embodiment of the present invention.

[0084] Step 110, according to the preset product audience user acquisition strategy and preset audience user attributes, high-dimensional product coordinates and high-dimensional audience user attribute coordinates are obtained through correspondence analysis.

[0085] After any product is put on the market, the audience users of the product are rich and diverse, and have certain rules. For example, it is possible that people of a certain occupation buy and use more, and it is possible that people of a certain age group buy and use more. Moreover, users themselves also have diverse attributes, such as: age, gender, occupation, working years, marriage, and other at...

Embodiment 2

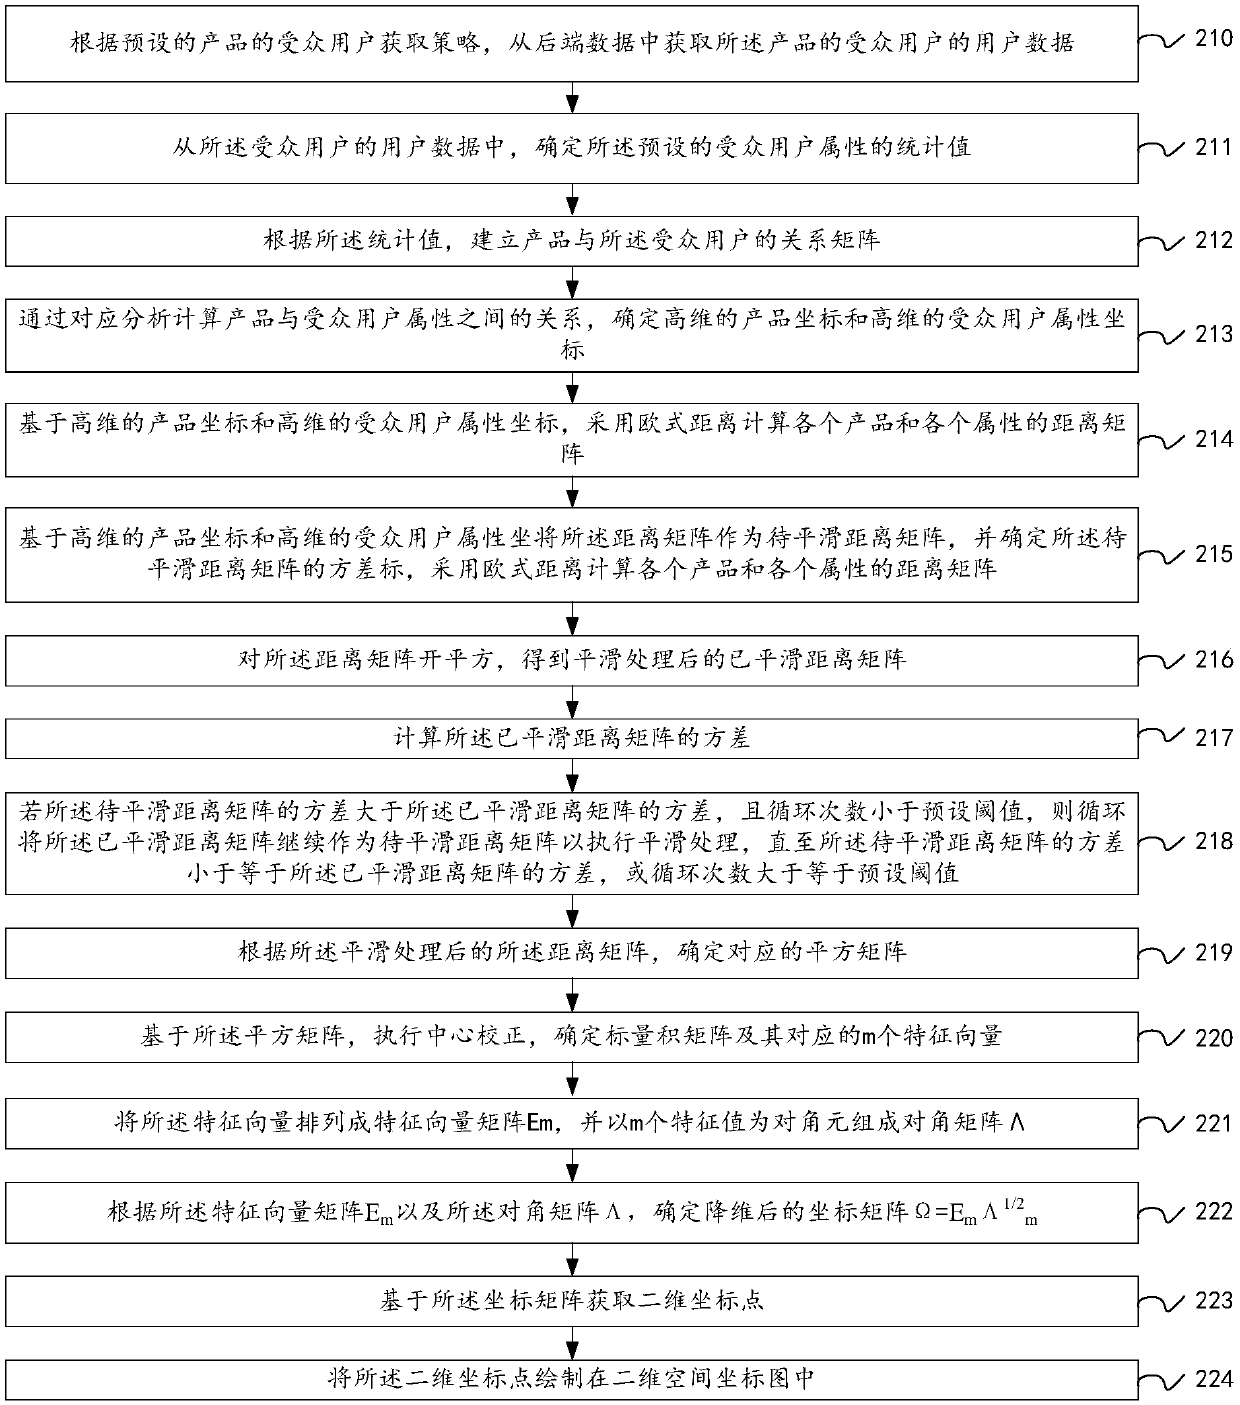
[0101] A method for visual analysis of product competition relationship provided by an embodiment of the present invention is introduced in detail.

[0102] refer to figure 2 , shows a flowchart of steps of a method for visual analysis of product competition relationship in an embodiment of the present invention.

[0103] Step 210, according to the preset product target user acquisition strategy, acquire the user data of the target user of the product from the back-end data.

[0104] Usually, various access records of the user in the network are stored in the background server, such as: web browsing history, search keyword records, online shopping records, etc. Therefore, once the audience user acquisition strategy is determined, according to the strategy, the user data of the audience users that meet the preset conditions can be automatically screened and captured from the back-end data.

[0105]Optionally, in the embodiment of the present invention, the above step 210 may...

Embodiment 3

[0193] A device for visual analysis of product competition relationship provided by an embodiment of the present invention is introduced in detail.

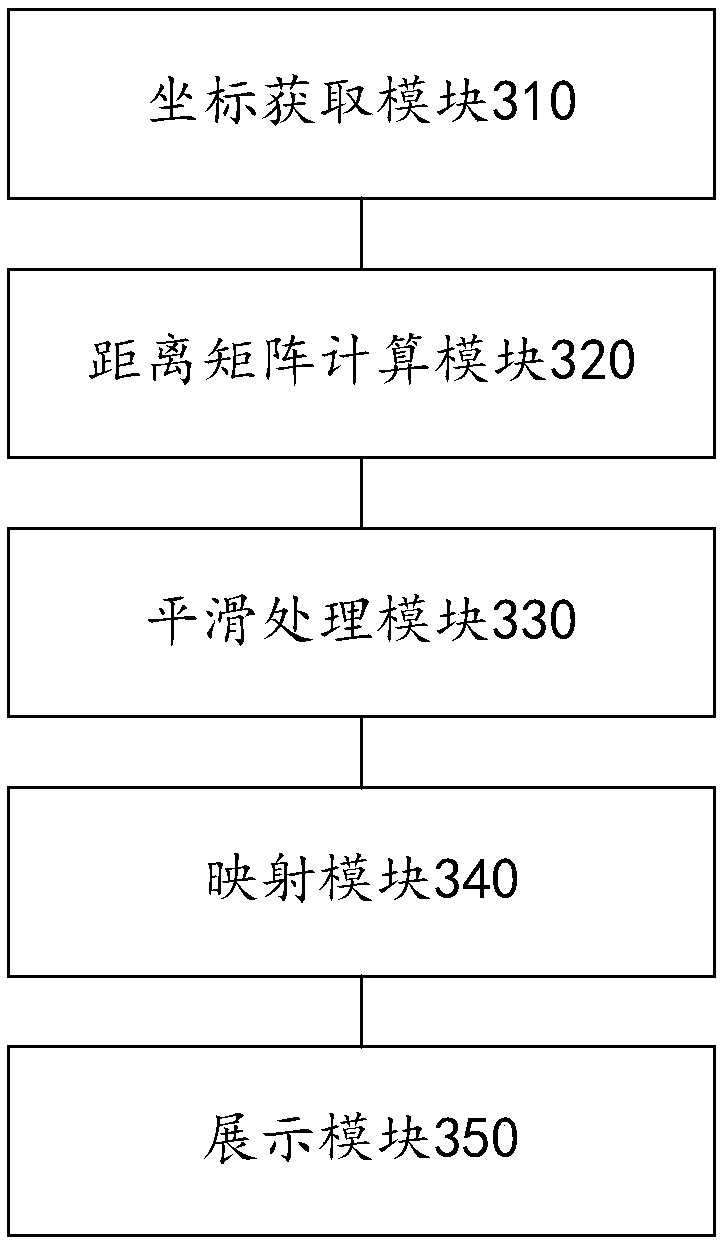
[0194] refer to image 3 , which shows a schematic structural diagram of a visual analysis device for product competition relationship in an embodiment of the present invention, including:

[0195] The coordinate acquisition module 310 is used to acquire high-dimensional product coordinates and high-dimensional audience user attribute coordinates through correspondence analysis according to the preset product audience user acquisition strategy and preset audience user attributes;

[0196] The distance matrix calculation module 320 is used to calculate the distance matrix of each product and each attribute based on the high-dimensional product coordinates and high-dimensional audience user attribute coordinates by using the Euclidean distance;

[0197] A smoothing processing module 330, configured to perform smoothing processing ...


PUM


Abstract

The invention discloses a product competition relation visual analysis method, device and equipment, and relates to the technical field of computers. The method comprises the steps of obtaining high-dimensional product coordinates and high-dimensional audience user attribute coordinates through a corresponding analysis method according to a preset audience user obtaining strategy of a product andpreset audience user attributes; based on the high-dimensional product coordinates and the high-dimensional audience user attribute coordinates, calculating a distance matrix of each product and eachattribute by adopting an Euclidean distance; carrying out smoothing processing on the distance matrix; performing dimensionality reduction mapping on the smoothed distance matrix into a coordinate matrix in a two-dimensional space by adopting a multi-dimensional scale analysis method; and drawing coordinate points corresponding to the coordinate matrix in a two-dimensional space coordinate graph,and displaying a competitive relationship between products. The technical problem that the coordinate points are excessively concentrated or scattered, and consequently graph display is disordered issolved. The beneficial effects of accurately and effectively displaying the competitive relationship between the products and facilitating the analysis and use of advertisers are achieved.

Description

technical field [0001] The invention relates to the field of computer technology, in particular to a method, device and equipment for visual analysis of product competition relationship. Background technique [0002] Promoting products through advertisements is a common means to promote product sales. Advertisers will analyze their own products before placing advertisements, analyze potential competitors of products, and analyze differences between products and competitive products, etc., so as to guide advertisers' advertisements. delivery behavior. [0003] At present, when the method of correspondence analysis is used to analyze the product competition relationship, by determining the product audience users and their gender, age and other attributes, the relationship matrix between the product and the audience user attributes is obtained, and the relationship between the product and the attributes is analyzed from the relationship matrix to determine the product. Coordin...

Claims


Application Information

Patent Timeline
IPC IPC(8): G06Q30/02
CPCG06Q30/0202Y02P90/30
Inventor 徐立鑫
Owner BEIJING QIHOO TECH CO LTD
Learn More