Method for quantitatively analyzing interaction between small molecule and protein kinase
A technology for quantitative analysis of protein kinases, applied in the field of quantitative analysis of interactions between small molecules and protein kinases
- Summary
- Abstract
- Description
- Claims
- Application Information
AI Technical Summary
Problems solved by technology
Method used
Image
Examples
Embodiment 1
[0028] Example 1 Interaction Analysis of Human Aurora Kinase Aurora A Protein and ATP Competitive Inhibitor VX689 Based on Stable Isotope Labeling and Mass Spectrometry
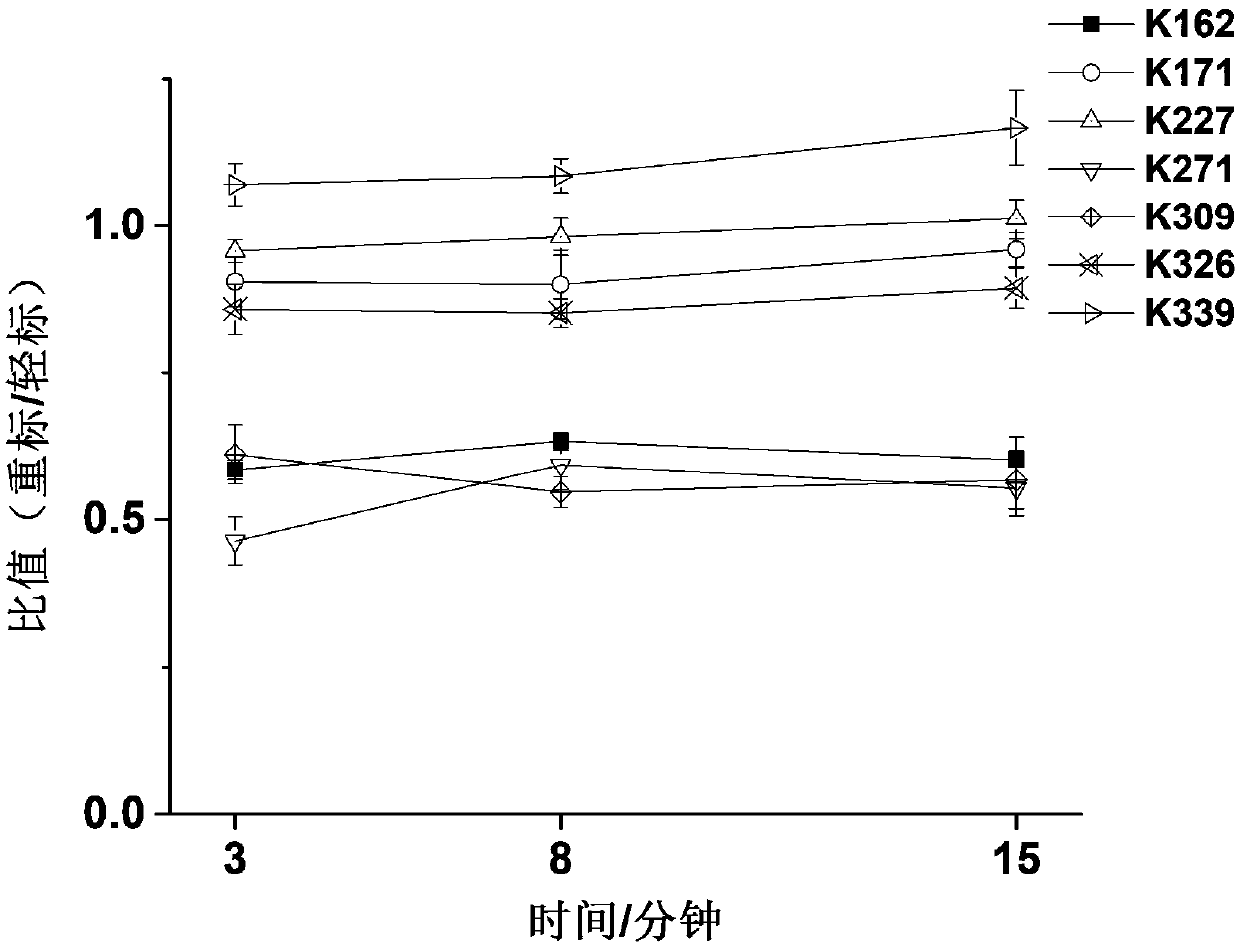
[0029]Aurora A kinase (final concentration 2 μM) was dissolved in 50 mM HEPES buffer, protein kinase sample was divided into two parts of equal mass, one part was incubated with inhibitor VX689 (concentration adjusted according to experimental purpose) at room temperature for 20 min, and one part was kept without change, then in NaBH 3 Under the catalysis of CN (final concentration 5mM), add CD to protein kinase-small molecule solution and protein kinase solution respectively 2 O and CH 2 O (both at a final concentration of 5 mM) was used for heavy and light stable isotope labeling. After a specific period of reaction, ammonium bicarbonate (final concentration of 5 mM) was added to stop the reaction. Then, the light and heavy labeled protein samples were mixed, and enzymatically digested at 30° C. for 5 hou...
Embodiment 2
[0034] Example 2 Effect of K309 mutation on the interaction between Aurora kinase Aurora A protein and inhibitor VX689
[0035] Randomly mutate the 309th lysine (K) site of Aurora kinase protein A (Aurora A) into alanine (A), change the concentration of VX689, and observe the wild-type protein (WT, 2 μM) and the mutant protein (K309A, 2 μM) on the phosphorylation level of the kinase substrate histone H3 (final concentration 1.2 μM), so as to investigate the activity changes of Aurora A kinase under different VX689 concentrations.
[0036] From image 3 It can be seen from the molecular imprinting figure that when VX689 reaches 1.2 μM, the kinase substrate Histone H3 cannot be phosphorylated by wild-type Aurora A, and this concentration is not enough to inhibit the activity of mutant Aurora A, and a larger concentration of inhibitor is required ( to 2.5μM) to achieve the inhibition of the activity of mutant Aurora A.
[0037] The above results indicate that the K309 site away...
Embodiment 3
[0038] Example 3 The comparison between the stable isotope labeling and mass spectrometry method and the molecular imprinting method in exploring the kinase activity curve, and calculating the respective IC50 values.
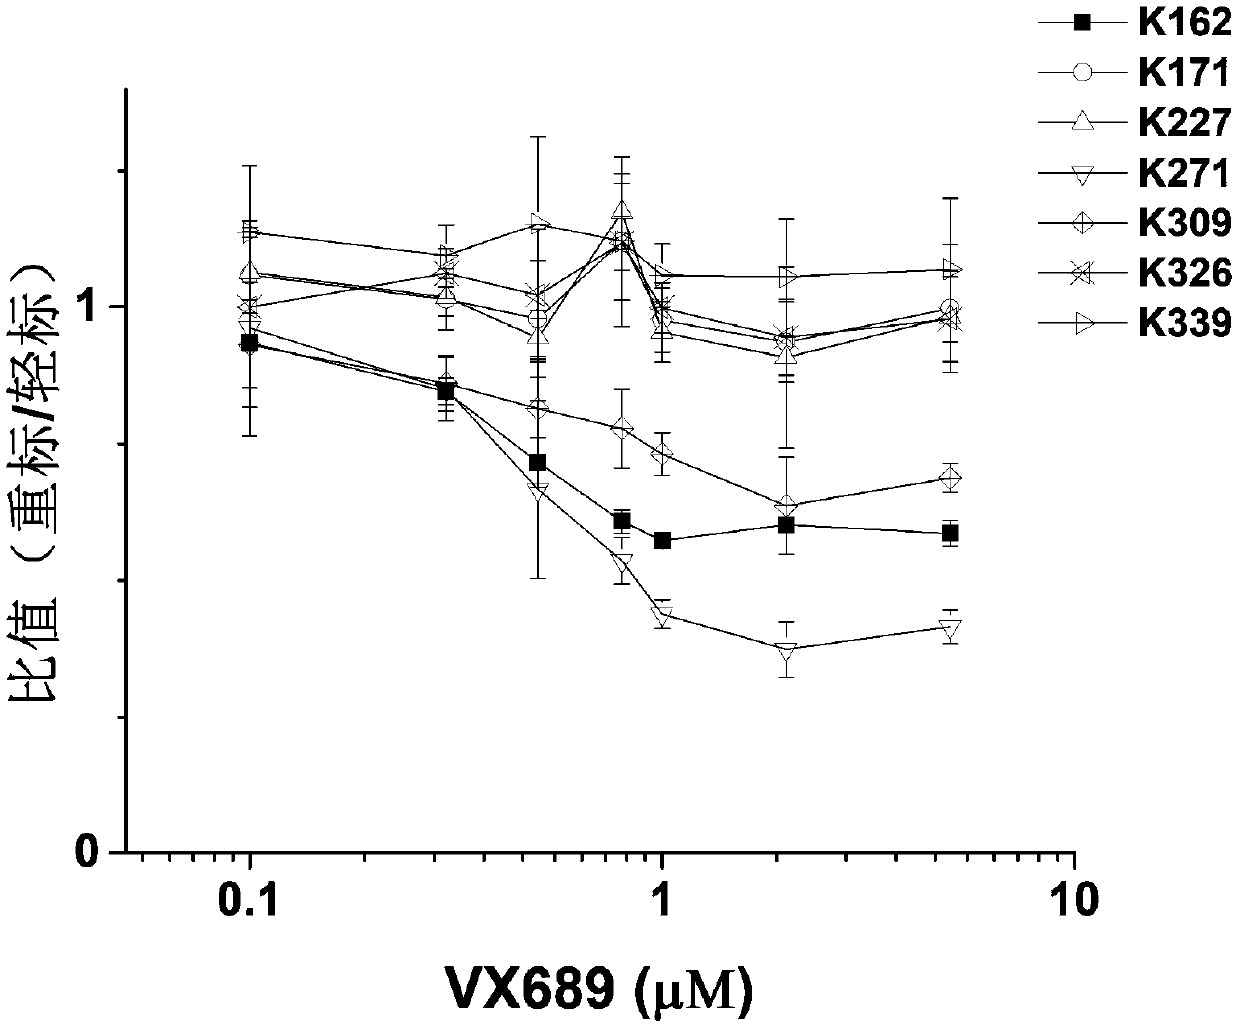
[0039] according to figure 2 The curve of isotope labeling ratio of K162, K271 and K309 changing with the concentration can get the IC50 value of VX689 on Aurora A kinase of 0.4-0.6μM. Compare the curve of K162 with image 3 The wild-type Aurora A kinase activity curve (that is, the quantification of the depth of the phosphorylated Histone H3 band) was obtained by molecular imprinting for comparison. The result is as Figure 4 As shown, it can be found that the curves of the two are basically consistent. After simulation calculation, the IC50 values of VX689 for Aurora A kinase in the K162 curve and the kinase activity curve are both 0.4 μM. Therefore, the isotope labeling ratio obtained by stable isotope labeling and mass spectrometry can not only reflect...
PUM
 Abstract
Description
Claims
Application Information
 - R&D
- Intellectual Property
- Life Sciences
- Materials
- Tech Scout
- Unparalleled Data Quality
- Higher Quality Content
- 60% Fewer Hallucinations
Browse by: Latest US Patents, China's latest patents, Technical Efficacy Thesaurus, Application Domain, Technology Topic, Popular Technical Reports.
© 2025 PatSnap. All rights reserved.Legal|Privacy policy|Modern Slavery Act Transparency Statement|Sitemap|About US| Contact US: help@patsnap.com


