Meat product taste compound profile analysis method
An analysis method and technology of meat products, applied in the field of food taste, can solve problems such as reviewer error, sensitivity and accuracy interference
- Summary
- Abstract
- Description
- Claims
- Application Information
AI Technical Summary
Problems solved by technology
Method used
Image
Examples
Embodiment 1
[0047] The method for profile analysis of flavor compounds in meat products comprises the following steps:
[0048] Step 1. Preparation of sample meat products
[0049] Obtain the sales information of the original sauce braised beef in the 5 regions of Southwest, Northwest, Central China, North China, and East China in the past year, select the top-ranked meat products (select from front to back according to the ranking), and obtain the following 13 kinds of original sauce braised beef Beef (vacuum packaged), the products were purchased from Beijing Wumart Supermarket and Tmall official flagship store. Among them, 2 types in the southwest region were named LSC and NTP; 2 types in the northwest region were named JYX and YBLX; The three species are named LSF, MZ and ZJK respectively; the three species in North China are named PY, DLS and TFH, and the three species in East China are named WFZ, WL and YONGSZ;
[0050] Take the above-mentioned original sauce stewed beef sample, re...
Embodiment 2
[0076] On the basis of embodiment 1:
[0077] The response signal acquisition in step 2 is as follows: each sample is collected three times, and the average value a of 10 data obtained after the collected data is stabilized is obtained each time, and the average value a of each sensor is obtained. Based on the overall average value of each sensor The value a calculates the average value b of each sensor corresponding to each sample as the response signal;
[0078] Step 3 also includes: calculating the average value c±standard error of each response signal (calculated from multiple corresponding average values b) based on the average value b of m sample meat products in each region, and using the average value c±standard error The error is the fluctuation range of the response signal corresponding to the sample meat products in this area, that is, the fluctuation range is (average value - standard error, average value + standard error), as shown in Table 3 below:
[0079] ...
Embodiment 3
[0086] Radar chart analysis of sample meat products
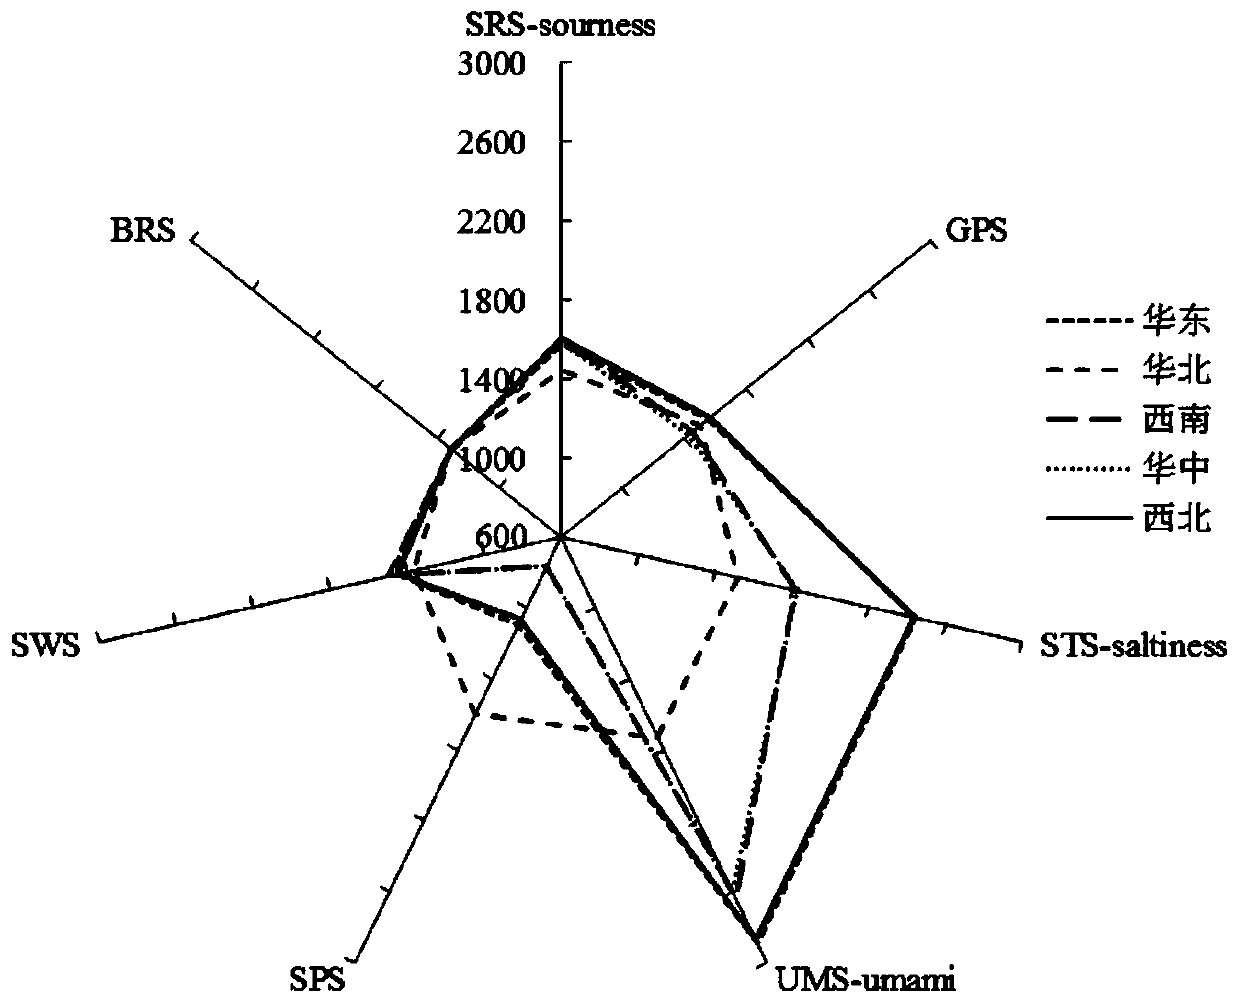
[0087] In order to more intuitively analyze the response of the electronic tongue to different original sauce braised beef, the average value of the response signals of the same sensor of multiple samples in the same area is calculated, and it is used as the response signal of the sample meat products in this area to the sensor. It is evenly arranged on the circumference, and each branch represents a sensor, forming a radar map to obtain the taste profile of the original sauce braised beef in each region, specifically as figure 2 shown;
[0088] Depend on figure 2 It can be seen that the taste profiles of the original stewed beef with sauce in Central China and Southwest China are similar, and the taste profiles of original stewed beef with sauce in Northwest China and East China are similar, which further confirms that their taste components are relatively close. The taste profile of original stewed beef in North China...
PUM
 Abstract
Description
Claims
Application Information
 - R&D
- Intellectual Property
- Life Sciences
- Materials
- Tech Scout
- Unparalleled Data Quality
- Higher Quality Content
- 60% Fewer Hallucinations
Browse by: Latest US Patents, China's latest patents, Technical Efficacy Thesaurus, Application Domain, Technology Topic, Popular Technical Reports.
© 2025 PatSnap. All rights reserved.Legal|Privacy policy|Modern Slavery Act Transparency Statement|Sitemap|About US| Contact US: help@patsnap.com


