Visualization method, device, equipment and storage medium of navigation vector data
A technology of vector data and map data, applied in the field of visualization method, equipment and storage medium and device of navigation vector data, can solve the problems of simple and extensive display effect of road data and road navigation, high user yaw rate and high production cost, To achieve the effect of improving the induction effect, reducing the yaw rate, and filling the blank of graphic data
- Summary
- Abstract
- Description
- Claims
- Application Information
AI Technical Summary
Problems solved by technology
Method used
Image

Examples
Embodiment 1
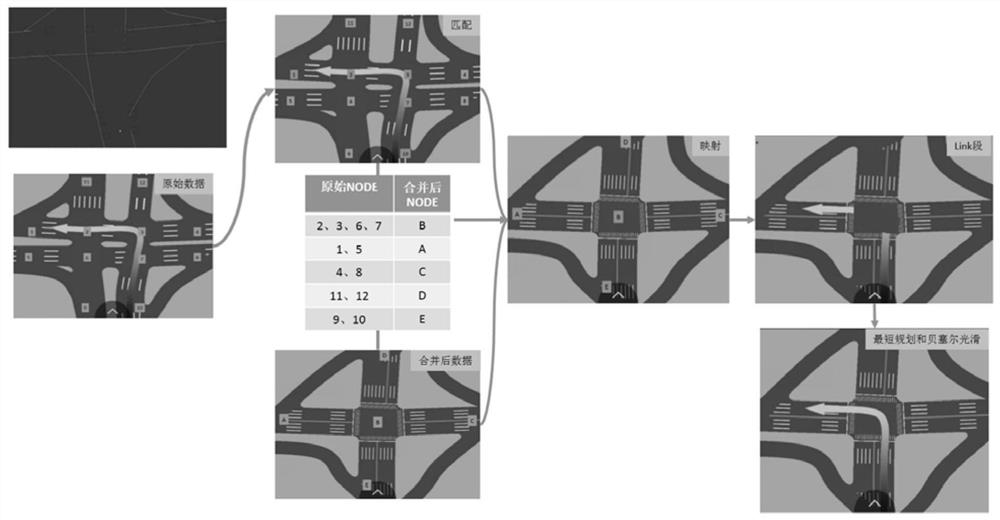
[0039] Figure 1A It is a flow chart of a navigation vector data visualization method provided by Embodiment 1 of the present invention. This embodiment is based on the road data collected in the existing map visualization, which only includes road descriptive data such as road centerlines and road connection point models. There is no data about how the road is displayed, and the existing display schemes cannot induce users well in terms of aesthetics and refinement. The method can be executed by the navigation vector data visualization device / server / computer-readable storage medium provided by the embodiment of the present invention, and the device / server / computer-readable storage medium can be implemented by software and / or hardware. see Figure 1A , the method specifically includes:
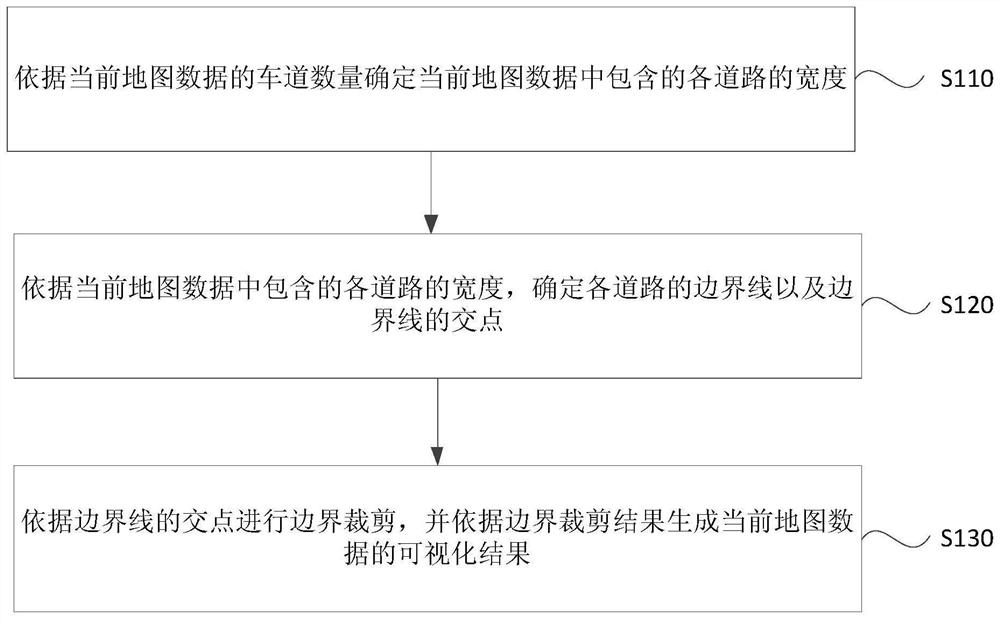
[0040] S110. Determine the width of each road included in the current map data according to the number of lanes in the current map data.
[0041] Among them, the current map data refers to al...
Embodiment 2
[0057] Figure 2A It is a flow chart of a navigation vector data visualization method provided in Embodiment 2 of the present invention, Figure 2B It is a schematic diagram of a visualization process of navigation arrows in navigation vector data provided by Embodiment 2 of the present invention. The navigation vector data visualization method is based on the first embodiment of the present invention, further optimizes the data after the visualization result of the current map data is generated according to the boundary clipping result, and provides a navigation arrow visualization method. Specifically, see Figure 2A The method can include:
[0058] S210. Determine the width of each road included in the current map data according to the number of lanes in the current map data.
[0059] S220, according to the width of each road contained in the current map data, determine the boundary line of each road and the intersection point of the boundary line.
[0060] S230. Perfor...
Embodiment 3
[0072] Figure 3A It is a flowchart of a navigation vector data visualization method provided by Embodiment 3 of the present invention. The navigation vector data visualization method is based on Embodiment 1 of the present invention, and further determines the number of lanes in the current map data based on the number of lanes in the current map data. The width of each road included is explained. Specifically, see Figure 3A The method can include:
[0073] S310. Determine the width of each road included in the current map data according to the number of lanes in the current map data, the width of the maximum number of lanes, the width of a single lane, and the maximum number of lanes.
[0074] Among them, a road is composed of multiple lanes, and the width of each lane is the width of a single lane; the width of the maximum number of lanes refers to the width of the widest road among all roads in the scene; correspondingly, the maximum number of lanes refers to the width ...
PUM
 Abstract
Description
Claims
Application Information
 - R&D
- Intellectual Property
- Life Sciences
- Materials
- Tech Scout
- Unparalleled Data Quality
- Higher Quality Content
- 60% Fewer Hallucinations
Browse by: Latest US Patents, China's latest patents, Technical Efficacy Thesaurus, Application Domain, Technology Topic, Popular Technical Reports.
© 2025 PatSnap. All rights reserved.Legal|Privacy policy|Modern Slavery Act Transparency Statement|Sitemap|About US| Contact US: help@patsnap.com