
A data platform for power supply load management

A data platform and power supply load technology, applied in the field of information management, can solve problems such as failure to achieve future load prediction, unfavorable prediction and analysis of large user load of power companies, and failure to mine, refine and display.

Pending Publication Date: 2019-05-28
SHANGHAI MUNICIPAL ELECTRIC POWER CO
View PDF6 Cites 13 Cited by
  • Summary
  • Abstract
  • Description
  • Claims
  • Application Information

AI Technical Summary

Problems solved by technology

[0003] With the in-depth development of the electric power business, the data platform of the load control display system under the existing technology can no longer meet the needs of monitoring and analysis, and it currently has the following problems:
[0004] (1) In the data platform of the load control display system under the existing technology, the user map is displayed through GPS map information, and the system cannot see the distribution density of users from the map display window, which is not conducive to power companies to predict the load of large users and analysis;
[0005] (2) The display interface of the data platform of the load control display system under the existing technology shows the user's daily electricity, daily load, daily electricity comparison, daily load comparison, and daily peak and valley load data, but does not realize the display of future load forecasts. Cannot provide effective decision support for scheduling analysis;
[0006] (3) The data platform of the negative control display system under the existing technology displays the basic electricity consumption information of the user, but does not conduct in-depth analysis on the user, such as the quality evaluation of the user, the improvement of the basic file of the user, and the data analysis of the user;
[0007] (4) The data platform of the load control display system under the existing technology has no analysis of typical industries. Compared with the ordinary user load, the voltage level of the large user load is higher, the power load is large, and the load fluctuation has great randomness
[0008] (5) The content displayed on the data platform of the negative control display system under the existing technology is monotonous, and only some basic information is displayed, without deep excavation, refinement and display
[0009] To sum up, the data platform of the load control display system under the existing technology can no longer meet the needs of the current power supply load control, and a new type of data platform is urgently needed to solve the above problems

Method used


Image

  • A data platform for power supply load management
  • A data platform for power supply load management
  • A data platform for power supply load management

Examples


Embodiment

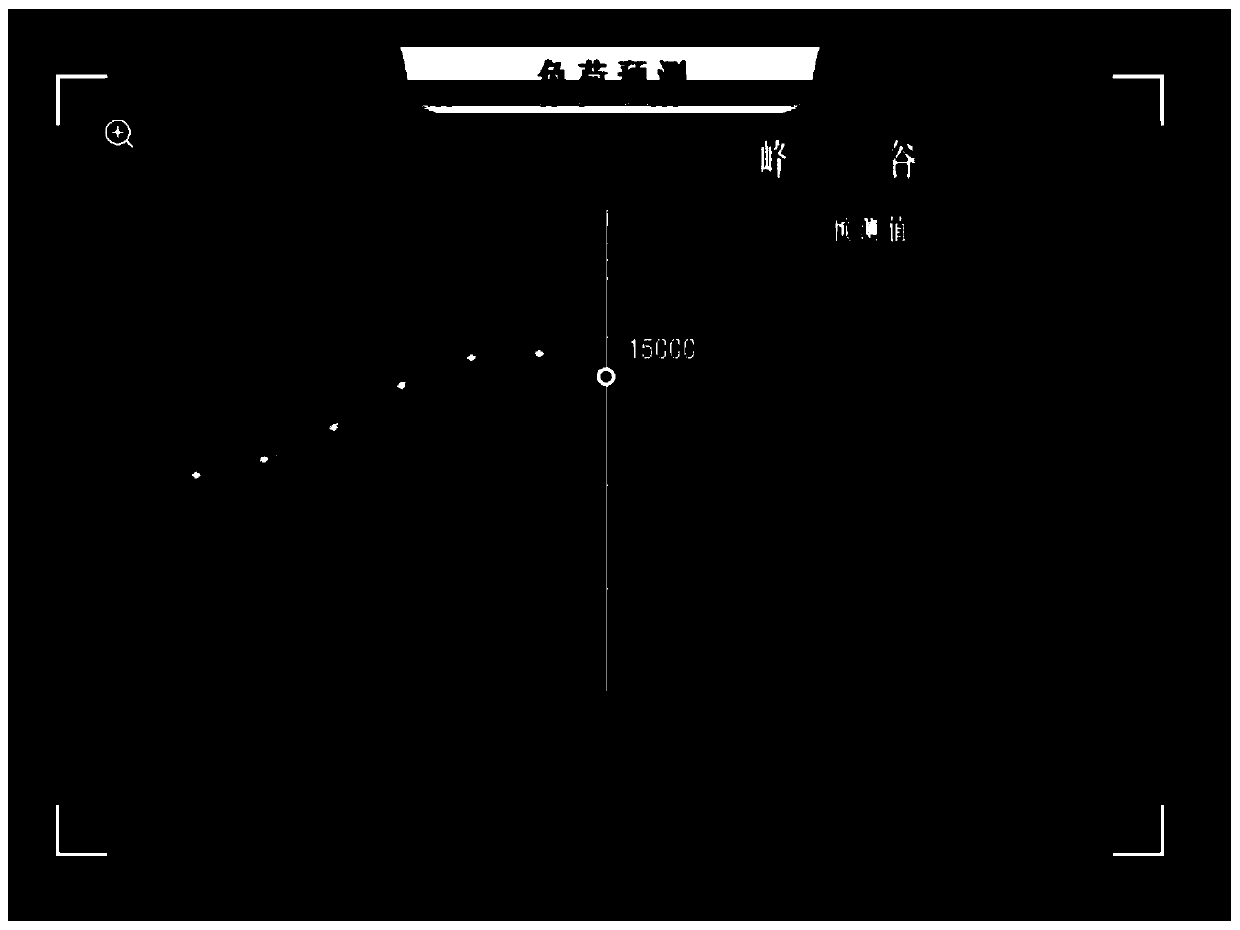
[0129] Such as Figure 1 to Figure 6 As shown (it should be noted that these drawings are all simulation diagrams of the data platform, the information in the figure is for reference only for the simulation effect, and the actual function is not limited to this figure), a data platform for power supply load management, which is displayed on the map to optimize the module and user load forecasting Module, user electricity quality evaluation display module, typical industry electricity model analysis module and basic data support module;

[0130] The map display optimization module builds a heat map based on the concept of the heat map, drawing of the heat map, and heat map related information in the geographic information system, combined with the map display method, to realize the map positioning and distribution display of large users of 10KV and above;

[0131] The user load forecasting module is based on big data power user load forecasting, and uses the forecasting model i...


PUM


Abstract

A data platform for power supply load management is composed of a map display optimization module, a user load prediction module, a user power consumption quality evaluation display module, a typicalindustry power consumption model analysis module and a basic data support module. According to the method, an existing map display mode is optimized, a load prediction model is constructed, a user model is depicted deeply, and research on industrial power consumption behaviors and basic data support is depicted deeply; Load, power consumption and other information of 10KV and above large users arefurther extracted, more effective information is mined, and the display content of the load control system is enriched; Theoretical support can be provided for load prediction and peak clipping and valley filling work of power enterprises, power users can deeply know the load prediction method and the load characteristics of various typical industries, and certain reference significance is achieved for the users.

Description

technical field [0001] The invention relates to the field of information management, in particular to a data platform applied to power supply load management in a power system. Background technique [0002] At present, State Grid has set up load management centers in power companies in various cities / regions. The load management centers are equipped with load control display system data platforms. The display system data platform takes business as the core and takes senior business experts as resource advantages. Applying big data technology, through in-depth excavation, analysis, and display of load information of tens of thousands of high-quality electricity users in the city, visualizes and three-dimensionalizes the electricity consumption characteristics of enterprises, regions, industries, etc., and deeply analyzes and excavates the electricity consumption of all parties Behavior, realize the integrated display of business monitoring, business integration, user guidance...

Claims


Application Information

Patent Timeline
Patent Type & Authority Applications(China)
IPC IPC(8): G06Q10/04G06Q10/06G06Q50/06G06F16/2458G06F16/248G06F16/29
CPCY02P90/82Y02D10/00
Inventor 郑庆荣赵建立高志刚陆颖杰汤卓凡郭雁
Owner SHANGHAI MUNICIPAL ELECTRIC POWER CO
Learn More