Adaptive traffic control subarea dividing method based on spatial data mining
A technology of traffic control and spatial data, applied in the field of transportation, can solve the problem of low travel efficiency in the control area
- Summary
- Abstract
- Description
- Claims
- Application Information
AI Technical Summary
Problems solved by technology
Method used
Image
Examples
specific Embodiment approach 1
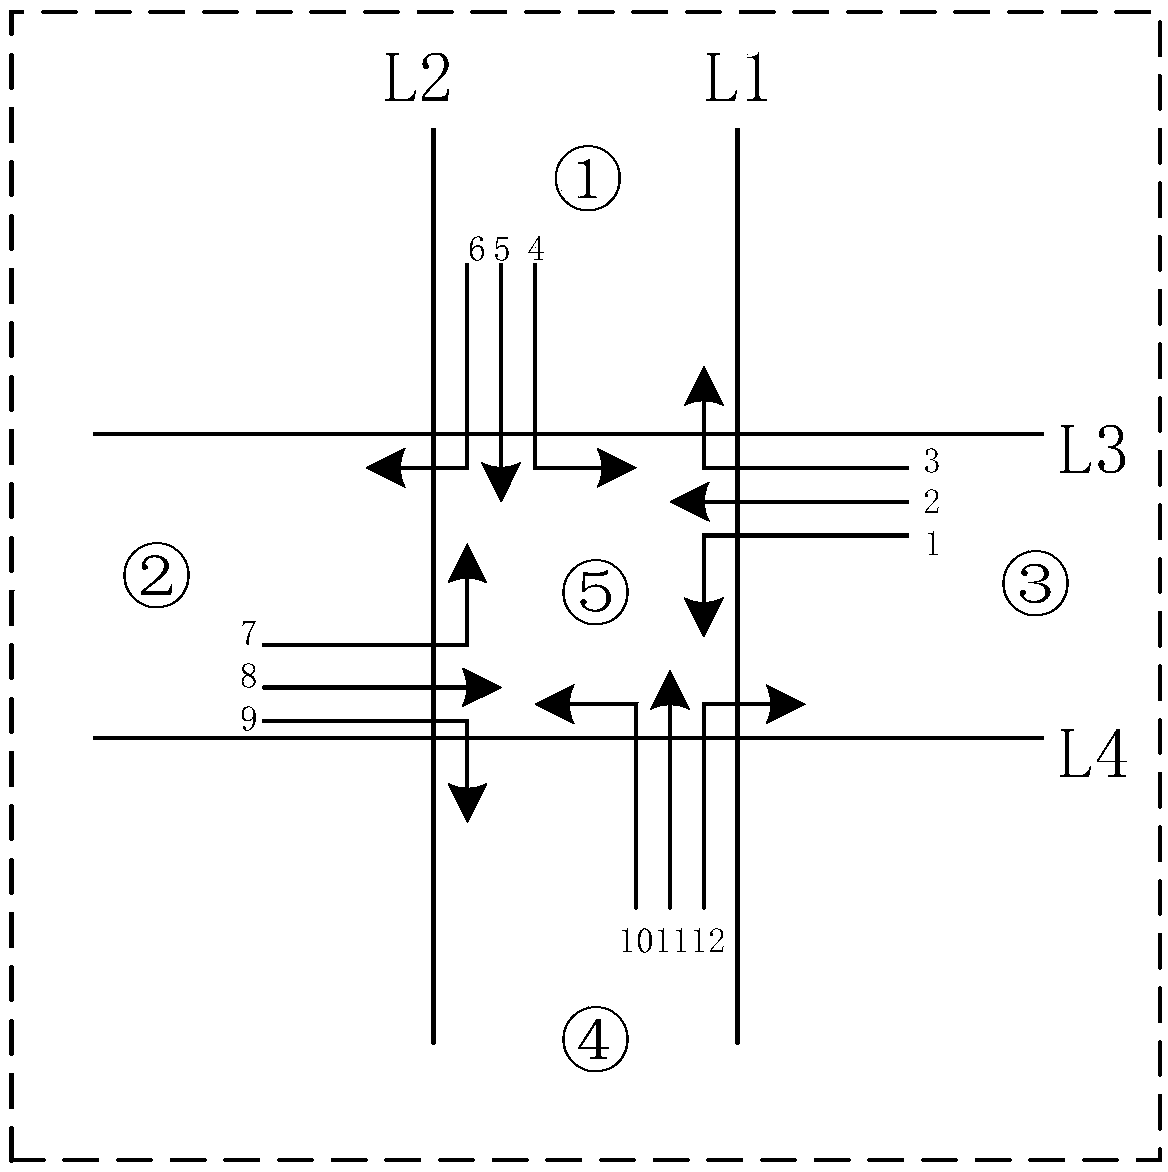
[0114] The adaptive traffic control sub-area division method based on spatial data mining includes the following steps:
[0115] Step 1. Feature extraction of high and low peak periods and high, medium and low flow thresholds:
[0116] High, medium, and low flow thresholds are important boundaries for determining the current traffic status in different directions at intersections, and are important parameters for the realization of flow principles in the later traffic control sub-area model. The precondition for calculating high, medium and low traffic is the need to use data mining methods to realize traffic statistics in different directions at intersections at different time intervals.
[0117] Step 1.1. Calculate the traffic flow in different directions passing through the intersection, that is, calculate the traffic flow in different directions from one of the two intersecting roads into the intersection:
[0118] Step 1.1.1. Divide the two intersecting roads at the inte...
Embodiment
[0210] 1. Data preprocessing
[0211] The data set used in this invention is the GPS records of 14,000 taxis in Chengdu, from August 3, 2014 to August 30, 2014, and ignores the data from zero to six in the morning, and has been cleaned There are duplicate and abnormal records, each record contains taxi ID, latitude, longitude and timestamp, and the time interval of each record is 60s. The format of the data is as follows:
[0212] 1, 30.624806, 104.136604, 1, 2014 / 8 / 3 21:18:46
[0213] 1, 30.624809, 104.136612, 1, 2014 / 8 / 3 21:18:15
[0214]1, 30.624811, 104.136587, 1, 2014 / 8 / 3 21:20:17
[0215] 1, 30.624811, 104.136596, 1, 2014 / 8 / 3 21:19:16
[0216] When a large number of trajectory points are displayed in chronological order, the traffic pattern, that is, the shape of the road network, can be displayed. Therefore, the experiment maps the latitude and longitude to plane coordinates, connects the coordinates in order of time stamps to form vehicle trajectories, and display...
PUM
 Abstract
Description
Claims
Application Information
 - R&D
- Intellectual Property
- Life Sciences
- Materials
- Tech Scout
- Unparalleled Data Quality
- Higher Quality Content
- 60% Fewer Hallucinations
Browse by: Latest US Patents, China's latest patents, Technical Efficacy Thesaurus, Application Domain, Technology Topic, Popular Technical Reports.
© 2025 PatSnap. All rights reserved.Legal|Privacy policy|Modern Slavery Act Transparency Statement|Sitemap|About US| Contact US: help@patsnap.com


