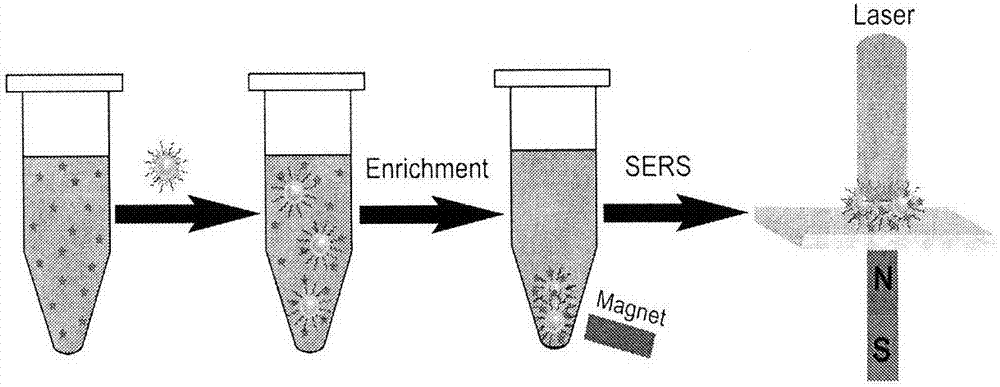
Antibiotic Raman spectrum detection method based on surface-modified magnetic nano-silver flower substrate
A Raman spectroscopic detection and magnetic nanotechnology, applied in Raman scattering, measurement devices, material analysis by optical means, etc., can solve the problems of cumbersome processing, time-consuming, labor-intensive, etc.
- Summary
- Abstract
- Description
- Claims
- Application Information
AI Technical Summary
Problems solved by technology
Method used
Image
Examples
Embodiment 1
[0033] Preparation of a high-performance surface-modified magnetic nano silver flower:
[0034] figure 1 A schematic flow chart of the magnetic silver silver flower modified by n-hexanethiol is given. Its specific preparation method is divided into the following five steps: the first step is to coat a layer of SiO2 on the outside of 200nm Fe3O4 nanoparticles; the second step is to grow silver seed particles by chemical plating; the third step is to formaldehyde and ammonia in ultrasonic Under the conditions, the flower-like shell is rapidly reduced; the fourth step is that n-hexanethiol (C6) is connected to the Ag shell through a sulfhydryl group (-SH), and is combined with a chemical bond, relying on the self-assembled hydrophobic layer on the surface of the magnetic nano silver flower and the antibiotic molecule. The hydrophobic interaction enriches the antibiotic molecules; the fifth step is to wash the SERS substrate (Fe3O4@SiO2-Ag-C6) modified by n-hexanethiol (C6) with ...
Embodiment 2
[0037] Antibiotic Raman spectroscopy detection method based on surface-modified magnetic nano silver flower substrate was used for qualitative and quantitative analysis of two antibiotic solutions:
[0038] image 3 It is the result of qualitative and quantitative analysis of chloramphenicol solution. Using Fe3O4@SiO2-Ag-C6 SERS substrate for concentrations ranging from 10 -3 ~10 -10 The chloramphenicol solution of M was detected by Raman, and the 80% ethanol used to prepare the chloramphenicol solution was used as a signal reference, and the obtained SERS spectrum was as follows image 3 As shown in A. The SERS signal intensity gradually decreased with the decrease of chloramphenicol concentration. Since the SERS signal intensity is very sensitive to the concentration of chloramphenicol, the background-subtracted SERS signal intensity of chloramphenicol was used to plot its concentration. image 3 a is chloramphenicol at 1347cm -1 The log-log relationship between the inte...
Embodiment 3
[0041] Figure 5-Figure 7 It is the qualitative and quantitative analysis results of chloramphenicol in milk and ciprofloxacin in milk. Taking blank milk as a signal reference, the obtained SERS spectrum is as follows: Figure 5 A. Image 6 Shown in B. Such as Figure 5 a, Image 6 As shown in b, we have selected the characteristic peak 1347cm of chloramphenicol in the spectrogram -1 , the characteristic peak of ciprofloxacin is 1387cm -1 , plotted their log-log curves according to their solution concentrations and corresponding characteristic peak intensities. Chloramphenicol, ciprofloxacin in 10 -3 ~10 -9 Within the concentration range of M, obtain the linear equation y=6818+653.05879x, r respectively 2 =0.99; y=13843+1212.5468x, r 2 =0.98, the linear relationship is good. The detection limits of this method to chloramphenicol and ciprofloxacin in milk are respectively 0.1nM (30ppt), 1nM (331ppt), far below the maximum residue 0.3ng / mL (300ppt) stipulated in the 2...
PUM
 Abstract
Description
Claims
Application Information
 - R&D
- Intellectual Property
- Life Sciences
- Materials
- Tech Scout
- Unparalleled Data Quality
- Higher Quality Content
- 60% Fewer Hallucinations
Browse by: Latest US Patents, China's latest patents, Technical Efficacy Thesaurus, Application Domain, Technology Topic, Popular Technical Reports.
© 2025 PatSnap. All rights reserved.Legal|Privacy policy|Modern Slavery Act Transparency Statement|Sitemap|About US| Contact US: help@patsnap.com


