Method for detecting hemoglobin based on GQDs (graphene quantum dots)
A technology of graphene quantum dots and hemoglobin, which is applied in the field of detection of hemoglobin based on graphene quantum dots, can solve the problems of complex operation steps, large operation errors, and long analysis time, and achieve good fluorescence stability, low cost, sensitive and efficient detection Effect
- Summary
- Abstract
- Description
- Claims
- Application Information
AI Technical Summary
Problems solved by technology
Method used
Image
Examples
Embodiment 1
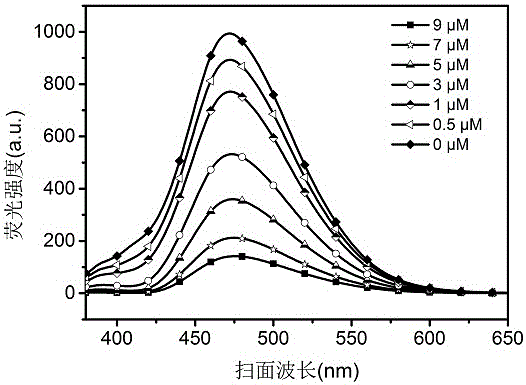
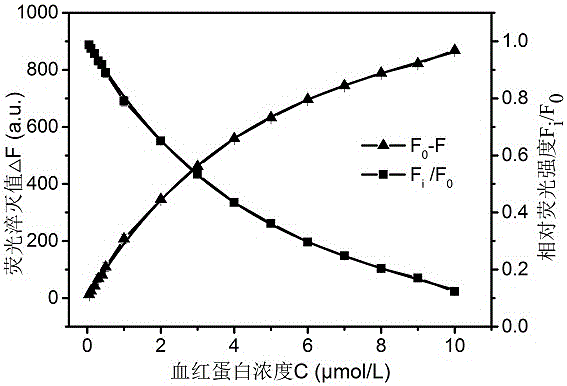
[0029] Example 1: The degree of fluorescence quenching of graphene quantum dots by hemoglobin is related to its concentration. The specific process is as follows:
[0030] 1. Prepare graphene quantum dot solution: Disperse the synthesized graphene quantum dots in a phosphate buffer (concentration of 0.01 mol / L, pH value of 7.4) to obtain a graphene quantum dot solution (concentration of 20 mg / L) );
[0031] 2. Prepare hemoglobin solution: fully dissolve hemoglobin in phosphate buffer (concentration of 0.01mol / L, pH value of 7.4) to obtain a hemoglobin solution (concentration of 0-10μmol / L);
[0032] 3. Prepare standard solution: Take a certain amount of the solution prepared in step 1 and step 2, mix thoroughly and add phosphate buffer (concentration of 0.01 mol / L, pH value of 7.4) to prepare a set of blank standard samples. Standard solutions with different known hemoglobin concentrations; the final concentration of graphene quantum dots is 20mg / L, and the final concentration gradi...
Embodiment 2
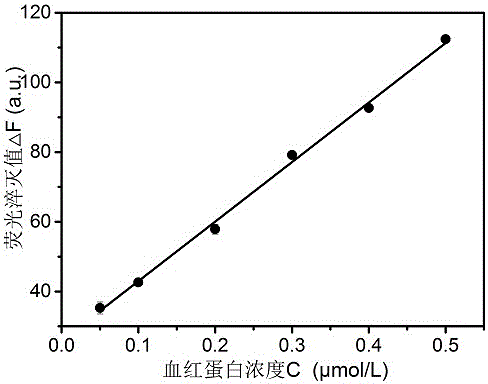
[0035] Example 2: Establish the working curve of graphene quantum dots to detect hemoglobin, the specific process is as follows:
[0036] According to the results obtained in Example 1, we selected hemoglobin with a concentration range of 0-0.5 μmol / L for further experiments. Prepare graphene quantum dot solution (concentration is fixed at 20mg / L), the hemoglobin concentration is 0, 0.05, 0.1, 0.2, 0.3, 0.4, 0.5μmol / L, mix the two to make 7 standard solutions, and Detect the fluorescence spectrum of the standard solution with a fluorescence spectrometer under the condition that the emission wavelength is 368nm, take the fluorescence intensity value F at the wavelength of 470 nm, and calculate the corresponding fluorescence quenching value △F=F 0 -F, △F and the concentration of hemoglobin C have a good linear relationship, draw the C-△F curve, and used as the graphene quantum dots to detect hemoglobin working curve. (For specific results, see image 3 ). Such as image 3 As shown...
Embodiment 3
[0037] Example 3: Using the present invention to determine the content of hemoglobin in a simulated actual sample, the specific process is as follows:
[0038] Under the same experimental conditions, based on the common hemoglobin iron supplement health products in the market, a mixed system containing hemoglobin was simulated, and 20.9 mg / L L-arginine, 22.0 mg / L L-lysine, 39.5 Independent fluorescence quenching experiments were performed on mg / L glucose, 45.3 mg / L sucrose, 44.0 mg / L vitamin C, 37.7 mg / L starch, and 5 mg / L hemoglobin to obtain a relative fluorescence intensity map. (For specific results, see Figure 4 ). The experimental results show that only hemoglobin in the above components makes the graphene quantum dots significantly quenched; at the same time, in the mixed system, the overall quenching degree of the system is equivalent to the quenching degree of hemoglobin alone (96.9%), which indicates that the graphene quantum dots Point probe detection of hemoglobin ...
PUM
 Abstract
Description
Claims
Application Information
 - R&D
- Intellectual Property
- Life Sciences
- Materials
- Tech Scout
- Unparalleled Data Quality
- Higher Quality Content
- 60% Fewer Hallucinations
Browse by: Latest US Patents, China's latest patents, Technical Efficacy Thesaurus, Application Domain, Technology Topic, Popular Technical Reports.
© 2025 PatSnap. All rights reserved.Legal|Privacy policy|Modern Slavery Act Transparency Statement|Sitemap|About US| Contact US: help@patsnap.com


