
Data visualization method based on neutron transport characteristic line theory

A characteristic line theory and technology of characteristic lines, applied in special data processing applications, electrical digital data processing, design optimization/simulation, etc., can solve problems that are difficult to deal with by visualization methods, and achieve the effect of expanding the scope

Active Publication Date: 2017-03-22
HARBIN ENG UNIV
View PDF2 Cites 10 Cited by
  • Summary
  • Abstract
  • Description
  • Claims
  • Application Information

AI Technical Summary

Problems solved by technology

Before performing time-consuming transportation calculations, users usually need to judge whether the geometric pre-processing conditions (such as material layout, flat source grid division, feature line tracking, etc.) meet the expected requirements, and then decide whether to continue to run the transportation calculation module. These irregular grids pose challenges to both the visualization of geometric preprocessing results and the visualization of calculation results
[0004] The traditional pixel visualization technology has its own advantages in data visualization, but it is mainly for pixel filling of regular closed areas. For reactor neutron transport calculations, a large number of irregular grids will make the traditional visualization method difficult to handle

Method used


Image

  • Data visualization method based on neutron transport characteristic line theory
  • Data visualization method based on neutron transport characteristic line theory
  • Data visualization method based on neutron transport characteristic line theory

Examples


Embodiment Construction

[0043] Below in conjunction with accompanying drawing, the present invention will be described in further detail:

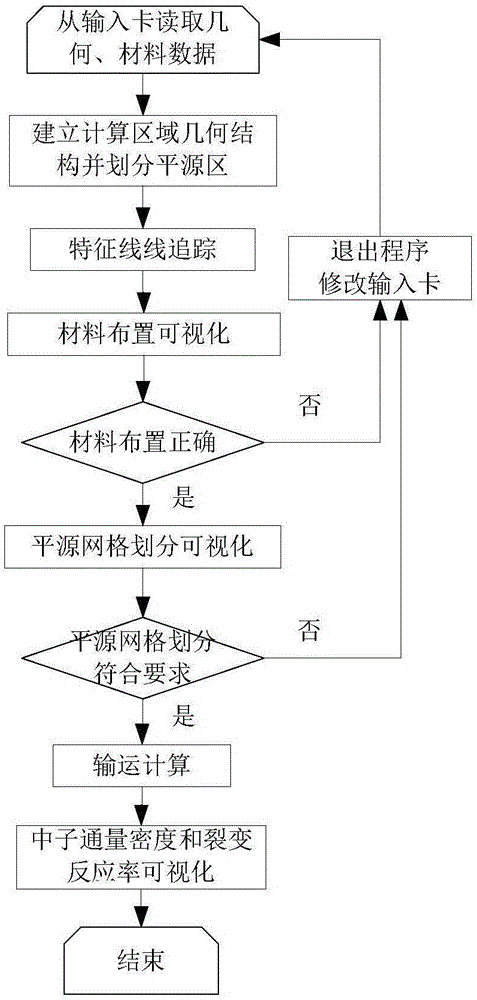
[0044] The present invention proposes a result data visualization method based on neutron transport characteristic line theory, and realizes result data visualization by filling characteristic line segments into corresponding pixel points. The specific implementation of the present invention includes: establishing a geometric model of the calculation area and dividing the flat source area, and then performing feature line tracking. According to the obtained feature line segment information, the pixel visualization technology based on scan line filling is used to realize visualization, as shown in the attached figure 1 shown. The specific implementation manner will be described in detail below in conjunction with the flow chart. The implementation method mainly includes the following key contents:

[0045] Step 1: Perform flat source grid division and spatial an...


PUM


Abstract

The invention belongs to the field of nuclear reactor physical simulation and data visualization and specifically relates to a data visualization method based on a neutron transport characteristic line theory. The method comprises the steps of establishing a geometric model of a computing area through adoption of a method for establishing entity geometry, obtaining geometric entities by carrying out primary Boolean operation on a weighted curve, appointing a material serial number to each sealed geometric entity, and so on. According to the method, compact characteristic line fragment information produced in a characteristic line tracking process can be utilized fully and effectively, corresponding color RGB values are appointed to the characteristic line fragments, and the data is visualized based on characteristic line filling.

Description

technical field [0001] The invention belongs to the field of nuclear reactor physical simulation and data visualization, and in particular relates to a data visualization method based on neutron transport characteristic line theory. Background technique [0002] Solving the Boltzmann neutron transport equation is an essential content in the physical calculation of the nuclear reactor core, and the transport equation in the form of characteristic lines proposed by Askew in 1972 has the advantages of simple form and strong geometric adaptability, so in recent years The characteristic line method has found a large number of applications in neutron transport programs. [0003] This method requires a fine mesh division of the calculated area, usually the shape of the divided grid is irregular, and may be composed of various forms of curves, such as straight lines, arcs, ellipse, etc. Before performing time-consuming transportation calculations, users usually need to judge wheth...

Claims


Application Information

Patent Timeline
Patent Type & Authority Applications(China)
IPC IPC(8): G06F17/50
CPCG06F30/20
Inventor 彭敏俊郑勇
Owner HARBIN ENG UNIV
Learn More