A kind of hairpin dna probe and its quantitative detection method for thrombin
A DNA probe and quantitative detection technology, which is applied in the field of analytical chemistry and molecular biology spectral analysis, can solve problems affecting the spectral properties of the system, and achieve effective quantitative detection, significant specificity, and simple and specific effects
- Summary
- Abstract
- Description
- Claims
- Application Information
AI Technical Summary
Problems solved by technology
Method used
Image
Examples
Embodiment 1
[0031] Correlation detection was performed using a spectrofluorometer. The base sequence of the hairpin DNA structure embedded with the thrombin aptamer is as follows: 5'-GAATTCTTAAAGGTTGGTGTGGTTGGAATTC-3'. Among them, 5'-GAATTCTTAAAGGTTGGTGTGGTTGGAATTC-3', GGTTGGTGTGGTTGG is the aptamer sequence of thrombin, the part formed by the pairing of 5'-GAATTC and 3'-CTTAAG is the stem part of the hairpin DNA stem-loop structure, and AATTCTTAAAGGTTGGTGTGGTTGG is the stem part with CTBA Complementary base sequence.
Embodiment 2
[0033] The method for the quantitative detection of thrombin by hairpin DNA probes includes the following steps: in a 1.5mL centrifuge tube, add 898 μL of thrombin solutions of different concentrations and H-eTBA ( 1 μL, 10 μM, react at 95°C for 10 minutes before the experiment, and then naturally cool to room temperature) solution. After incubating the reaction at 37°C for 25 min, CTBA solution (1 μL, 10 μM) was added, and the mixed solution was incubated at 37°C for 1 h. Finally, add MB solution (100 μL, 5×10 -5 M), and mix the reaction thoroughly and uniformly at room temperature. The total volume of the system is 1000 μL. Finally, the solution was placed on a fluorescence spectrophotometer, and resonance light scattering scanning was performed in the range of 225 to 700 nm with the same excitation and emission wavelengths to obtain a resonance light scattering spectrum for quantitative detection of thrombin. The excitation light slit width of the resonance light scatter...
Embodiment 3
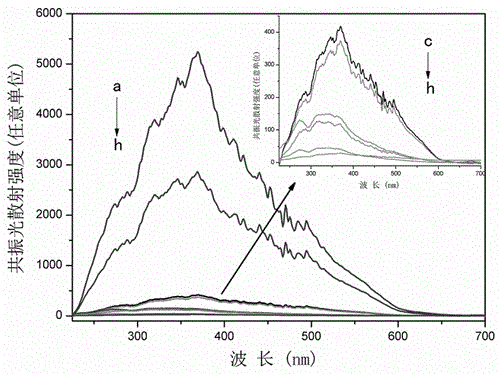
[0036] A series of comparative experiments a-h were used to characterize the resonance light scattering spectra of the system, and a comparative relationship diagram of the resonance light scattering intensity of the MB-DNA reaction system under different conditions was obtained. Where a is MB+H-eTBA+CTBA; b is MB+H-eTBA+CTBA+thrombin; c is MB+H-eTBA; d is MB+CTBA; e is MB+thrombin; f is thrombin; g is MB ; h is H-eTBA+CTBA. (where pH=7.40; MB: 5×10 -5 M; H-eTBA: 1 μL, 10 μM; CTBA: 1 μL, 10 μM; thrombin: 450.5 μg / L).
[0037] Depend on figure 2 It can be seen that the shape of the RLS curve is almost consistent from curve a to h, so the RLS peak at 370nm can be used as the characteristic absorption peak of the system for the quantitative detection of thrombin. Such as figure 2 As shown, the RLS signal intensity of MB+H-eTBA+CTBA (curve a) is stronger, while that of MB+H-eTBA, MB+CTBA, MB+thrombin, thrombin, MB and H-eTBA+CTBA (inset: curve c The RLS signal to h) is negl...
PUM
 Abstract
Description
Claims
Application Information
 - R&D
- Intellectual Property
- Life Sciences
- Materials
- Tech Scout
- Unparalleled Data Quality
- Higher Quality Content
- 60% Fewer Hallucinations
Browse by: Latest US Patents, China's latest patents, Technical Efficacy Thesaurus, Application Domain, Technology Topic, Popular Technical Reports.
© 2025 PatSnap. All rights reserved.Legal|Privacy policy|Modern Slavery Act Transparency Statement|Sitemap|About US| Contact US: help@patsnap.com


