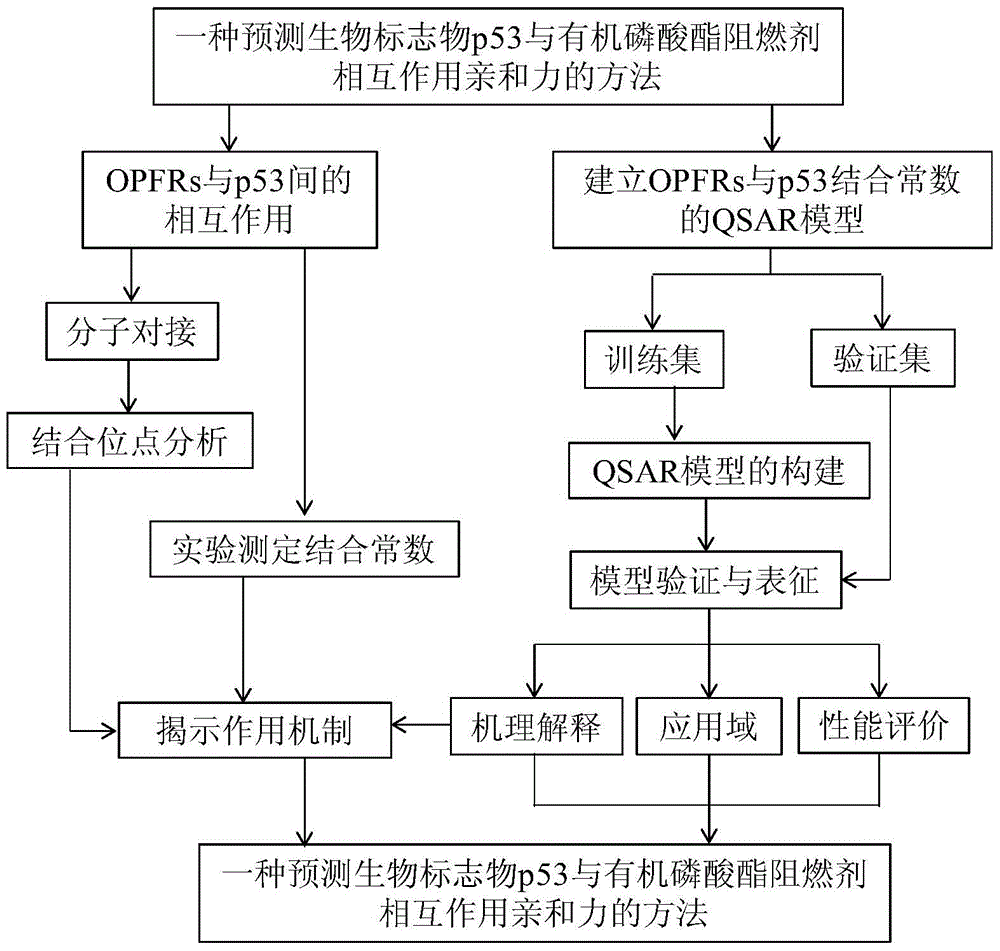
A method for predicting the interaction affinity of biomarker p53 with organophosphate flame retardants
An organic phosphate and biomarker technology, which is applied in special data processing applications, instruments, electrical digital data processing, etc., can solve problems such as inability to meet environmental supervision, and achieve easy understanding and practical application, good goodness of fit, The effect of strong transparency
- Summary
- Abstract
- Description
- Claims
- Application Information
AI Technical Summary
Problems solved by technology
Method used
Image
Examples
Embodiment 1
[0077] Given compound trichloroethyl phosphate (TCEP): Calculated by Williams graph method, its leverage value is 0.2965-3, indicating that this compound is in QSAR model application domain. Based on the mechanism of action, three descriptors (X) in the model are calculated according to the method described in the invention 5A 、MATS 7v 、Mor 17m ) values, respectively 0.121, 0.047, -0.395.
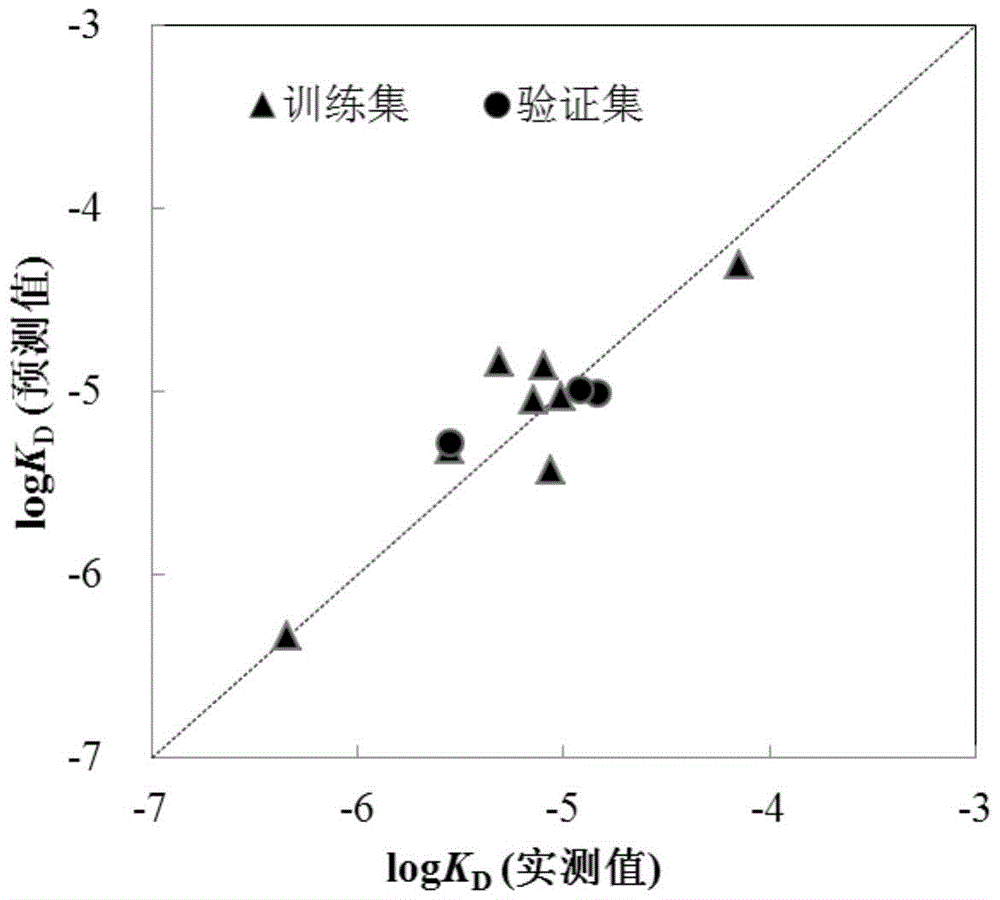
[0078] TCEP-p53 interaction affinity logK D The measured value of is: -5.55. The prediction steps based on the QSAR model are as follows:
[0079] logK D =-4.76+0.567×(0.121)+0.715×(0.047)+1.67×(-0.395)=-5.24. The predicted values are in good agreement with the measured values.
Embodiment 2
[0081] Given compound tris(1-chloro-2-propyl) phosphate (TCCP): Calculated by Williams graph method, its leverage value is 0.503-3, indicating that the compound is in the application domain of the QSAR model. Based on the mechanism of action, three descriptors (X) in the model are calculated according to the method described in the invention 5A 、MATS 7v 、Mor 17m ) values, respectively 0.089, -0.303, -0.061.
[0082] TCEP-p53 interaction affinity logK D The measured value of is: -5.02. The prediction steps based on the QSAR model are as follows:
[0083] logK D =-4.76+0.567×(0.089)+0.715×(-0.303)+1.67×(-0.061)=-4.99. The predicted values are in good agreement with the measured values.
Embodiment 3
[0085] The given compound triphenyl phosphate (TPP): Calculated using the Williams graph method, its leverage value is 0.4375A 、MATS 7v 、Mor 17m ) values, respectively 0.084, -0.081, 0.277.
[0086] TCEP-p53 interaction affinity logK D The measured value of is: -4.15. The prediction steps based on the QSAR model are as follows:
[0087] logK D =-4.76+0.567×(0.084)+0.715×(-0.081)+1.67×(0.277)=-4.38. The predicted values are in good agreement with the measured values.
PUM
 Abstract
Description
Claims
Application Information
 - R&D
- Intellectual Property
- Life Sciences
- Materials
- Tech Scout
- Unparalleled Data Quality
- Higher Quality Content
- 60% Fewer Hallucinations
Browse by: Latest US Patents, China's latest patents, Technical Efficacy Thesaurus, Application Domain, Technology Topic, Popular Technical Reports.
© 2025 PatSnap. All rights reserved.Legal|Privacy policy|Modern Slavery Act Transparency Statement|Sitemap|About US| Contact US: help@patsnap.com


