Method for rapidly analyzing rock debris fluorescence image

A fluorescence image, fast analysis technology, applied in image analysis, image data processing, earthwork drilling, etc., can solve the problems of long calculation time of ISODATA, inconsistency between clustering results and perception, inability to guarantee the integrity of training samples, etc. The effect of computational complexity, increased accuracy, and reduced workload

Active Publication Date: 2014-07-16
CNOOC ENERGY TECH & SERVICES +1
View PDF3 Cites 7 Cited by
  • Summary
  • Abstract
  • Description
  • Claims
  • Application Information

AI Technical Summary

Problems solved by technology

However, this method has the following problems: 1) The similarity of color features is determined by calculating the color distance, that is, the color difference, but because the RGB color space is not uniform, the clustering results do not match the perception, because the RGB components It not only represents the color, but also represents the degree of lightness and darkness, which leads to the possibility that the distance between similar colors may be large, but the distance between dissimilar colors may be small
In order to solve this problem, someone proposed an improved ISODATA weighted clustering algorithm, which is based on the HSL color space for component identification instead of the RGB color space, avoiding the non-uniformity of the RGB color space, and improving the clustering to a certain extent. However, there is still a small gap with the visual judgment. At the same time, affected by the characteristics of the clustering algorithm, in the case of many classification attributes and a large sample space, the calculation time of ISODATA is too long and it is easy to fall into the local optimum; During sub-training, most methods use the collected fluorescence images as training samples to calculate the number of clusters and cluster centers. When the integrity of the training samples cannot be guaranteed, the component training effect is often unsatisfactory.

Method used


Image

  • Method for rapidly analyzing rock debris fluorescence image
  • Method for rapidly analyzing rock debris fluorescence image
  • Method for rapidly analyzing rock debris fluorescence image

Examples


Embodiment Construction

[0022] The present invention will be described in detail below with reference to the drawings and embodiments.

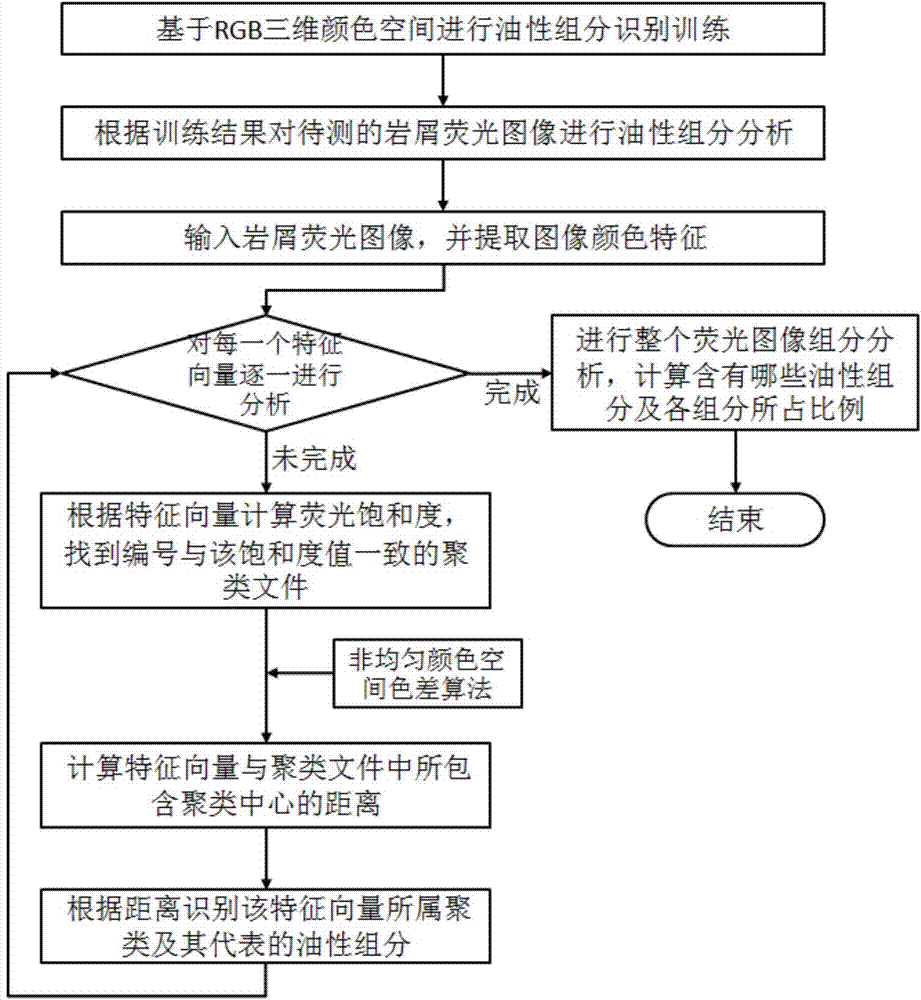
[0023] Such as figure 1 As shown, the method for rapidly analyzing the fluorescence image of cuttings of the present invention includes the following steps:

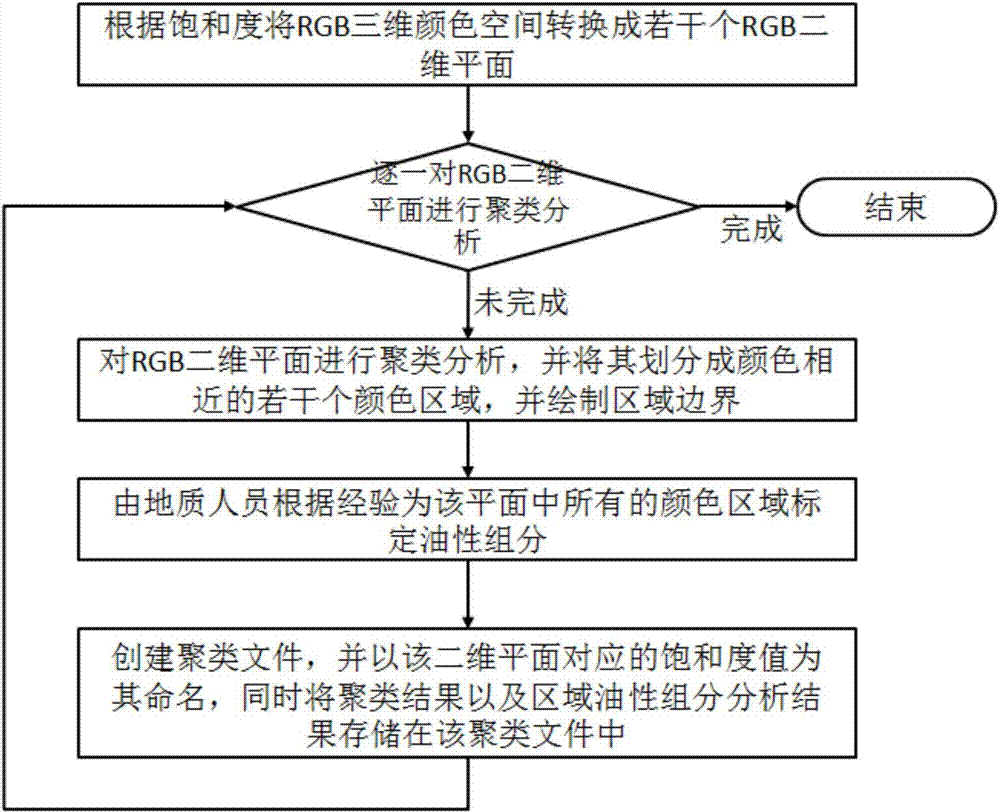
[0024] 1. Such as figure 2 As shown, the oil component recognition training is performed based on the RGB three-dimensional color space. The RGB three-dimensional color space is a color space obtained by mixing three primary colors of red, green, and blue to generate different colors. The value range of red, green, and blue is usually an integer between 0 and 255. The red component is defined as the X axis, the green component is defined as the Y axis, and the blue component is defined as the Z axis, so that a three-dimensional space is obtained. Each possible color has a unique position in this three-dimensional space. In order to avoid missing possible colors during the recognition training process, this recog...


PUM


Abstract

The invention relates to a method for rapidly analyzing a rock debris fluorescence image. The method comprises the following steps that (1) oily component identification training is carried out on the basis of RGB three-dimensional color space, so that a clustering file is obtained; (2) oily component analysis is carried out on the rock debris fluorescence image to be tested according to the clustering file obtained in the step (1). The oily component analysis process specifically comprises the following steps that (2.1) color feature extraction is carried out on the input rock debris fluorescence image to be tested, and a feature vector array is generated; (2.2) each feature vector in the feature vector array is analyzed; (2.3) after analysis work of all the feature vectors in the feature vector array is accomplished, oily components contained in the rock debris fluorescence image and the proportions of the oily components are obtained through calculation. According to a rock debris fluorescence layered clustering method based on non-uniform color space color difference calculation, the oily component identification result and the rock debris fluorescence image analysis result are accurate, oily component identification and rock debris fluorescence image analysis are rapid, the requirement of geological staff of an offshore platform for intelligentized well logging can be met, and therefore the method for rapidly analyzing the rock debris fluorescence image can be widely applied to the geological exploration and development process.

Description

Technical field [0001] The present invention relates to a cuttings oiliness analysis method, in particular to a method for rapid classification of cuttings fluorescence images based on non-uniform color space color difference calculation and color space hierarchical clustering suitable for real-time logging on offshore platforms . Background technique [0002] In the process of exploration and development, in order to accurately grasp the geological conditions of different strata, it is necessary to analyze the collected cuttings samples to obtain the lithology and oil properties of the strata. However, the oil content of cuttings, especially light oil and heavy oil, is usually difficult to observe with the naked eye. Therefore, fluorescence logging technology has emerged. This technology is currently widely used in the field of oil and gas layer identification and is generally considered to be better Cuttings analysis method. This method is mainly based on the fact that differ...

Claims


Application Information

Patent Timeline
Patent Type & Authority Applications(China)
IPC IPC(8): G06K9/62G06T7/00E21B49/00
Inventor 符耀庆刘耀华王亚楠苑舒斌麦文苏文辉赵伦刘换来晏菲陈金定杨宝伟沈雪峰
Owner CNOOC ENERGY TECH & SERVICES
Why Eureka
Try Eureka