A k-means nonlinear manifold clustering and representative point selecting method based on a graph theory
A nonlinear manifold and representative point technology, applied in the field of k-means nonlinear manifold clustering and representative point selection, can solve problems such as unfavorable large-scale application and complex optimization process
- Summary
- Abstract
- Description
- Claims
- Application Information
AI Technical Summary
Problems solved by technology
Method used
Image


Examples
Embodiment 1
[0040] Example 1: Manifold Clustering Case
[0041] In this embodiment, face images are clustered, and four groups of different face photos are selected, and each group includes 24 face photos of the same person, and each photo is taken under different angles, illumination and expressions, and finally each The size of the photos is normalized to 64×64, and then each image is arranged column by column into a 4096-dimensional column vector. A total of 96 face image vectors constitute a face dataset (hereinafter referred to as the dataset). First, use all the photos to construct a kNN graph (in order to reflect the reliability of the results more comprehensively, here k takes two values of 5 and 10 to operate once respectively). The specific implementation process is as follows:
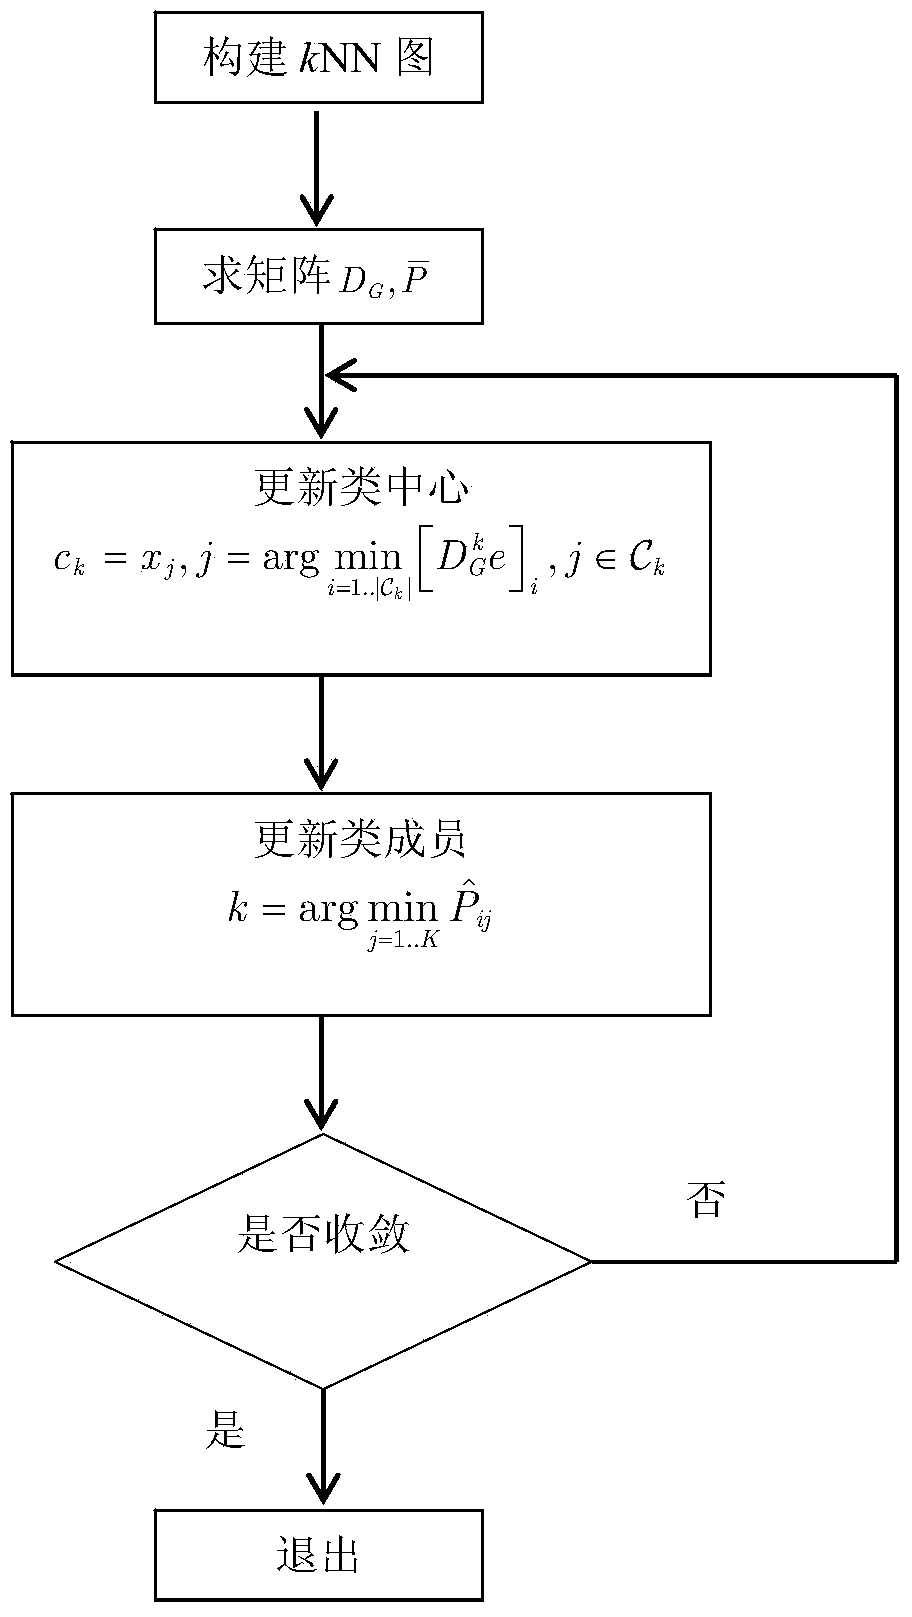
[0042] 1. Build a kNN graph. Each vector in the data set is used as a node of the graph, and the adjacent nodes are defined as follows: according to the Euclidean distance, each node is connected to...
Embodiment 2
[0052] Example 2: A case of representative point selection
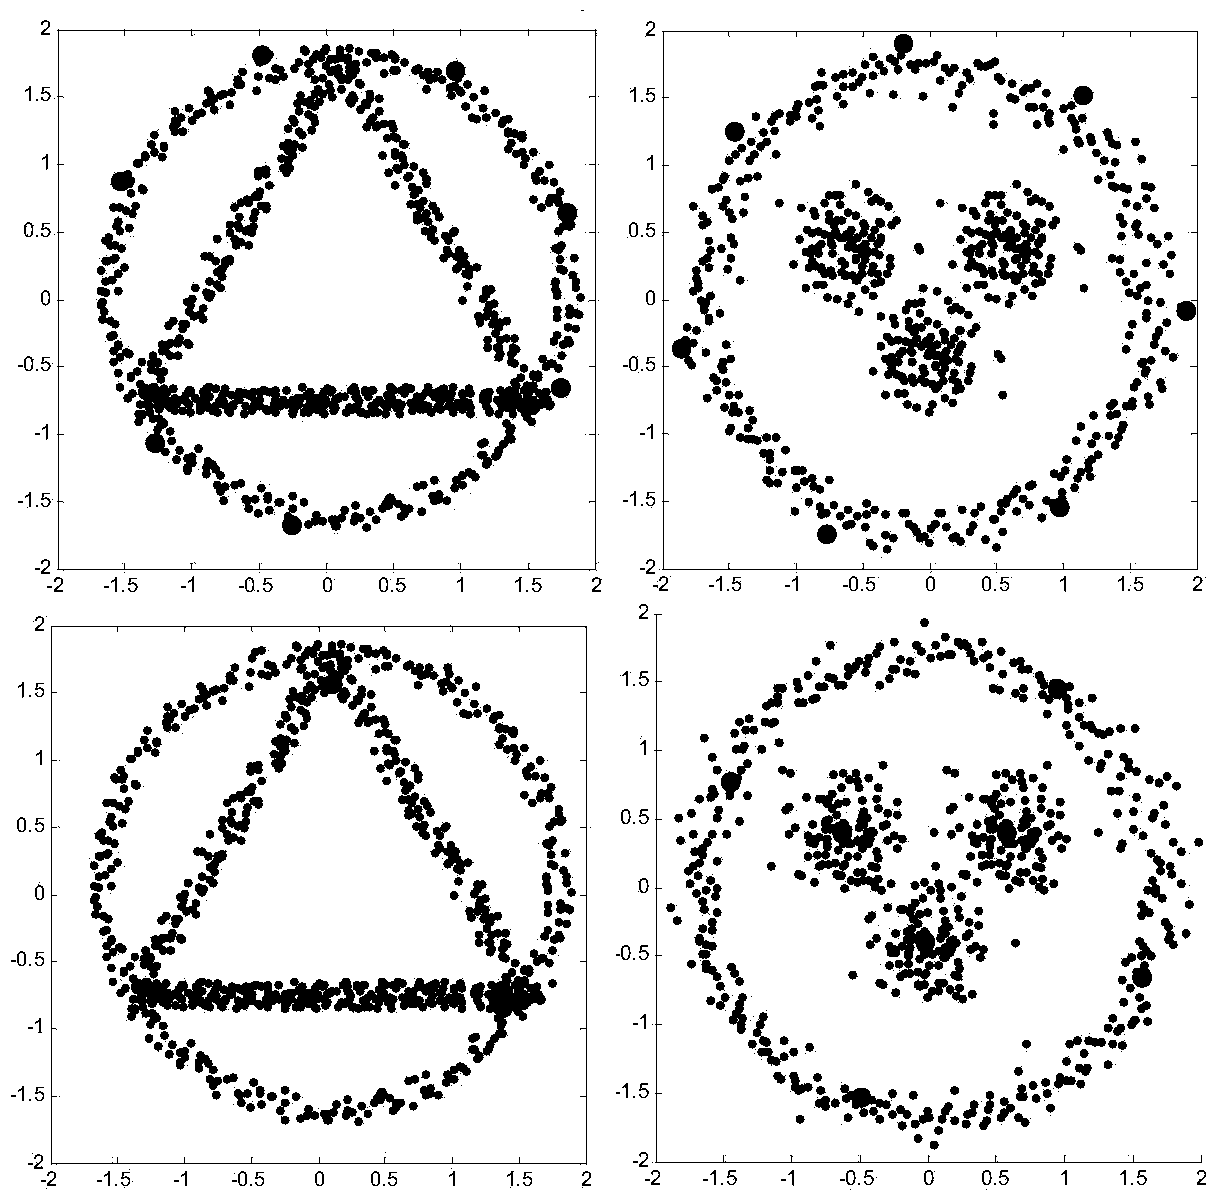
[0053] In order to verify the performance of the present invention in the selection of representative points, this embodiment is tested on 2 artificially synthesized data sets and 4 actual data sets. According to the given number of representative points K, the specific implementation process is as follows:
[0054] 1. Build a kNN graph. Each vector in the data set is used as a node of the graph, and the adjacent nodes are defined as follows: according to the Euclidean distance, each node is connected to the k nodes closest to it in the data set;
[0055] 2. Calculate the graph matrix and graph distance matrix. The calculation method of the adjacency matrix W of the graph is as follows: if the i-th node is adjacent to the j-th node, the (i, j)th element of W is set Where σ is the Gaussian kernel function parameter, which varies from dataset to dataset; if the i-th node is not adjacent to the j-th node, the (i,j)t...
PUM
 Abstract
Description
Claims
Application Information
 - R&D
- Intellectual Property
- Life Sciences
- Materials
- Tech Scout
- Unparalleled Data Quality
- Higher Quality Content
- 60% Fewer Hallucinations
Browse by: Latest US Patents, China's latest patents, Technical Efficacy Thesaurus, Application Domain, Technology Topic, Popular Technical Reports.
© 2025 PatSnap. All rights reserved.Legal|Privacy policy|Modern Slavery Act Transparency Statement|Sitemap|About US| Contact US: help@patsnap.com