System and method for electric configuration graph display
A graphic display, power group technology, applied in electrical digital data processing, instruments, text database browsing/visualization, etc., can solve problems such as failure to meet regulatory requirements for energy conservation and emission reduction, inability to interact with configuration diagrams, and lack of configuration tools.
- Summary
- Abstract
- Description
- Claims
- Application Information
AI Technical Summary
Problems solved by technology
Method used
Image

Examples
Embodiment 1
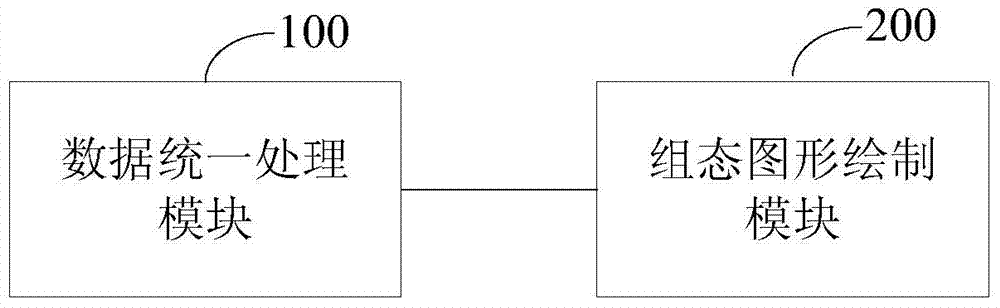
[0050] Embodiment 1 of the present invention discloses a power configuration graphic display system, such as figure 1 As shown, it includes a unified data processing module 100 and a configuration graph drawing module 200 .
[0051] The data unified processing module 100 is used to receive the system data of the electric power enterprise, and when the data format of the system data is different from the preset data format, process the system data into the preset data format, and pass The data interface connects the system data conforming to the preset data format to the configuration graphic drawing module.
[0052] Wherein, the system data sent by the power company includes system data of Haixun database and system data of PI database, and may also include system data of other real-time databases. The system specifically includes a desulfurization system, a denitrification system, a power plant energy consumption system and a power plant discharge system.
[0053] The unifi...
Embodiment 2
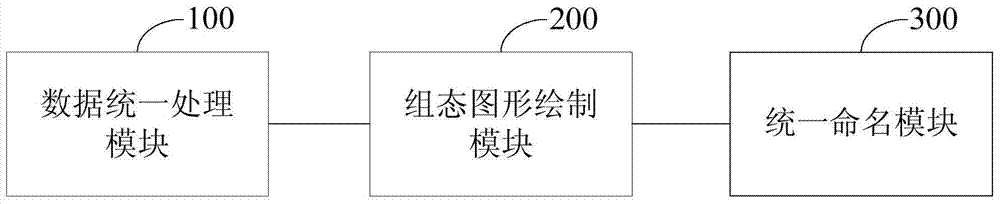
[0063] Embodiment 2 of the present invention discloses another structure of the power configuration graphic display system, please refer to figure 2 In addition to the unified data processing module 100 and the configuration graphic drawing module 200 of the power configuration graphic display system in the first embodiment, it also includes a unified naming module 300, and the unified naming module 300 is used for drawing based on a preset naming convention. The configuration graphics are named uniformly.
[0064] This embodiment is the subsequent processing of the configuration graphics after the drawing and display of the configuration graphics is completed. Specifically, a naming convention can be established in advance, and the drawn configuration graphics can be uniformly named according to the established naming convention, so as to facilitate centralized management and viewing.
Embodiment 3
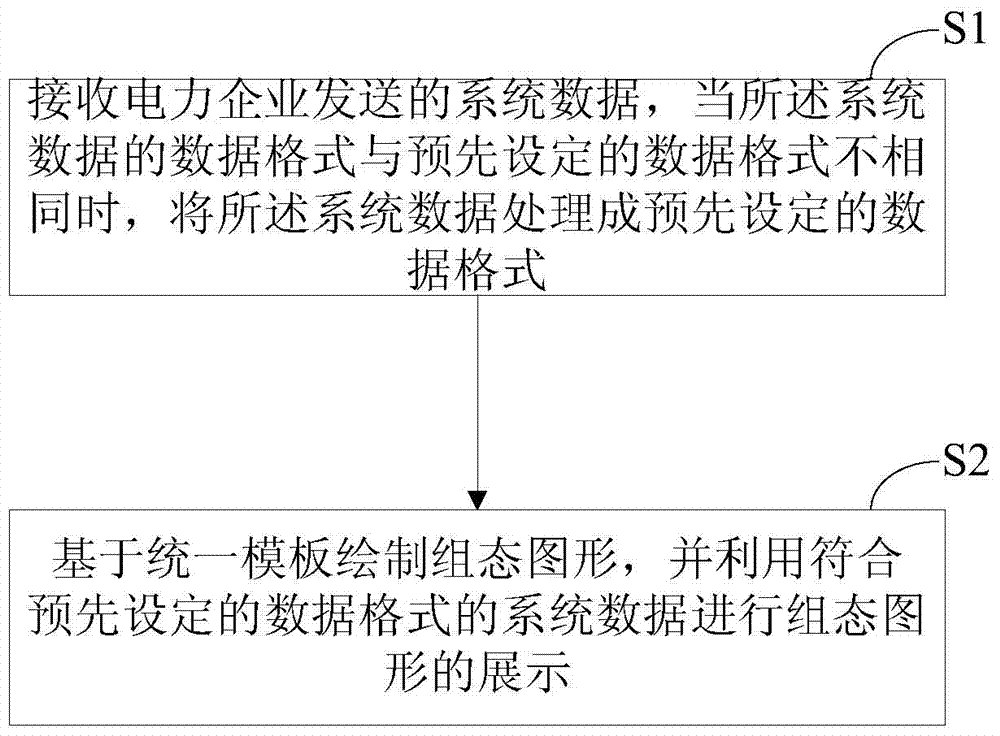
[0066] Embodiment 3 of the present invention discloses a power configuration graphic display method based on the power configuration graphic display system of Embodiment 1 and Embodiment 2. Please refer to image 3 , the power configuration graphic display method includes:
[0067] S1: Receive the system data sent by the power company, and process the system data into the preset data format when the data format of the system data is different from the preset data format.
[0068] When the format of the received system data is the same as the preset data format, no processing will be done.
[0069] S2: Draw the configuration graphics based on the unified template, and use the system data conforming to the preset data format to display the configuration graphics.
[0070] Drawing configuration graphics based on a unified template includes: first obtaining the system parameters of the system, and specifically obtaining the system parameters of the corresponding desulfurization s...
PUM
 Abstract
Description
Claims
Application Information
 - R&D
- Intellectual Property
- Life Sciences
- Materials
- Tech Scout
- Unparalleled Data Quality
- Higher Quality Content
- 60% Fewer Hallucinations
Browse by: Latest US Patents, China's latest patents, Technical Efficacy Thesaurus, Application Domain, Technology Topic, Popular Technical Reports.
© 2025 PatSnap. All rights reserved.Legal|Privacy policy|Modern Slavery Act Transparency Statement|Sitemap|About US| Contact US: help@patsnap.com