Separation and recognition algorithm for transformer oiled paper insulation multiple partial discharging source signals
A transformer oil and identification algorithm technology, applied in the direction of testing dielectric strength, etc., can solve the problem of inability to identify and diagnose signals of multiple partial discharge sources
- Summary
- Abstract
- Description
- Claims
- Application Information
AI Technical Summary
Problems solved by technology
Method used
Image
Examples
Embodiment 1
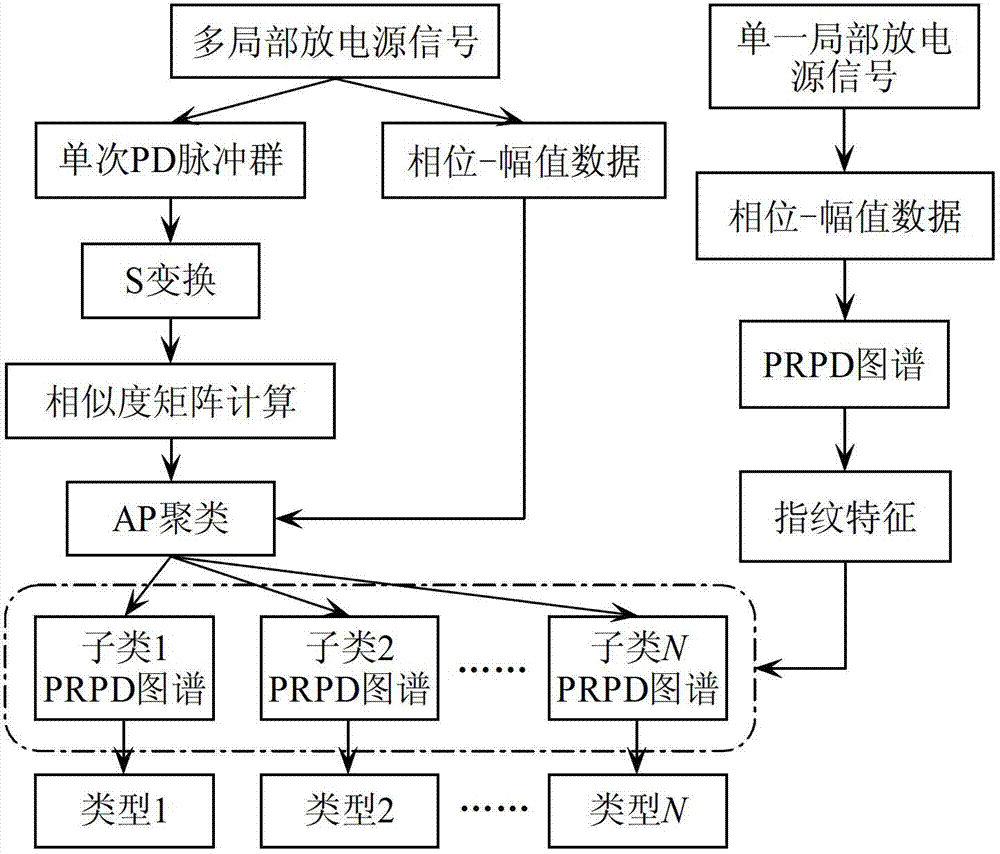
[0053] figure 1 It is a multi-partial discharge source identification flow chart, as shown in the figure: a transformer oil-paper insulation multi-partial discharge source signal separation and identification algorithm provided by the present invention includes the following steps:
[0054] S1: Collect multiple partial discharge source signals and single partial discharge source signals;
[0055] S2: Analyze multiple partial discharge source signals to obtain single PD pulse group and phase-amplitude matrix data;
[0056] S3: Calculate the similarity of a single PD pulse group and generate a similarity matrix;
[0057] S4: Clustering the phase amplitude matrix data combined with the similarity matrix through neighbor propagation clustering and generating subclass pulse PRPD map data;
[0058]S5: Identify subtype pulse PRPD spectrum data according to the PRPD spectrum fingerprint feature of a single partial discharge source signal and separate multiple partial discharge sourc...
Embodiment 2
[0089] The difference between this embodiment and embodiment 1 is only:
[0090] In this embodiment, three artificial models are designed for simulating transformer oil-paper insulation defects: creeping discharge model, corona discharge model and interlayer discharge model.
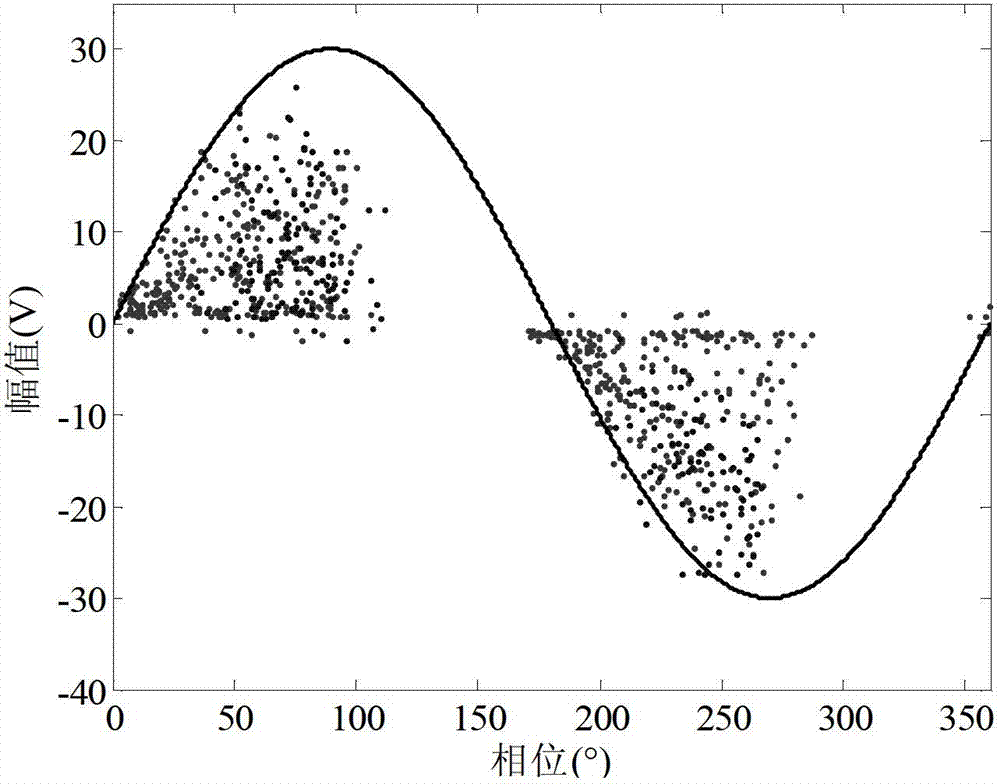
[0091] figure 2 It is the PRPD spectrum after artificially synthesizing the signals of creeping discharge and corona discharge. The sampling voltage is 22kV, and the sampling rate is 100MS / s, including 567 pulses of creeping discharge and 235 pulses of corona discharge.
[0092] The first step of the algorithm is to calculate the similarity matrix, and the dimension of the S-transform magnitude matrix (STA) is 100×200. The damping factor λ=0.5 is selected to prevent the oscillation in the nearest neighbor propagation clustering algorithm (APC). At the same time, set the reference vector p as p(1)=p(2)=...=p(i)=...=p(802)=-20. After iterative operation, the APC algorithm automatically gives the separa...
Embodiment 3
[0095] The difference between this embodiment and embodiment 1 is only:
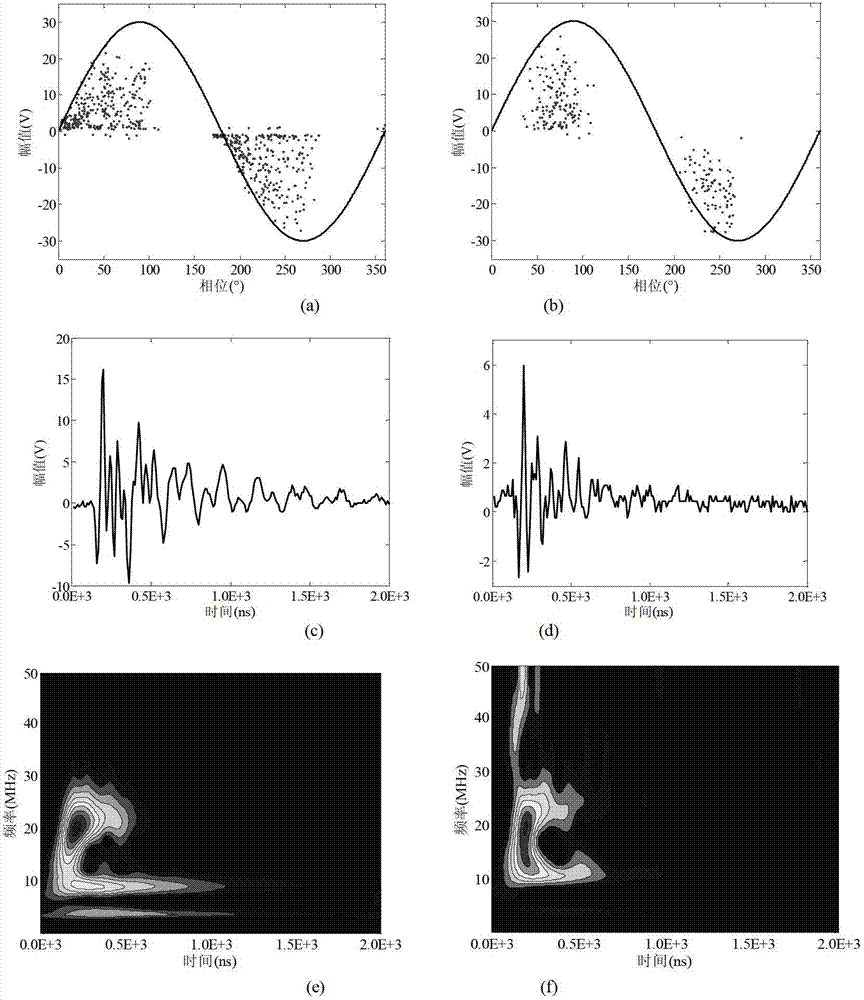
[0096] Figure 4 The PRPD spectrum after artificial synthesis of corona and interlayer discharge signals is given. The sampling voltage of corona discharge is 19kV, the sampling voltage of interlayer discharge is 10kV, and the sampling rate is 100MS / s. The collected signals contain 416 Corona discharge pulses and 854 interlayer discharge pulses.
[0097] Also select the damping factor λ=0.5, and set the reference vector p to p(1)=p(2)=...=p(i)=...=p(802)=-20. After iterative operation, the separation results obtained by the APC algorithm are as follows: Figure 5 shown. The number of pulses in group 1 and group 2 are 411 and 859, respectively. By observation, the pulses in group 1 mainly come from corona discharge, while the pulses in group 2 mainly come from interlayer discharge. The correct rate of separation of PD signal was calculated to be 98.35%.
PUM
 Abstract
Description
Claims
Application Information
 - R&D Engineer
- R&D Manager
- IP Professional
- Industry Leading Data Capabilities
- Powerful AI technology
- Patent DNA Extraction
Browse by: Latest US Patents, China's latest patents, Technical Efficacy Thesaurus, Application Domain, Technology Topic, Popular Technical Reports.
© 2024 PatSnap. All rights reserved.Legal|Privacy policy|Modern Slavery Act Transparency Statement|Sitemap|About US| Contact US: help@patsnap.com


