Frequency deviation and phase deviation combination measurement method and apparatus thereof
A phase deviation and frequency deviation technology, which is applied in the field of mobile communication terminal testing, can solve the problems of high computational complexity, low frequency resolution, and low resolution, and achieve low computational complexity, high measurement accuracy, and high algorithm efficiency. Effect
- Summary
- Abstract
- Description
- Claims
- Application Information
AI Technical Summary
Problems solved by technology
Method used
Image
Examples
Embodiment 1
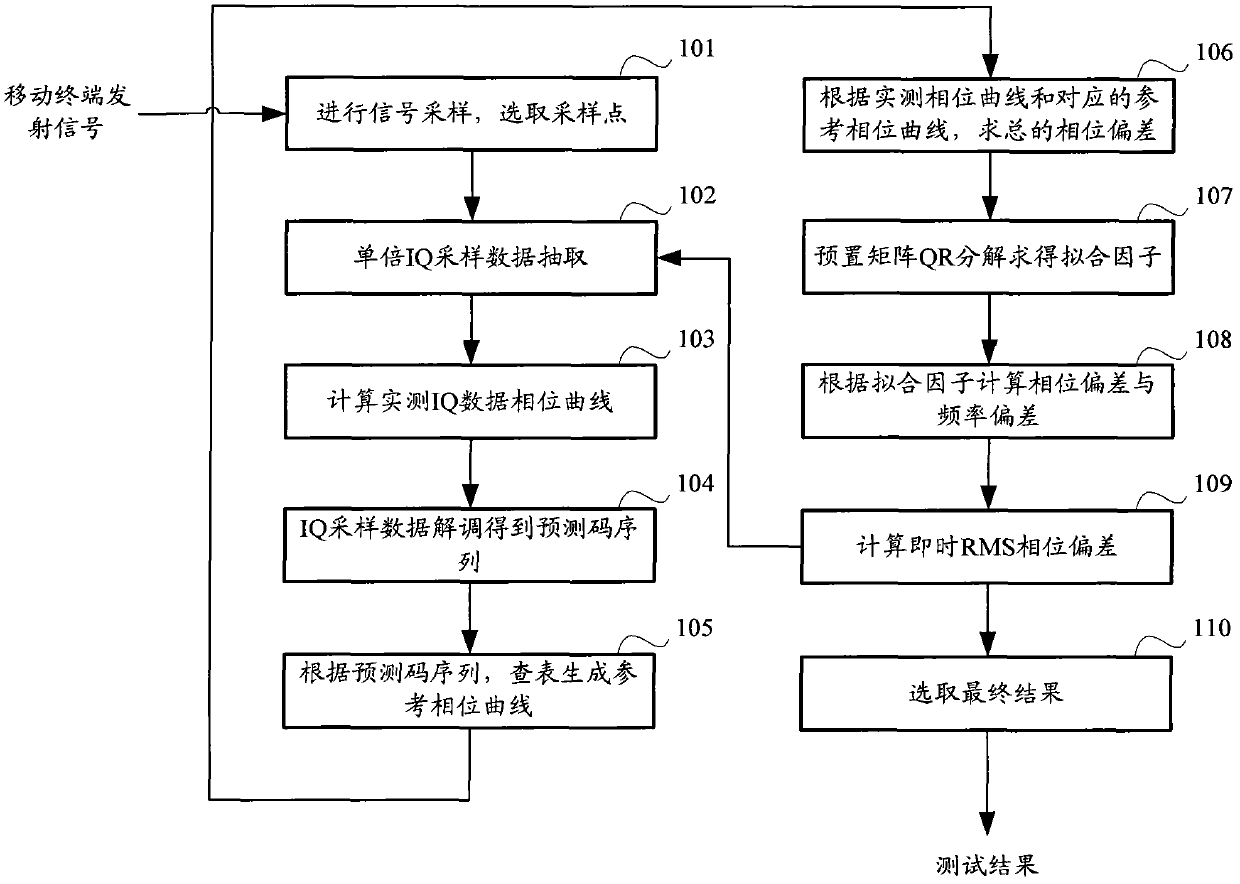
[0038] See figure 1 , Is a schematic flow chart of the joint measurement of frequency deviation and phase deviation provided in the first embodiment of the present invention. As shown in the figure, the flow may include:
[0039] Step 101: The test equipment samples the transmitted signal of the tested mobile terminal.
[0040] Specifically, the test equipment and the mobile terminal under test use the training sequence code (TSC) for channel estimation to complete the high-speed (48-speed sampling in this embodiment) sampling signal synchronization to obtain the best synchronization position SYNC. SYNC includes not only the starting bit position information of the matched Active Part, but also the best matching sample point among the 48 sample points of a bit. Here, taking SYNC as the center, scan m sampling points on the left and right sides, a total of 2m+1 sampling points, each of which is the best sampling point, and 2m+1 sets of sampling multiples of length N are extracted a...
Embodiment 2
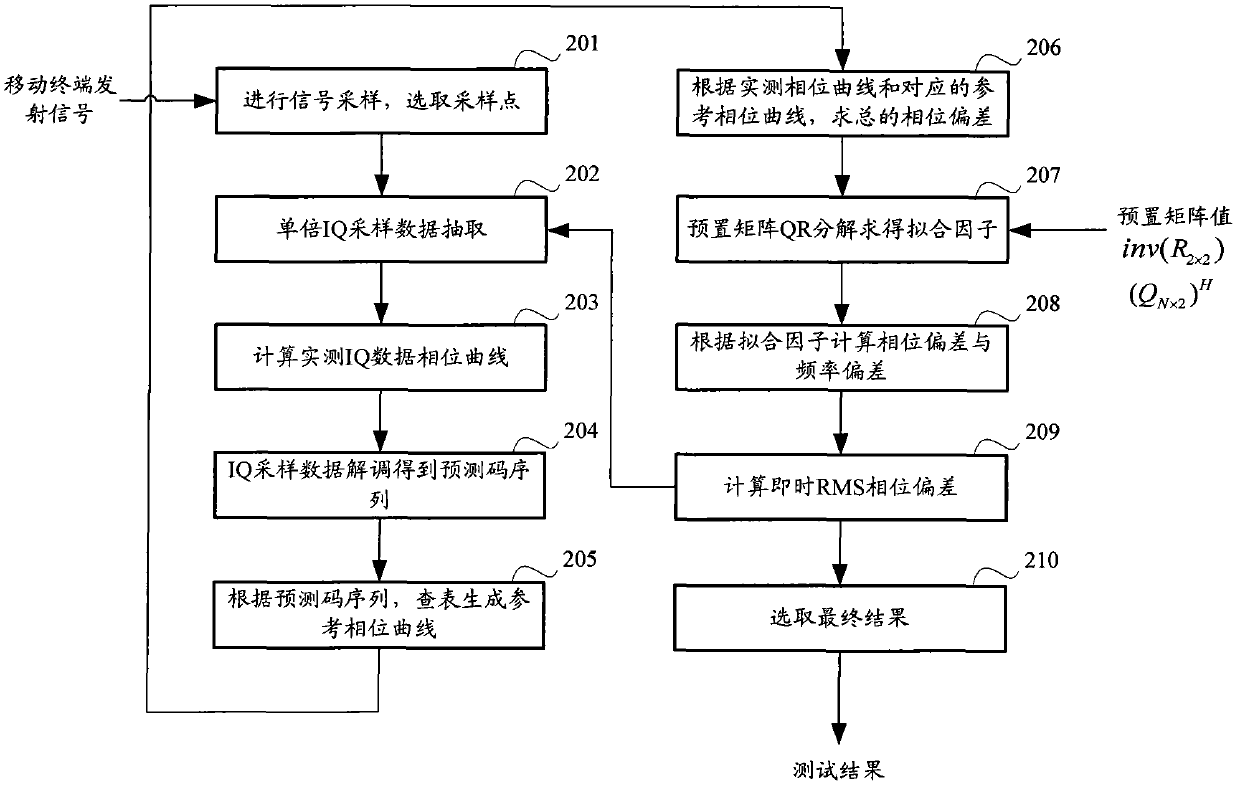
[0072] In order to further simplify the operation and improve the processing efficiency, further improvements are made on the basis of the first embodiment above, and the second embodiment is obtained. Specifically, the difference between the second embodiment and the first embodiment is:
[0073] In the least squares solution of the construction matrix equation in advance, the matrix Q formed by the first 2 column vectors of the Q matrix is solved N×2 And the first 2 row vectors of the R matrix R 2×2 , The calculation matrix inv(R 2×2 ) And (Q N×2 ) H , And add the calculated matrix inv(R 2×2 ) And (Q N×2 ) H The value is stored. In this way, when testing, the pre-stored matrix inv(R 2×2 ) And (Q N×2 ) H According to the formula P 2×1 =inv(R 2×2 )×(Q N×2 ) H ×y N×1 Calculate the fitting factor vector P 2×1 .
[0074] The processing flow of the second embodiment can be as follows figure 2 As shown, I will not repeat them here.
[0075] The principle analysis is ...
PUM
 Abstract
Description
Claims
Application Information
 - R&D
- Intellectual Property
- Life Sciences
- Materials
- Tech Scout
- Unparalleled Data Quality
- Higher Quality Content
- 60% Fewer Hallucinations
Browse by: Latest US Patents, China's latest patents, Technical Efficacy Thesaurus, Application Domain, Technology Topic, Popular Technical Reports.
© 2025 PatSnap. All rights reserved.Legal|Privacy policy|Modern Slavery Act Transparency Statement|Sitemap|About US| Contact US: help@patsnap.com


