
Method for detecting concentration of nano particles in solution by nephelometry

A nanoparticle and detection method technology, which is applied in measurement devices, suspension and porous material analysis, material analysis by observing the effect on chemical indicators, etc. The effect of introducing fewer error links and simple analysis

Inactive Publication Date: 2012-02-01
NANJING UNIV OF SCI & TECH
View PDF4 Cites 28 Cited by
  • Summary
  • Abstract
  • Description
  • Claims
  • Application Information

AI Technical Summary

Problems solved by technology

However, none of these reports analyzed the concentration of particles at nano-sized

Method used

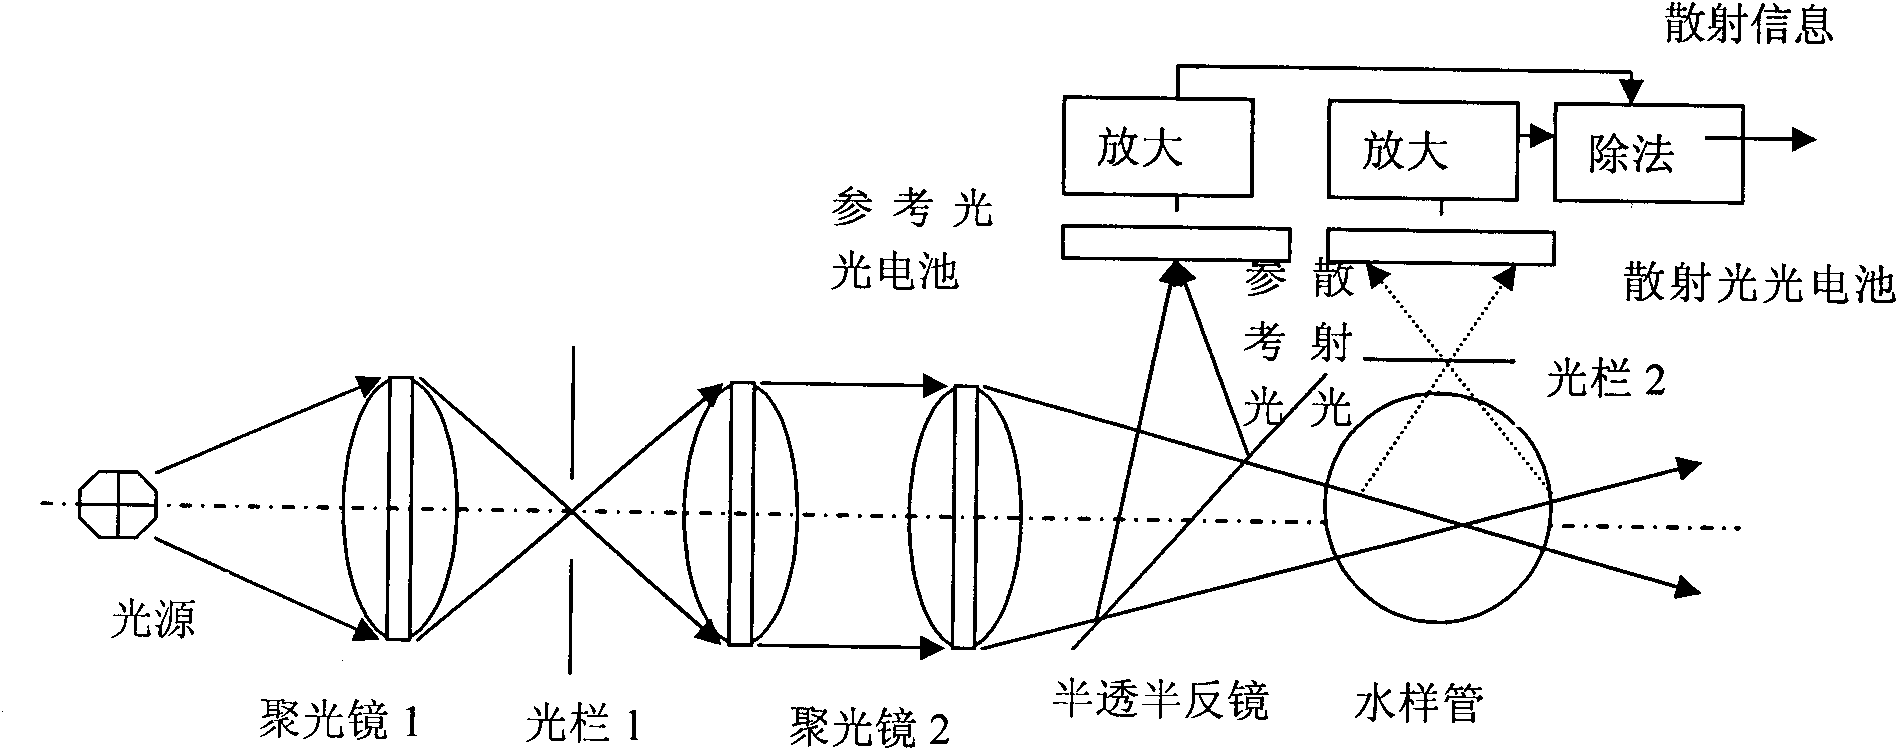

Image

  • Method for detecting concentration of nano particles in solution by nephelometry
  • Method for detecting concentration of nano particles in solution by nephelometry
  • Method for detecting concentration of nano particles in solution by nephelometry

Examples


Embodiment 1

[0075] Embodiment 1: the concentration detection of nano titanium dioxide solution

[0076] (1) First prepare a standard nano-titanium dioxide dispersion (10mg / L): Accurately weigh 0.0050g of a nano-titanium dioxide standard sample (take nano-titanium dioxide particles consistent with the properties of the sample to be tested) in a 500mL volumetric flask, add twice distilled water, Dilute to the scale line, shake well, and disperse by ultrasonic for 15 minutes (ultrasonic power is 80%×150W).

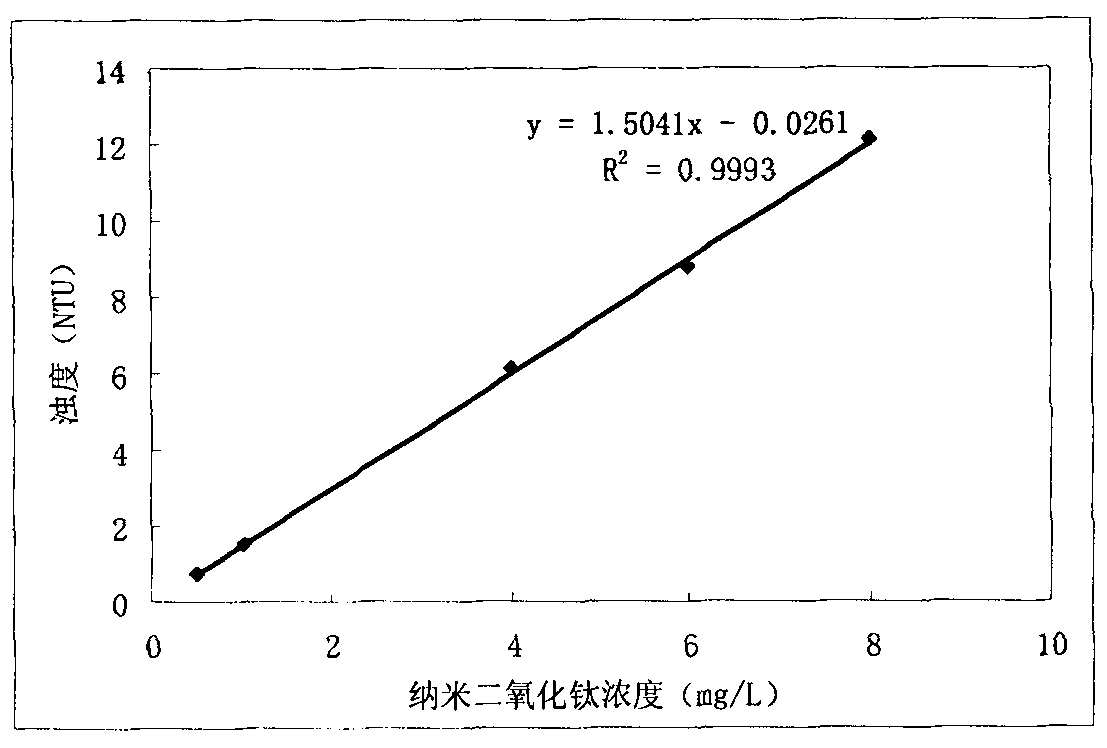
[0077] (2) Then draw the calibration curve: Take five 100mL volumetric flasks, add 5.0mL, 10.0mL, 40.0mL, 60.0mL, 80.0mL of 10mg / L nano-titanium dioxide standard dispersion respectively, and distill the volume to the mark with distilled water, shake well , the concentrations of the prepared nano titanium dioxide dispersions are 0.5mg / L, 1.0mg / L, 4.0mg / L, 6.0mg / L, 8.0mg / L respectively. Pipette the standard series of dispersions into a 1cm colorimetric cell, and measure the turbidity of t...

Embodiment 2

[0088] Example 2: Detection of the concentration of nano-titanium dioxide particles in the sewage of nano-titanium dioxide production enterprises

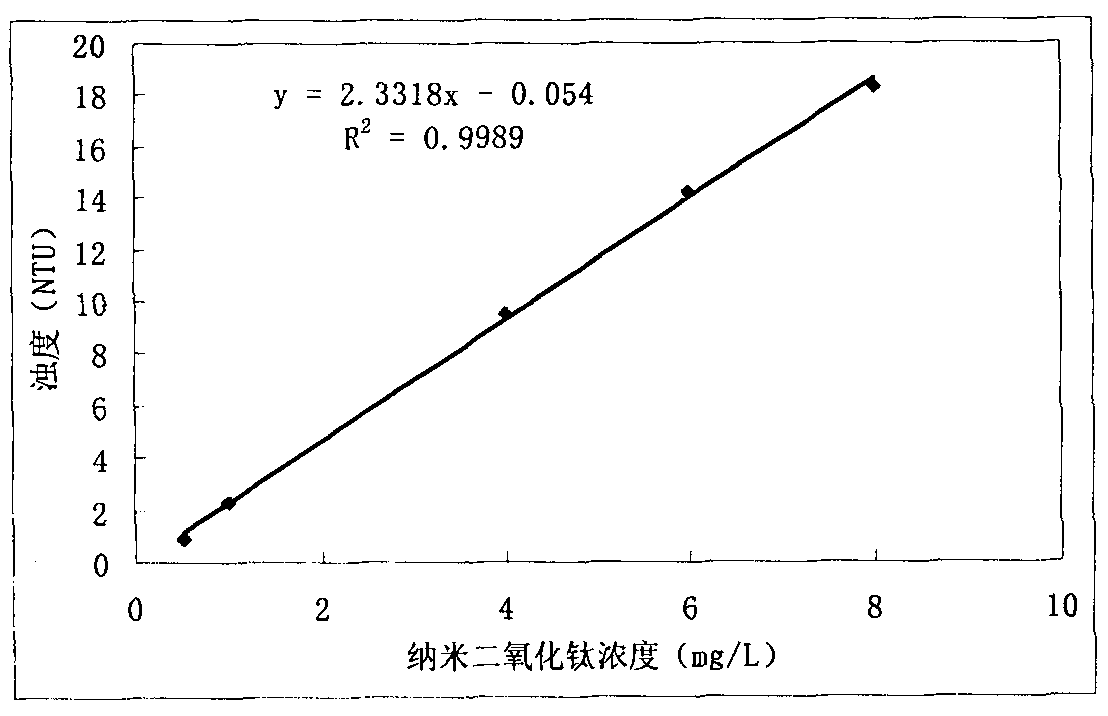
[0089] Repeat the method of Example 1, but replace the nano-titanium dioxide solution sample with the enterprise sewage sample. For the drawn calibration curve see image 3 , and the specific test results are listed in Table 2.

Embodiment 3

[0090] Example 3: Detection of nano-titanium dioxide dust content in the air environment of the workshop of nano-titanium dioxide production enterprises

[0091] Repeat the method of Example 1, but get 5 100mL volumetric flasks when drawing the calibration curve, add respectively 5.0mL, 20.0mL, 40.0mL, 60.0mL, 80.0mL of 10mg / L nano-titanium dioxide standard dispersion liquid, and distilled water to volume to scale, shake well, and the concentrations of the prepared nano-titanium dioxide dispersions are 0.5mg / L, 2.0mg / L, 4.0mg / L, 6.0mg / L, 8.0mg / L respectively.

[0092] Use the wet sampler to replace the sample of nano-titanium dioxide solution with the collection liquid after collecting nano-aerosol (dust) particles in the air environment of nano-material production enterprises, and increase the calculation of the concentration of nano-titanium dioxide dust in the production environment.

[0093] c=[(c 0 ×V 1 ) / (η×V 2 )]×1000

[0094] In the formula:

[0095] C- the concentr...


PUM


Abstract

The invention discloses a method for detecting a concentration of nano particles in solution by a nephelometry, which comprises the following steps of: a first step of preparing standard dispersed solution and carrying out ultrasonic dispersion to form uniform standard dispersed solution for later use; a second step of drawing a calibration curve between the concentration of the nano particles and the turbidity, calculating to obtain a standard curvilinear equation, and returning to the first step to restart if the linearity r of the calibration curve is lower than 0.999; and a third step of measuring the concentration of the nano particles in a sample to be measured, placing the sample to be measured into an ultrasonic water bath to carry out ultrasonic dispersion, taking and moving uniformly dispersed solution to be measured into a cuvette cell of a turbidity meter, measuring to obtain a turbidity value of the solution to be measured on a nephelometer by taking a liquid solvent difficult to volatilize as a blank reference, and obtaining the corresponding concentration value of the nano particles according to the calibration curvilinear equation obtained in the second step. The method has the characteristics of strong pertinence, simple, visual and rapid analysis method, capability of field analysis, high precision and accuracy and the like and also serves for enterprises which produce and apply nano materials.

Description

technical field [0001] The invention relates to a method for detecting the mass concentration of nanoparticles in a solution, in particular to a method for detecting the mass concentration of nanoparticles in a solution by a turbidity method. [0002] This method is mainly applicable to the detection method of the mass concentration of nanoparticles in a solution containing a certain amount of certain nanoparticles, or in a solution where certain nanoparticles account for most of the particle content in the solution. For example, the liquid raw materials, liquid products, and sewage discharged by a specific nanomaterial production or application enterprise, or after using a wet sampler to collect nano-aerosol (dust) particles in the air environment of a nanomaterial production or application enterprise, the quality of the nanoparticles in the collection liquid Concentration turbidimetric detection method. Background technique [0003] Compared with conventional granular mat...

Claims


Application Information

Patent Timeline
IPC IPC(8): G01N15/08G01N21/82
Inventor 杨毅张晋华陈守文王正萍沈文玉王声燕
Owner NANJING UNIV OF SCI & TECH
Learn More