Chromatographic method for flow switching analysis of benzene and toluene in motor gasoline
A technology of flow switching and gasoline for vehicles, which is applied in the field of gas chromatographic analysis, can solve the problems of difficult establishment and large dead volume of the valve switching system, and achieve the effects of easy establishment and operation, good precision, and good technical effects
- Summary
- Abstract
- Description
- Claims
- Application Information
AI Technical Summary
Problems solved by technology
Method used
Image
Examples
Embodiment 1
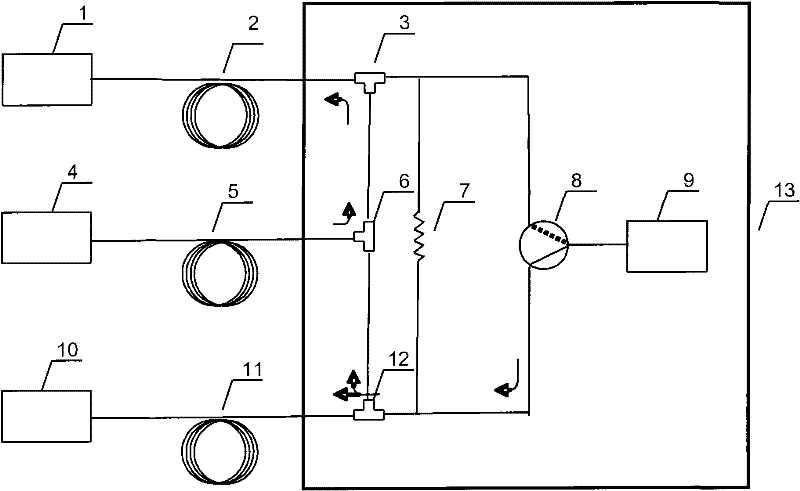
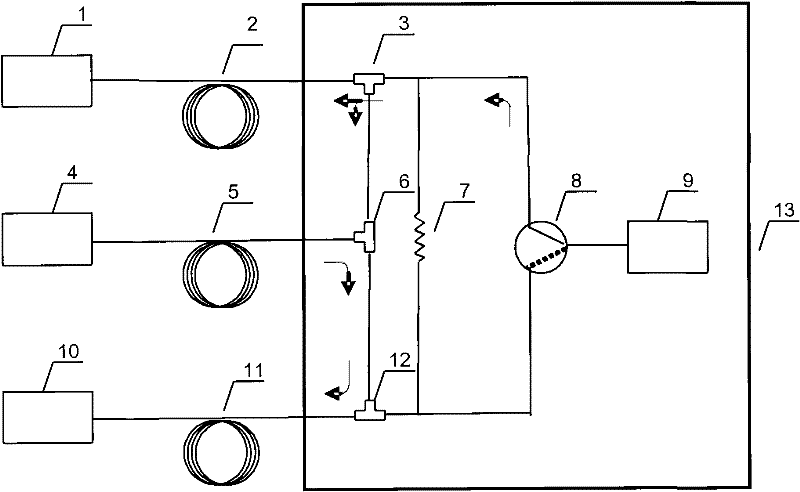
[0017] According to the flow chart in Figure 1, the standard sample containing benzene and toluene was analyzed, and the typical chromatographic analysis conditions are shown in Table 1. Among them, the standard sample 1 # ~7 # Draw a calibration curve, and then use standard sample 2 # and 5 # As the sample to be tested, benzene and toluene were quantitatively calculated from the calibration curve. The composition and analysis results of the standard samples are shown in Table 2.
[0018] Table 1 Typical chromatographic analysis conditions
[0019]
[0020] Table 2 standard sample analysis results
[0021]
[0022] The analytical data of table 2 shows that the correlation coefficient r of the calibration curve of benzene and toluene 2 They are 0.9994 and 0.9999 respectively, and the linear relationship is good. The relative error of the standard sample determination is between -6.06% and 3.20%.
Embodiment 2
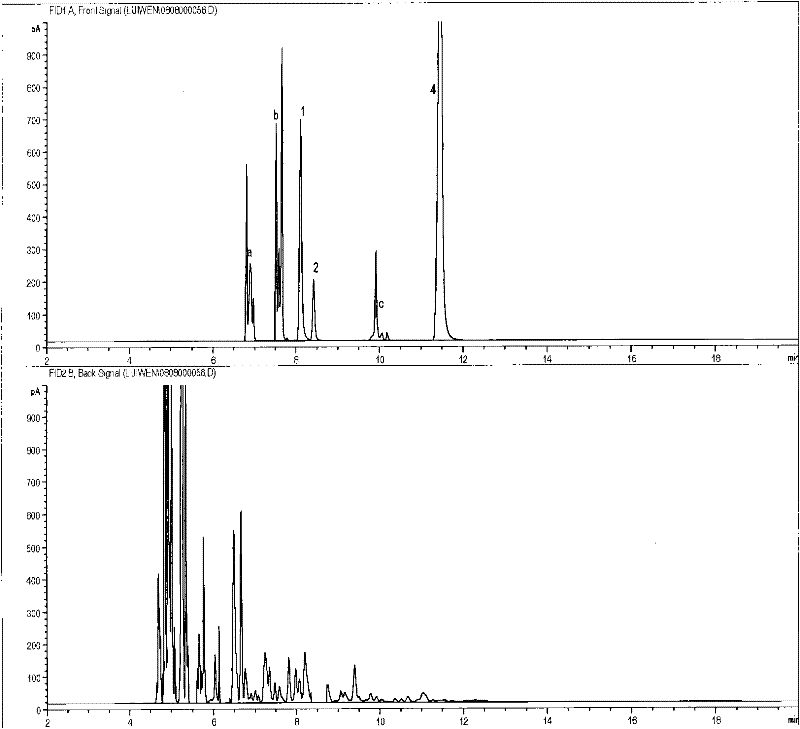
[0024] According to the flow chart in Figure 1, analyze the 93# automotive unleaded gasoline sample A and 93# automotive ethanol gasoline sample B sold on the market, and compare the analysis results with the standard method SH / T 0713-2002. Typical chromatographic analysis conditions are shown in Table 3, and the chromatograms are shown in figure 2 , the results of quantitative analysis are shown in Table 4. The spiked sample (a certain concentration of benzene and toluene added to 93# unleaded gasoline sample A and 93# ethanol gasoline sample B) was analyzed, and the quantitative analysis results are shown in Table 4.
[0025] Table 3 typical chromatographic analysis conditions
[0026]
[0027] Table 4 Analysis results of actual gasoline samples
[0028]
[0029] The analysis data of table 4 illustrates that the quantitative analysis result of the analytical method of the present invention is consistent with the quantitative analysis result of standard method SH / T 0...
PUM
| Property | Measurement | Unit |
|---|---|---|
| correlation coefficient | aaaaa | aaaaa |
| recovery rate | aaaaa | aaaaa |
Abstract
Description
Claims
Application Information
 - R&D
- Intellectual Property
- Life Sciences
- Materials
- Tech Scout
- Unparalleled Data Quality
- Higher Quality Content
- 60% Fewer Hallucinations
Browse by: Latest US Patents, China's latest patents, Technical Efficacy Thesaurus, Application Domain, Technology Topic, Popular Technical Reports.
© 2025 PatSnap. All rights reserved.Legal|Privacy policy|Modern Slavery Act Transparency Statement|Sitemap|About US| Contact US: help@patsnap.com


