
System and method for predicting runway risk levels using weather forecast data and displaying multiple risk indicators comprising graphical risk indicators

a risk level and weather forecast technology, applied in the field of system and method for predicting risk levels associated with airport runways, can solve the problems of insufficient information provided by current forecast system outputs, and the inability of air traffic controllers or flight dispatchers to quickly generate flight schedules, so as to achieve quick and easy generation of flight schedules

Active Publication Date: 2017-08-08
THE BOEING CO
View PDF7 Cites 1 Cited by
  • Summary
  • Abstract
  • Description
  • Claims
  • Application Information

AI Technical Summary

Benefits of technology

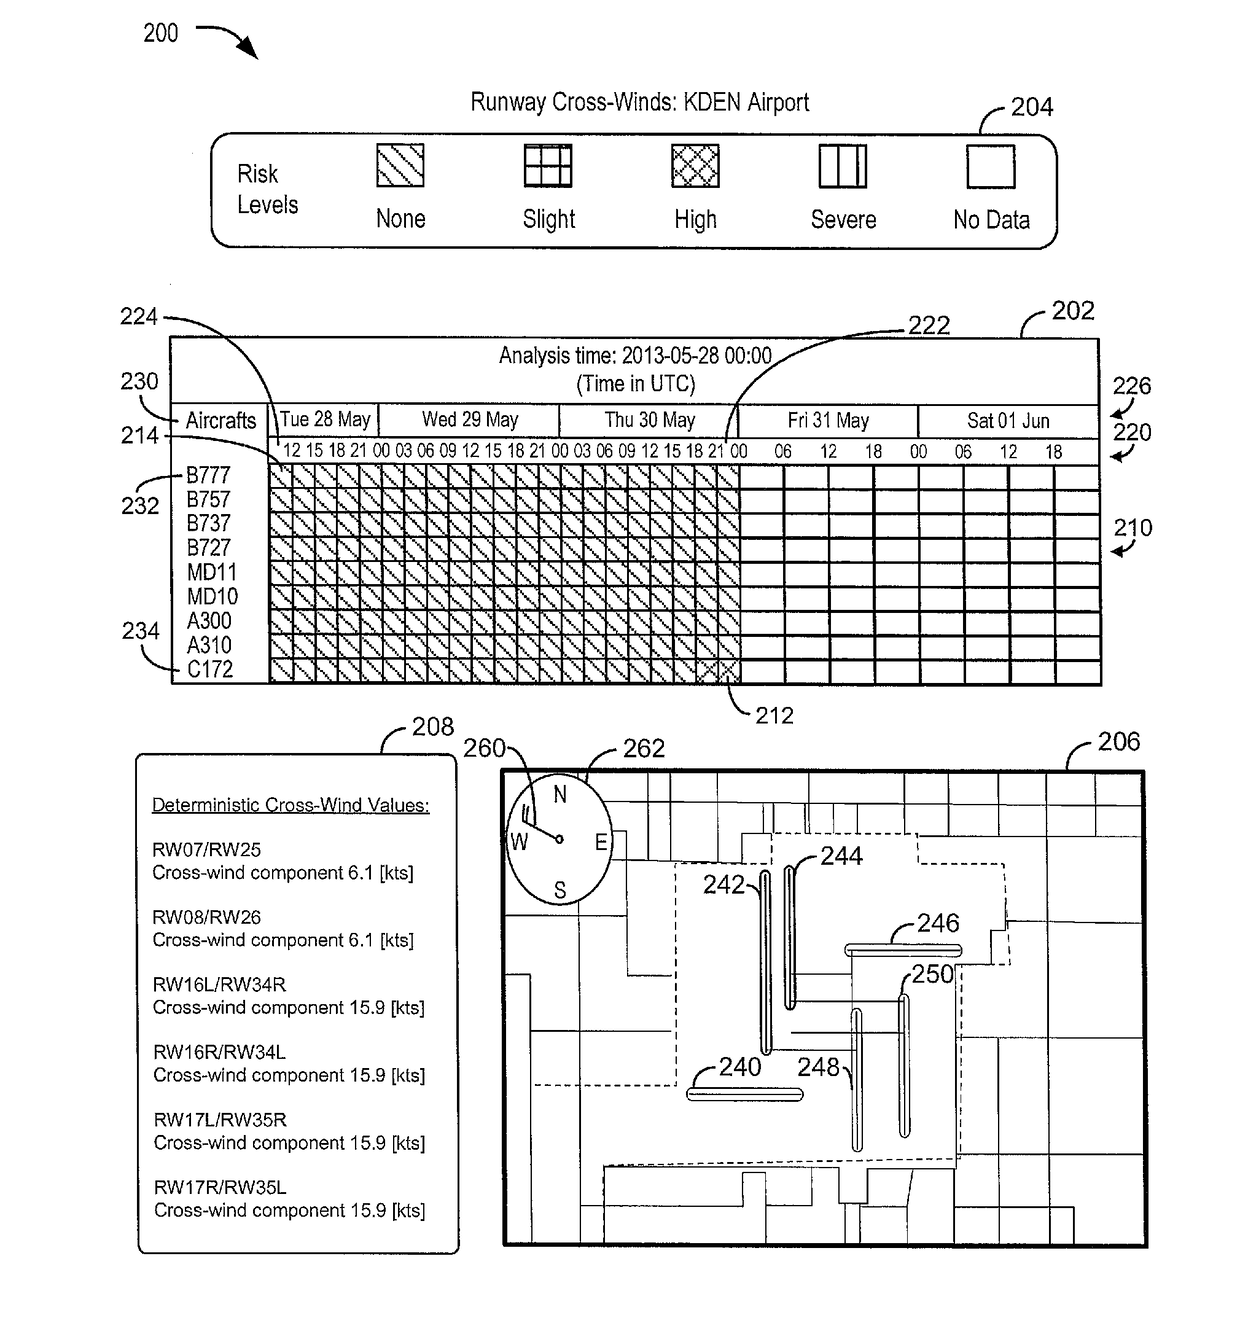
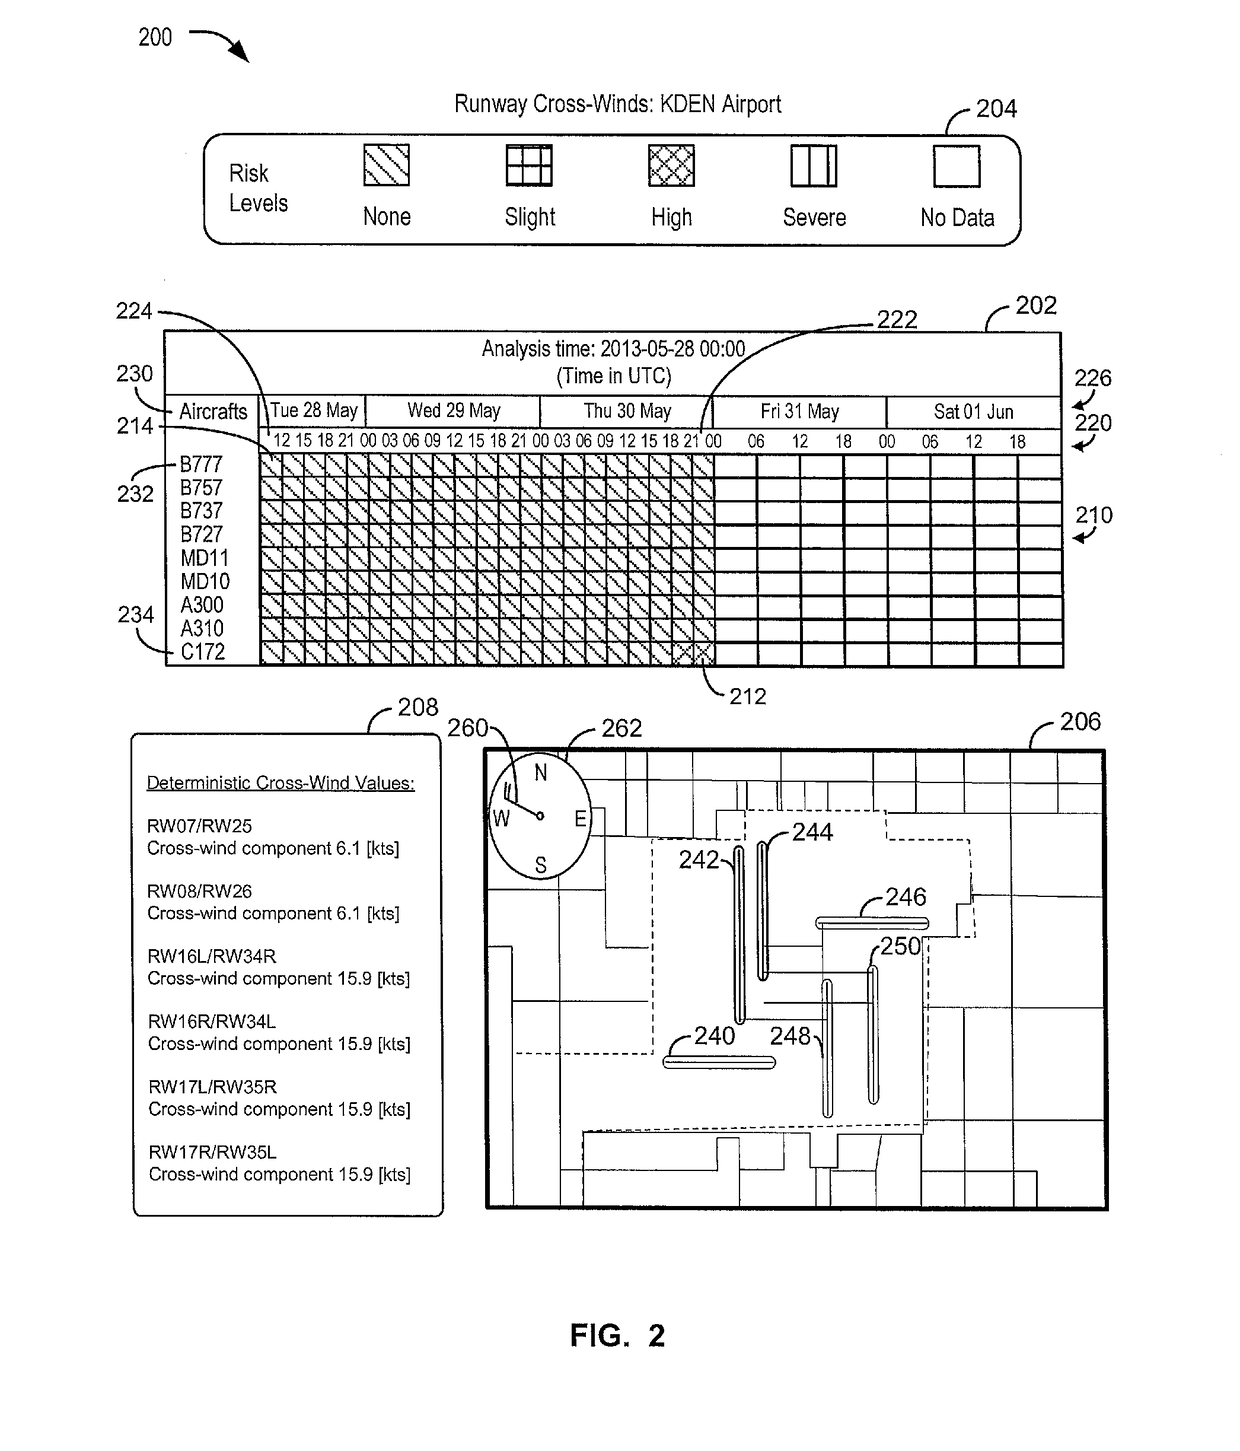
[0004]A system and method for predicting risk levels due to future weather conditions at airport runways are disclosed. Weather-related risk levels associated with aircraft using (e.g., taking off from or landing at) one or more runways at an airport may be predicted for multiple different types of aircraft at different times based on meteorological forecast data. For example, risk levels may be predicted based on predicted cross-winds at the one or more runways. Predicted risk level information may be displayed to a user via a single, easy-to-interpret graphical user interface (GUI). For example, the GUI may display multiple risk indicators. Each risk indicator may indicate a risk level associated with an aircraft of a corresponding aircraft type using the one or more runways during a corresponding sub-interval of a forecast time interval. To illustrate, the multiple risk indicators may be color-coded to indicate the corresponding predicted risk levels. Risk indicators corresponding to different aircraft types and to multiple time sub-intervals (e.g., time steps) of the forecast time interval may be concurrently displayed, thus enabling a user (e.g., an air traffic controller or a flight dispatcher) to compare risk levels for different aircraft types during a particular sub-interval, or to compare risk levels for a particular aircraft type during different sub-intervals. Additionally, the GUI may display data for a medium-term interval or a long-term forecast time interval, such as a three or more day interval. Thus, the user may quickly and easily generate a flight schedule for multiple days into the future for the airport using the GUI.

Problems solved by technology

The current forecast system outputs may not provide enough information in an easy-to-interpret form for use in generating the flight schedule.
As another example, the ensemble prediction system data may provide a large amount of predicted values, but such an output may be confusing to an air traffic controller or flight dispatcher and may not take into account a type of aircraft being scheduled for a takeoff or a landing.
Thus, the current forecast systems do not enable an air traffic controller or a flight dispatcher to quickly and easily generate a flight schedule based on predicted weather conditions for a medium-term or long-term interval into the future.
Decreasing the threshold may cause a warning to be generated when predicted cross-wind values reach values that cause passenger discomfort or distress (e.g., the reduced threshold value) but that do not reach the safety threshold value.

Method used


Image

  • System and method for predicting runway risk levels using weather forecast data and displaying multiple risk indicators comprising graphical risk indicators
  • System and method for predicting runway risk levels using weather forecast data and displaying multiple risk indicators comprising graphical risk indicators
  • System and method for predicting runway risk levels using weather forecast data and displaying multiple risk indicators comprising graphical risk indicators

Examples


Embodiment Construction

[0015]Particular embodiments of the present disclosure are described below with reference to the drawings. In the description, common features are designated by common reference numbers throughout the drawings.

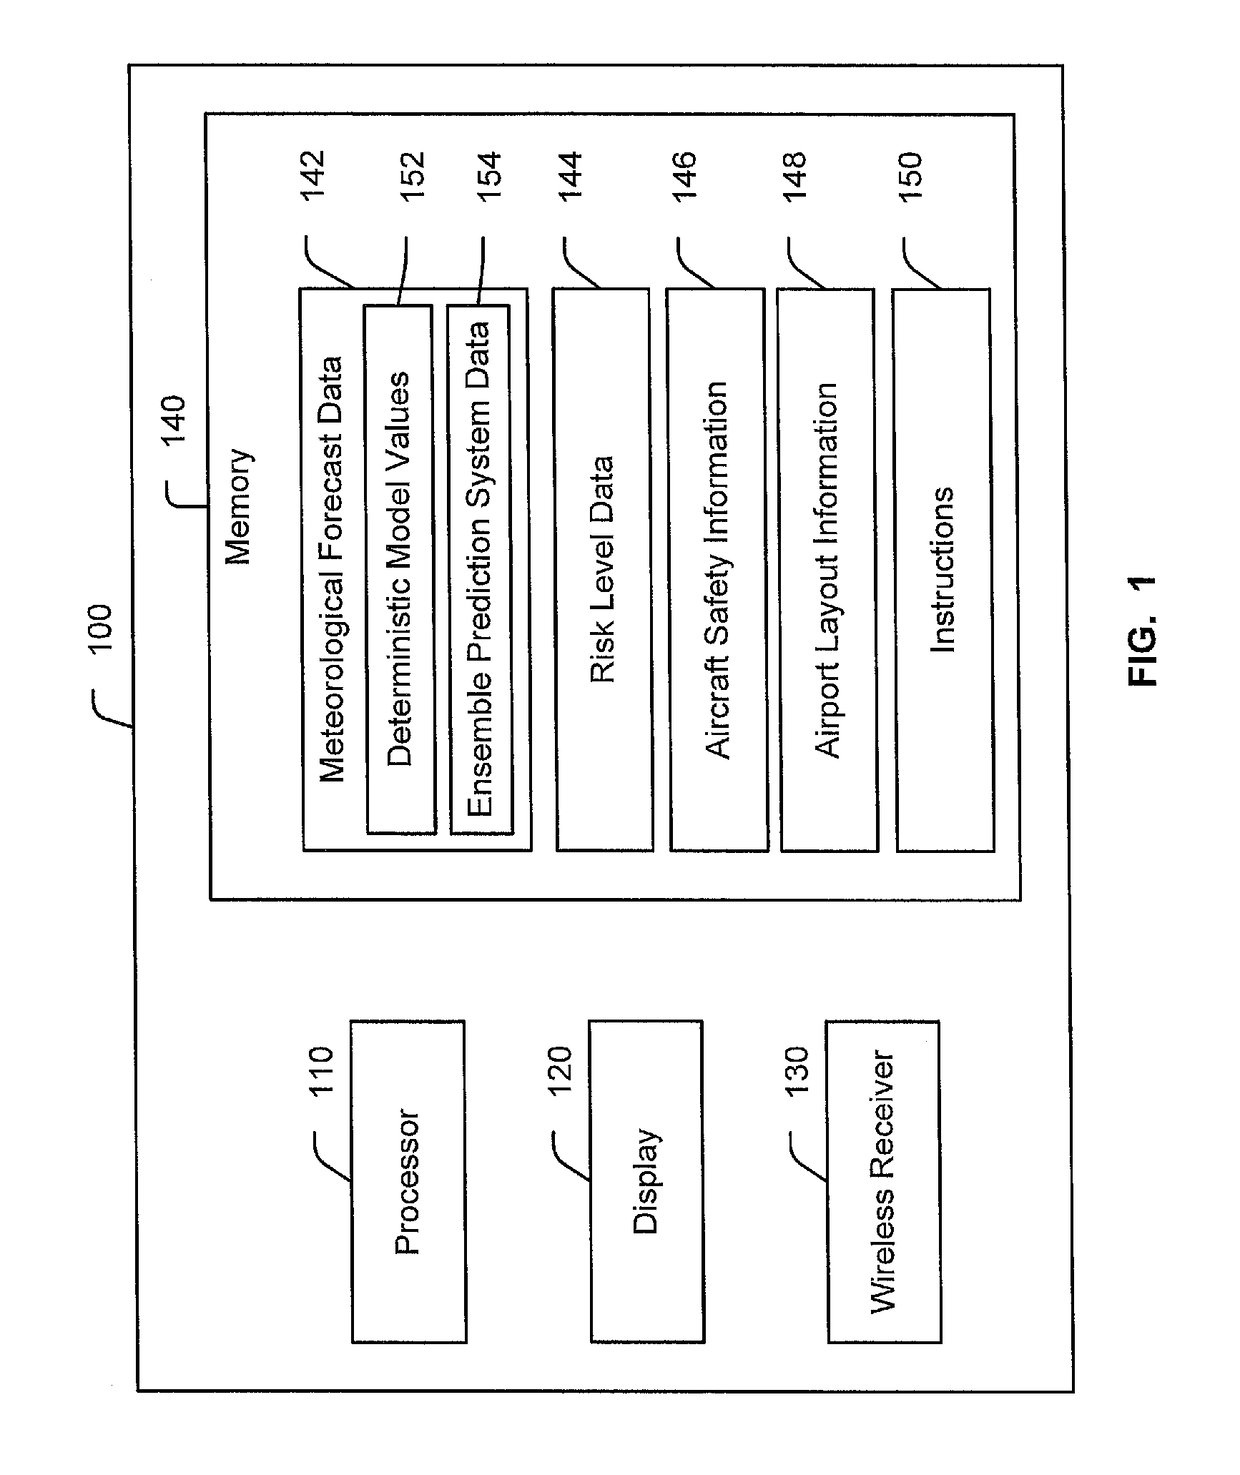
[0016]Referring to FIG. 1, a diagram illustrating a particular embodiment of an electronic device configured to predict risk levels associated with airport runways is shown and generally designated 100. As shown in FIG. 1, the electronic device 100 includes a processor 110, a display device 120, a wireless receiver 130, and a memory 140. In a particular embodiment, the electronic device 100 may be a portable device such as a cellular telephone or a tablet computer, configured for use as an air traffic control device or a flight dispatch device. In another embodiment, the electronic device 100 may be integrated with a control panel of an air traffic control tower (e.g., an air traffic control system) or with a flight dispatch control system. In a particular embodiment, the disp...


PUM


Abstract

A method includes receiving meteorological forecast data at an electronic device. The method includes predicting multiple risk levels associated with an aircraft using one or more runways of an airport during a forecast time interval based on the meteorological forecast data. The method further includes generating a graphical user interface (GUI) that includes multiple risk indicators based on the multiple risk levels. The multiple risk indicators may correspond to multiple time sub-intervals during the forecast time interval.

Description

FIELD OF THE DISCLOSURE[0001]The present disclosure relates to a system and method for predicting risk levels associated with airport runways.BACKGROUND[0002]Air traffic controllers and / or flight dispatchers use forecasted weather data to schedule flights at runways of airports. For example, when an air traffic controller or a flight dispatcher is generating a flight schedule for a particular airport, the air traffic controller or dispatcher may schedule a particular runway for a takeoff or a landing based on a weather prediction at the particular runway at a scheduled time. The air traffic controller or flight dispatcher may consult deterministic model meteorological data or ensemble prediction system data to predict a weather condition for the particular runway at the scheduled time for use in generating the flight schedule.[0003]However, current forecast systems provide either a deterministic model output (e.g., a predicted data value) or ensemble prediction system data (e.g., a ...

Claims


Application Information

Patent Timeline
Patent Type & Authority Patents(United States)
IPC IPC(8): G06F17/00G06N99/00
CPCG06N99/005G01W1/10G06N20/00
Inventor CETINICH, MICHAEL R.CHESSA, PIERO A.TODINI, GIULIONILSSON, ANNA J.STOVALL, RAY W.PETTENUZZO, DANIELE
Owner THE BOEING CO
Learn More