
Method and device for computing molecular isotope distributing and for estimating the elemental composition of a molecule from an isotopic distribution

a technology of molecular isotopes and isotopic distributions, applied in the field of computing the isotopic distribution of a molecule and its inverse, can solve the problems of difficult computation of the isotopic distribution of polypeptides, which may consist of hundreds of amino acids and thousands of atoms, and tedious and time-consuming steps

Active Publication Date: 2016-08-09
VLAAMSE INSTELLING VOOR TECHNOLOGISCH ONDERZOEK NV VITO
View PDF3 Cites 2 Cited by
  • Summary
  • Abstract
  • Description
  • Claims
  • Application Information

AI Technical Summary

Problems solved by technology

Although access to high-resolution mass spectrometry (MS), especially in the field of biomolecular MS, is becoming readily available due to recent advances in MS technology, the accompanied information on isotopic distribution in high-resolution spectra is not used at its full potential, mainly because of lack of knowledge and / or awareness.
One of the main difficulties when using MS in biomolecular MS, is that the isotopic distribution of polypeptides, which may consist of hundreds amino acids and thousands of atoms, is very hard to compute, let alone to recognize in a MS spectrum.
Furthermore, prior art techniques for identifying a molecule from an isotopic distribution may typically include a trial-and-error or fitting technique which requires a multitude of such computations.
A limiting step in this method is the step where an isotope pattern for each candidate elemental composition from the search list is to be calculated.
For very large molecules, e.g. of the order of 10000 Da, this can be a tedious and time-consuming step, even with today's computing technology.
However, such a database may be larger than can be stored in the e.g. the memory of a computer, especially if the molecules are large, or such a database may be incomplete.
Although the method introduced in Rockwood '95 and '96 is fast in computing isotopic and aggregated isotopic distributions, it may still be computationally intensive.
Furthermore, this method cannot be inversed directly, i.e. when an isotopic or aggregated isotopic distribution of a molecule is presented, the Fourier Transform technique is not able to deduce the molecular formula directly: it can only deduce it through a trial-and-error or fitting technique such as the one of document U.S. Pat. No. 7,904,253B2 described here above.
The prior art methods for computing the aggregated isotopic of a molecule are not fast or not accurate enough, too much memory is needed, too many details are calculated, computational problems such as numerical overflow and numerical inaccuracies can occur, etc., and this especially for large molecules such as polypeptides or oligonucleotides (DNA, RNA).
Prior art techniques for identifying the elemental composition of and / or quantifying the presence of mono-isotopic elements in a molecule in a sample may involve expensive and time-consuming extra experimental steps, such as done in tandem-MS.
These extra experimental steps lead to longer measuring times, extra cost, bigger equipment, etc.
A trial-and-error or fitting technique is time-ineffective, especially for large molecules, for identifying the molecule from an isotope distribution.
The identification is especially hard for large molecules.

Method used


Image

  • Method and device for computing molecular isotope distributing and for estimating the elemental composition of a molecule from an isotopic distribution
  • Method and device for computing molecular isotope distributing and for estimating the elemental composition of a molecule from an isotopic distribution
  • Method and device for computing molecular isotope distributing and for estimating the elemental composition of a molecule from an isotopic distribution

Examples


example 1

[0258]For carbon monoxide, CO, one may choose A0=28, i.e. the lightest mono-isotopic variant. One then easily computes q0=P(612C)P(816O)=0.986896001. To compute the probability q1 with which the aggregated isotopic variant of CO with mass number A1=29 occurs, one can use q1=Σj=00C1,0q0 with

[0259]C1,0=-ρ-11⁢⁢andρ-1=rC-1+rO-1+rO-1_,wherebyrC=-P⁡( 612⁢C)P⁡( 613⁢C),⁢rO=-P⁡( 817⁢O)+P⁡( 817⁢O)2-4⁢P⁡( 816⁢O)⁢P⁡( 818⁢O)2⁢P⁡( 818⁢O)⁢⁢andr_O=-P⁡( 817⁢O)-P⁡( 817⁢O)2-4⁢P⁡( 816⁢O)⁢P⁡( 818⁢O)2⁢P⁡( 818⁢O)

are the roots of the equations P(612C)+P(613C)I=0 and P(816O)+P(817O)I+P(818O)I2=0. This leads to ρ−1=−0.011196653942 and q1=0.011049933. In the following steps, one obtains ρ=2=rC−2+rO−2+rO−2=−0.003992862186 and q2=0.002032131, and ρ−3=rC−3+rO−3+rO−3=0.000001083120 and q3=0.000021935. These numbers are summarized in the table below:

[0260]

iAiρ−i = rC−i + rO−i + rO−iqi028—0.986896001129−0.0111966539420.011049933230−0.0039928621860.0020321313310.0000010831200.000021935

[0261]For C3H8, a similar table...

example 2

Example on the Computation of the Center Masses of the Aggregated Isotopic Variants of CO

[0264]An isotopic distribution of a sample is provided, and one wants to analyze the sample for CO. Hereby, one wants to compare part of the measured isotopic distribution with the aggregated isotopic distribution, also with respect to the center masses. Hereby, one needs to obtain this aggregated isotopic distribution and the center masses. Afterwards, one can make the comparison between the aggregated isotopic distribution and the center masses as obtained, and the aggregated isotopic distribution as derived from the measured isotopic distribution.

[0265]Previously, we have already explained the isotopic distribution of the molecule CO.

[0266]For the lightest variant, which we can take as the starting or zeroth variant, one has:

A0=A(612C)+A(816O)=28,

M0=M(612C)+M(816O)=27.995 Da,

q0=P(612C)P(816O)=0.986896001.

[0267]Note that, since it is a mono-isotopic variant, the center mass is also the isotop...

example 3

Example on the Computation of the Chemical Formula when an Isotopic Distribution is Provided

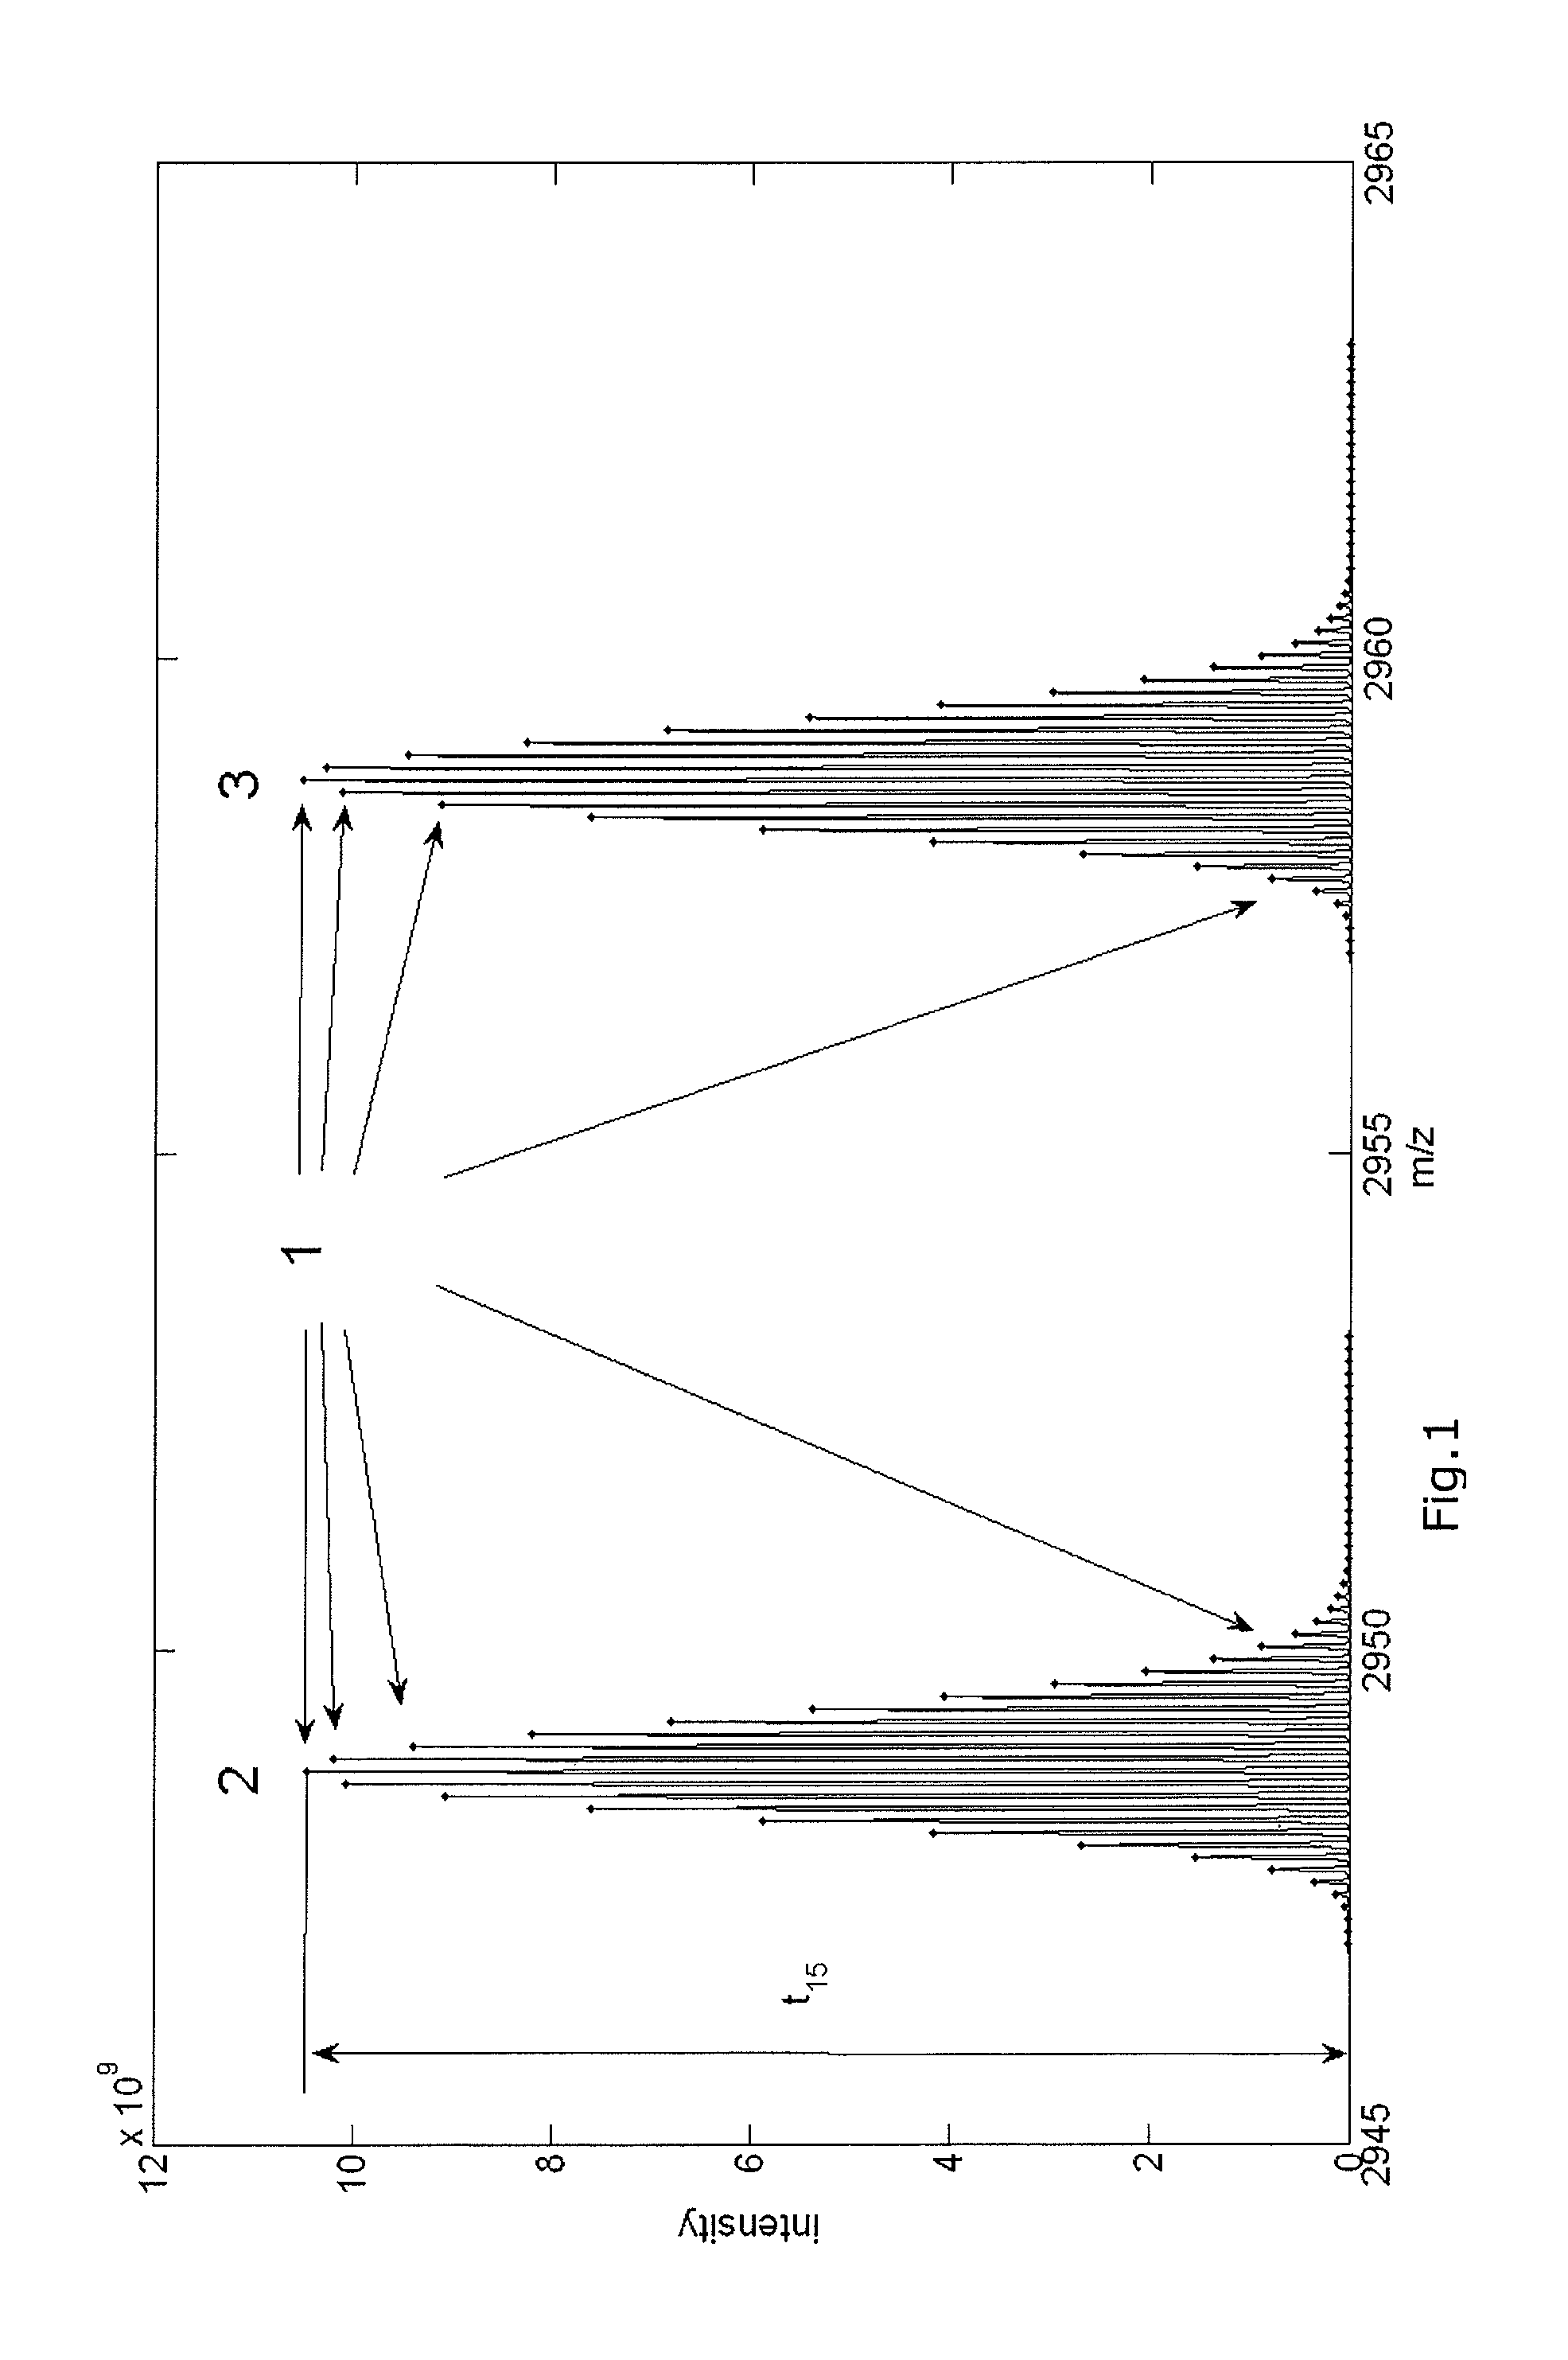
[0288]FIG. 1 presents the aggregated isotopic distribution of a molecule in a sample as observed by mass spectrometry, whereby the peaks of the aggregated isotopic variants are indicated with dots (1), and whereby the distribution at lower m / z values (2) can be attributed to the unphosphorylated molecules, while the distribution observed at higher m / z values (3) can be attributed to the phosphorylated molecules.

[0289]The molecule under scrutiny in FIG. 1 is Beta-caseine with a mono-isotopic mass of 23568.3197 Da for the unphosphorylated molecules. The molecule has a charge of z equal to 8. Therefore, the observed mono-isotopic mass in term of m / z equals (23568.3197+8) / 8. The reversed calculation can be applied to calculate the mono-isotopic mass based on the observed m / z and z. For example, the observed mono-isotopic peak is observed at 2947.04779227045 m / z. The charge of the molecules is 8, ...


PUM

PropertyMeasurementUnit
atomic massaaaaaaaaaa
massaaaaaaaaaa
atomic mass numberaaaaaaaaaa

Abstract

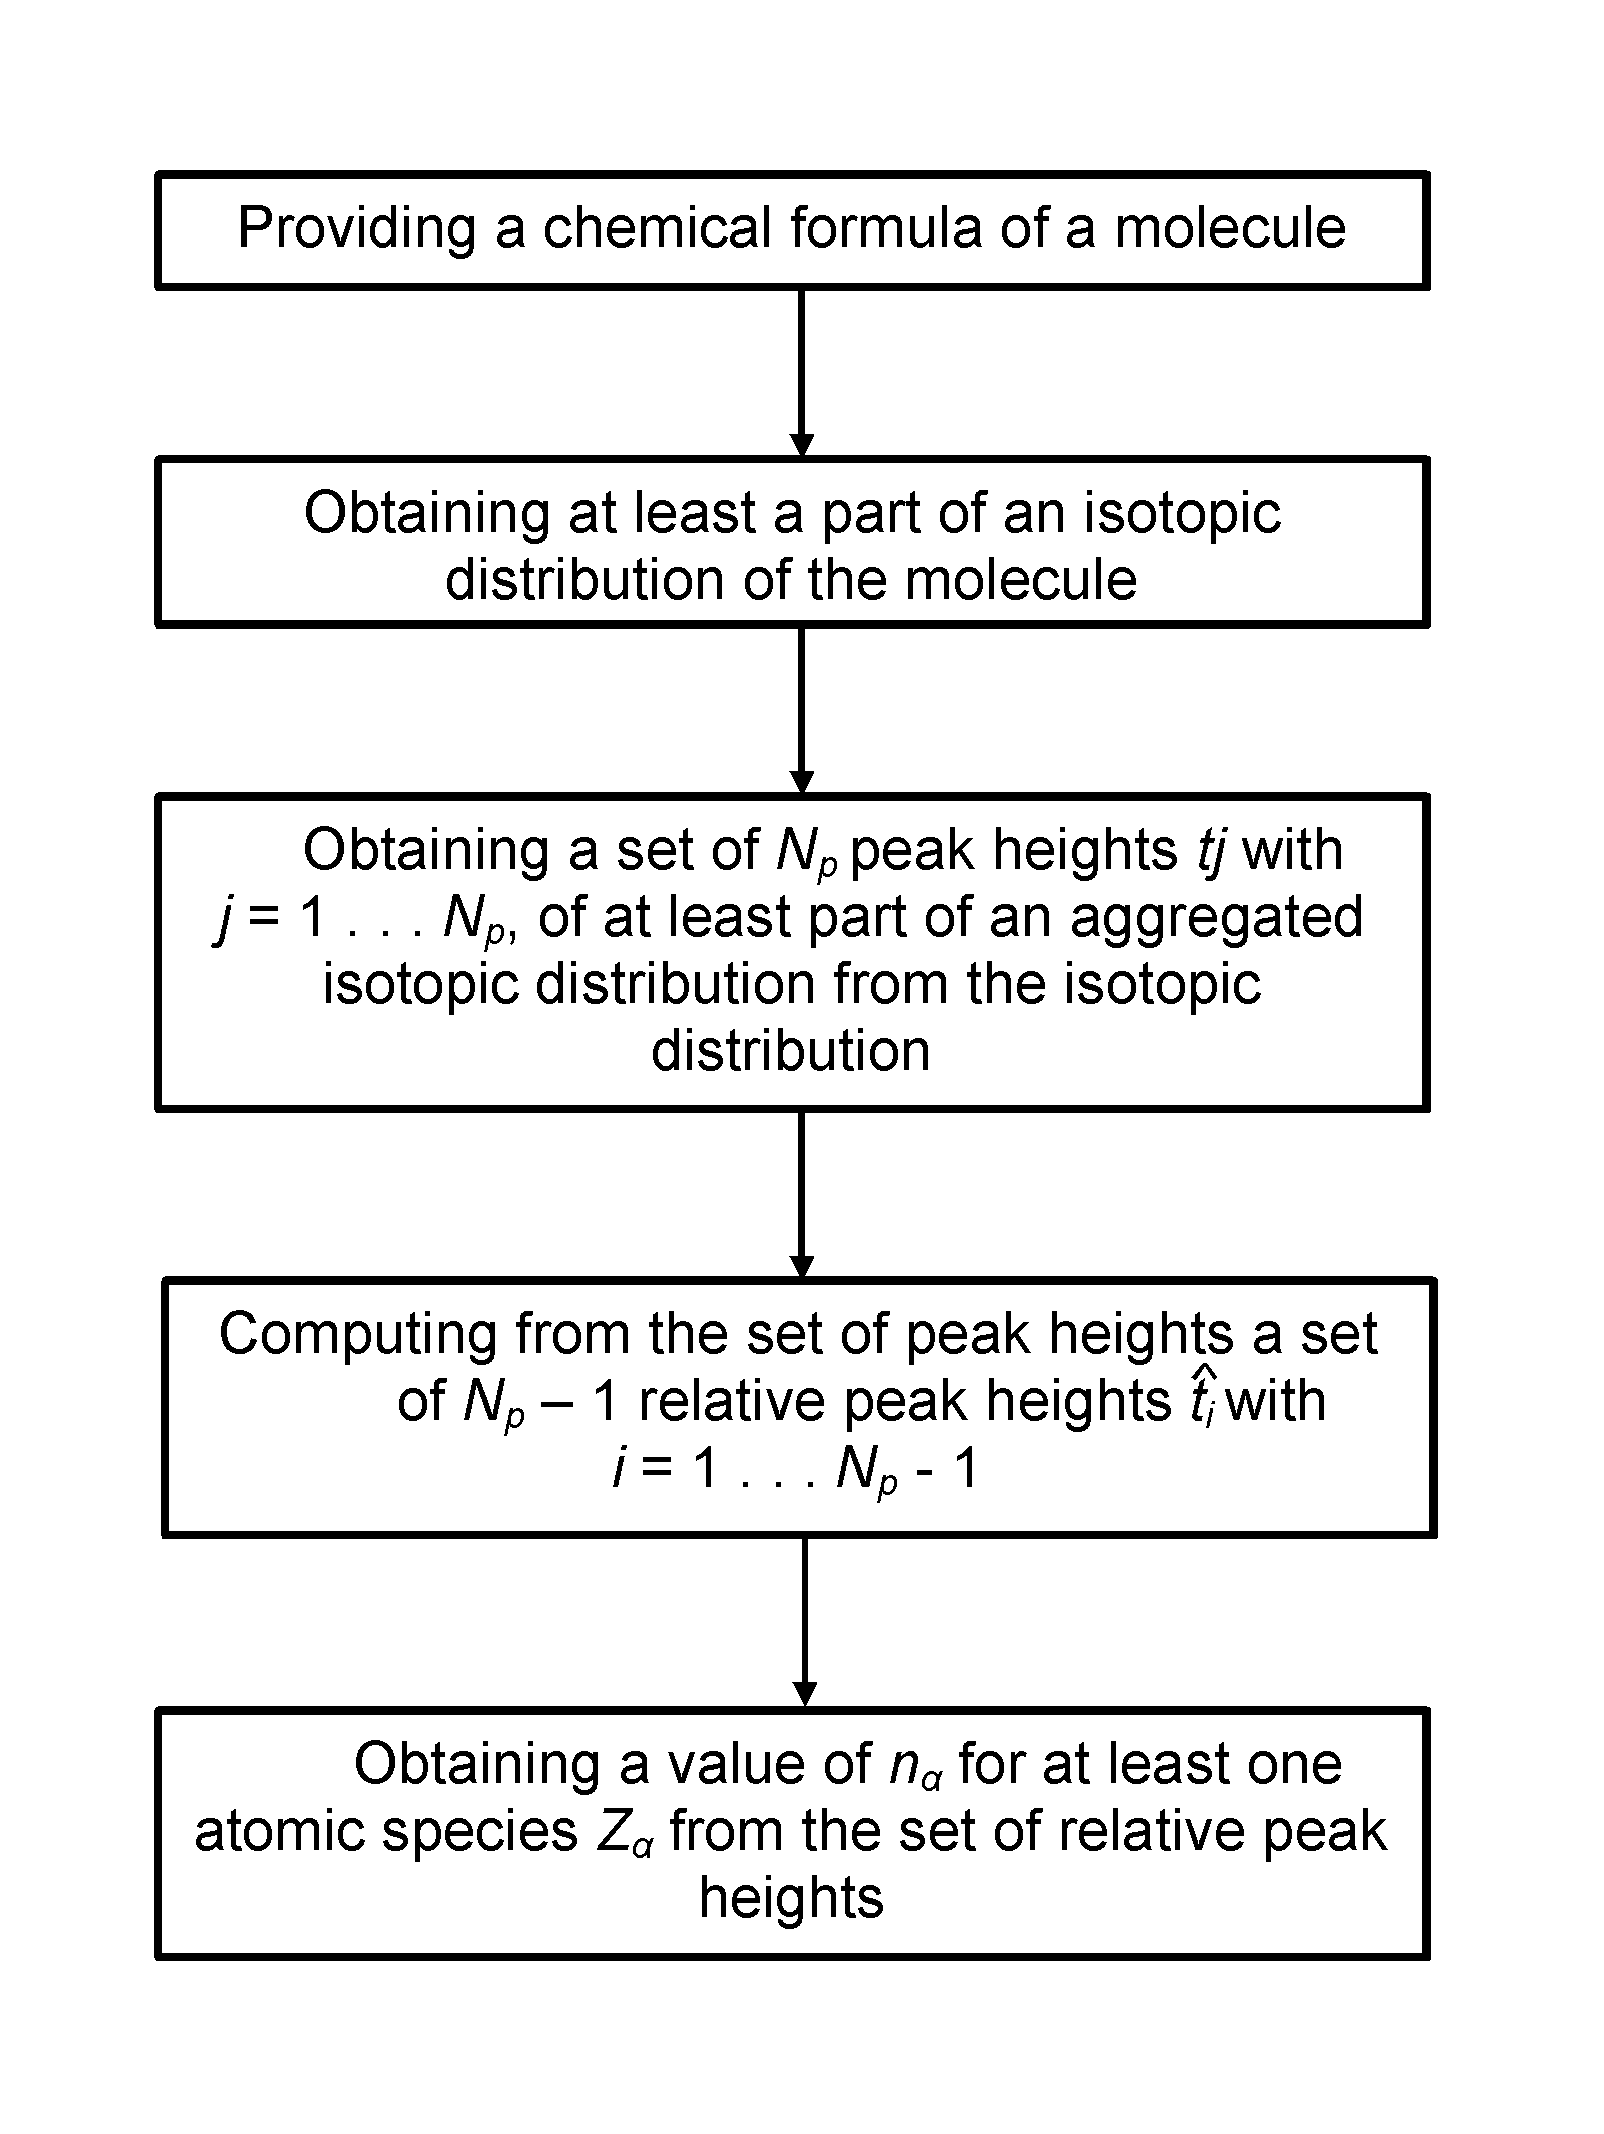
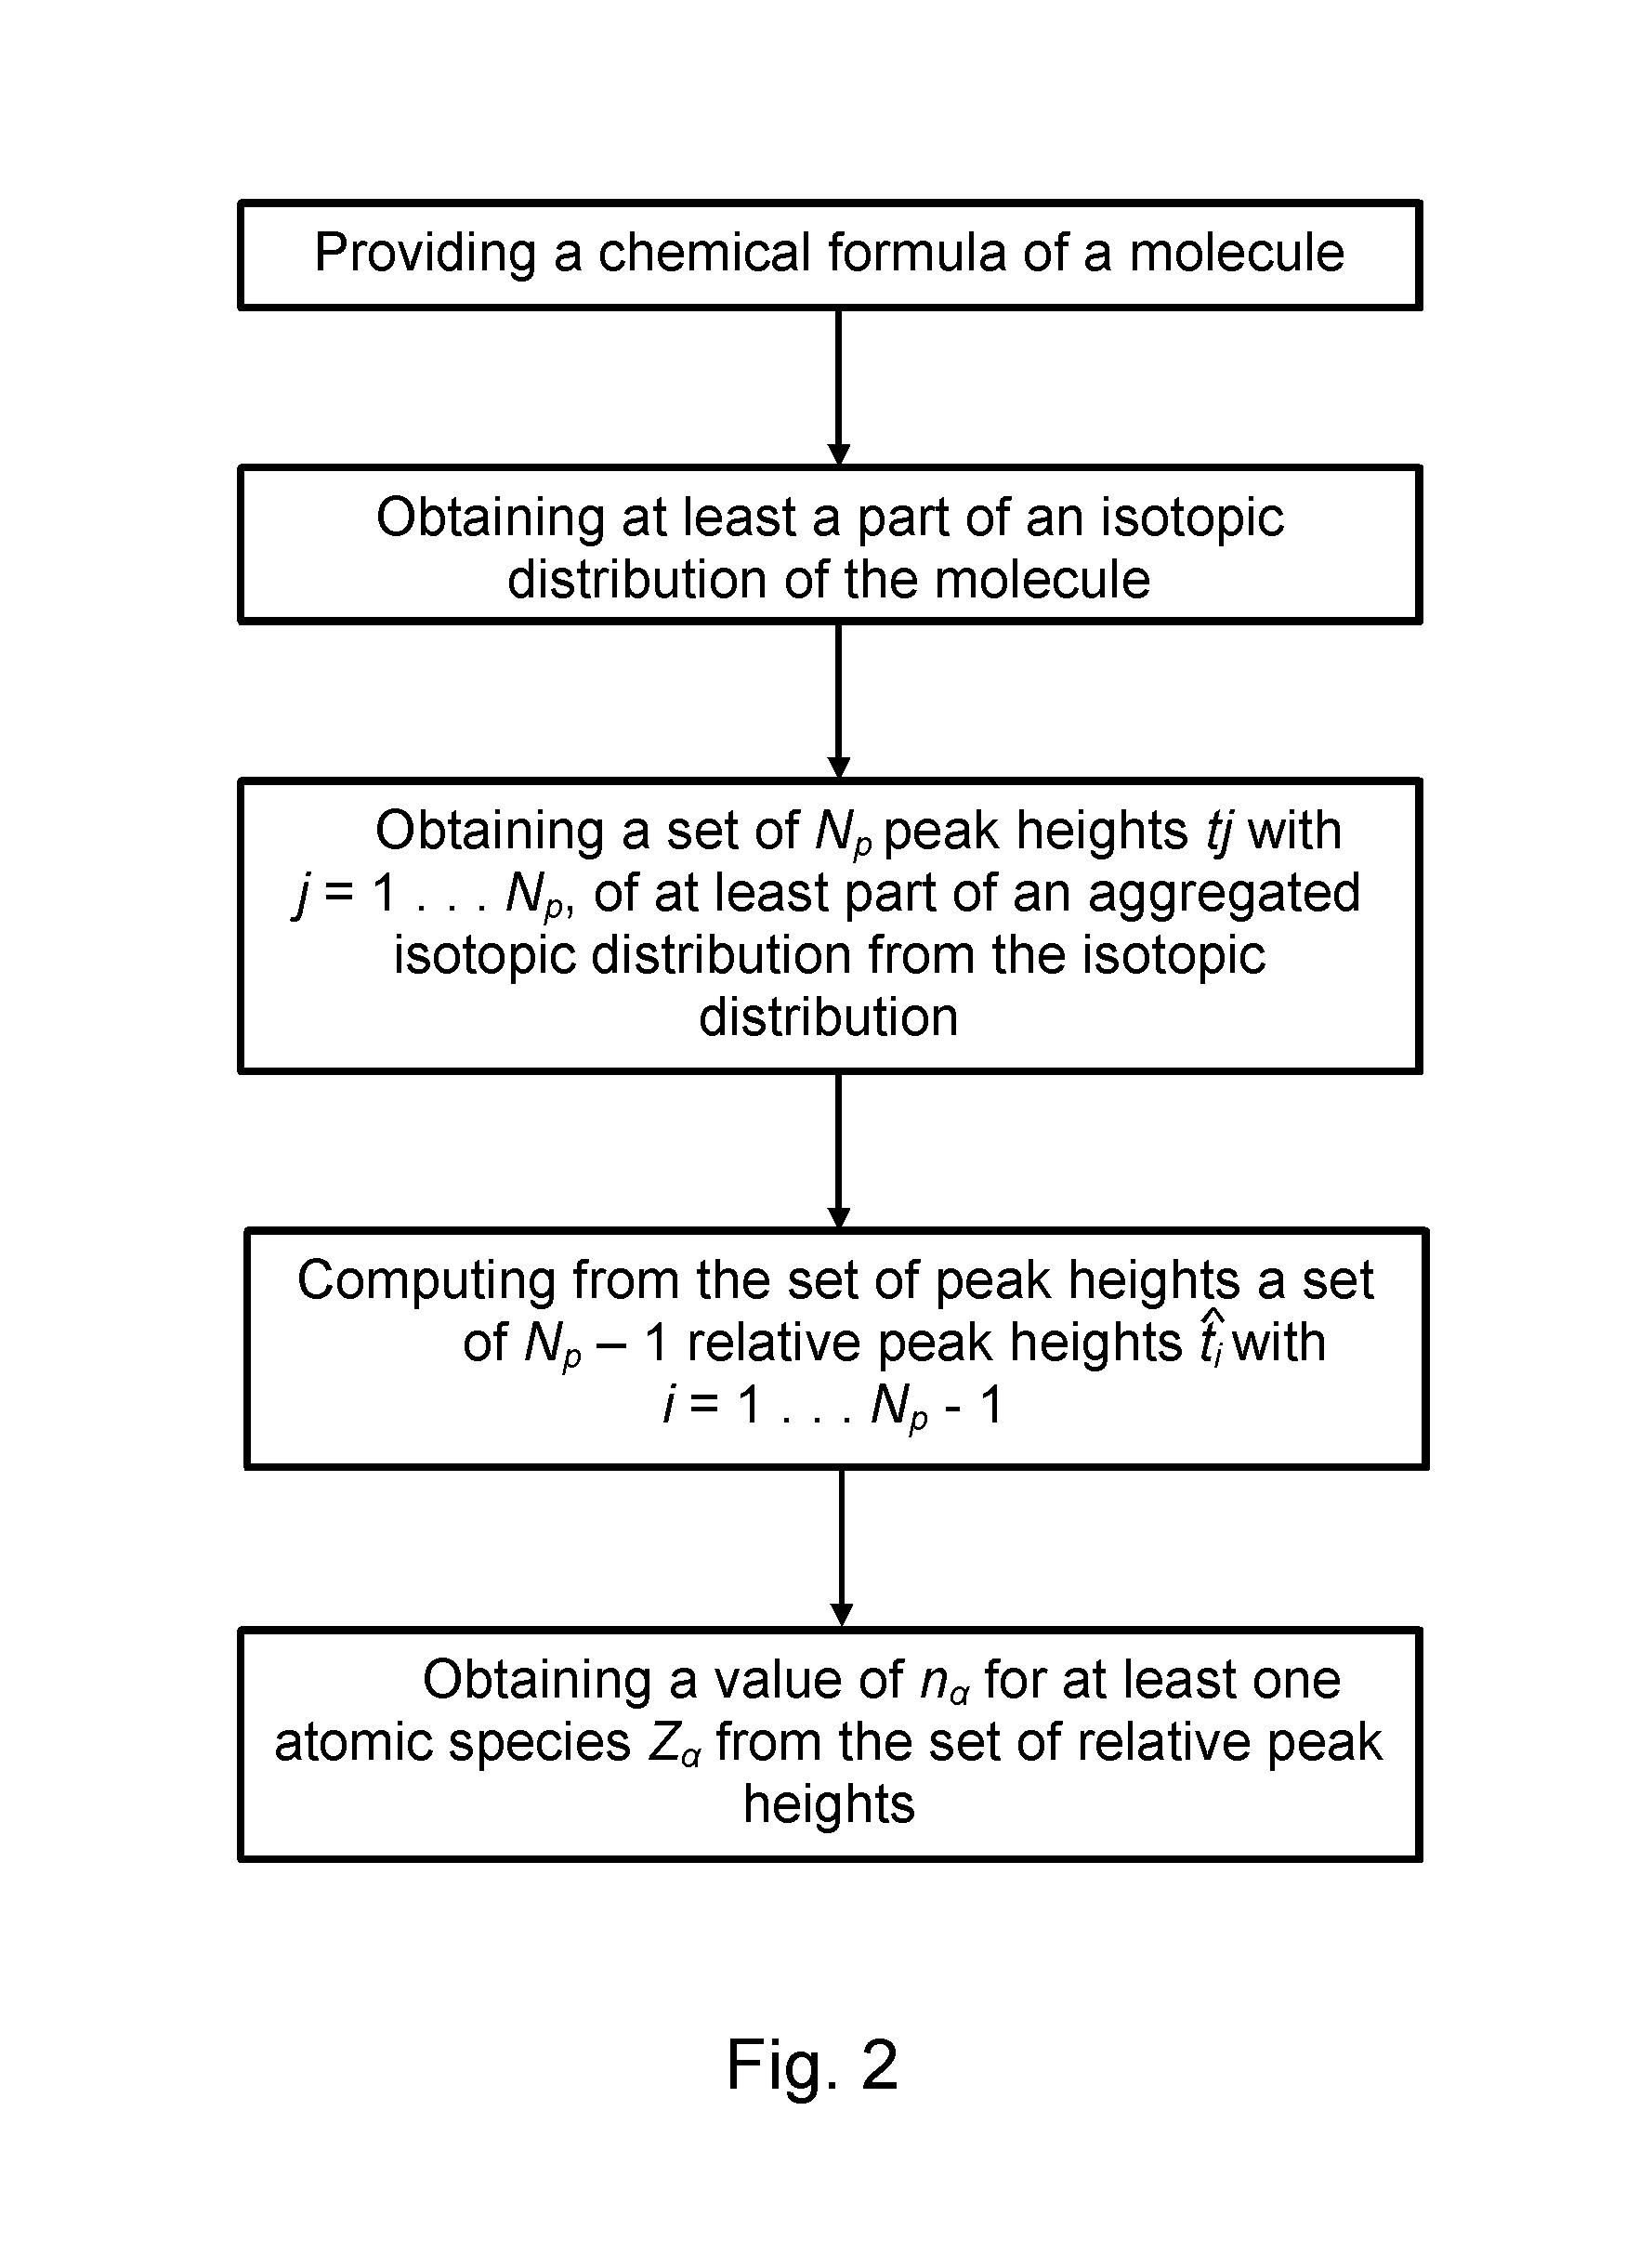
The current invention concerns a method for identifying the elemental composition of and / or quantifying the presence of mono-isotopic elements in a molecule in a sample by computing a solution of a system of linear equations ΣαEiαnα=Fi, whereby the set of numbers Fi comprises said set of relative peak heights from the aggregated isotopic distribution and the coefficients Eiα of said linear system comprise powers and / or power sums of roots rα,i<sub2>α< / sub2>. The present invention also provides a method for analyzing at least part of an isotopic distribution of a sample, comprising obtaining data comprising at least one probability qj with which a j'th aggregated isotopic variant of said molecule with mass number Aj occurs within said aggregated isotopic distribution; and computing a probability qi with which an i'th aggregated isotopic variant occurs within said aggregated isotopic distribution, by taking a linear combination of said at least one probability qj.

Description

TECHNICAL FIELD[0001]The invention pertains to the technical field of computing the isotopic distribution of a molecule and its inverse, the identification of the elemental composition of molecules from an isotopic distribution e.g. as measured in a mass spectrometer. Furthermore, the invention pertains to the technical field of identifying the elemental composition of polypeptide molecules and, more specifically, identifying and quantifying phosphorylation events of polypeptide molecules.BACKGROUND[0002]Mass spectrometry (MS) is an analytical technique which was developed in the last century and which measures the mass-to-charge ratio of charged particles. It is used for determining masses of particles, for determining the elemental composition of a sample or molecule, and for elucidating the chemical structures of molecules, such as peptides and other chemical compounds. The MS principle consists of ionizing chemical compounds to generate charged molecules or molecule fragments an...

Claims


Application Information

Patent Timeline
Patent Type & Authority Patents(United States)
IPC IPC(8): H01J49/26G01N27/62G01N30/96G06F17/40G06K9/00H01J49/00G06F19/00G16C20/20G16Z99/00
CPCG06K9/00563G06F19/70H01J49/00H01J49/0036H01J49/26G01N30/96H01J49/004G01N27/62G06F17/40G06F19/00G16C99/00G16Z99/00G16C20/20G06F2218/20
Inventor VALKENBORG, DIRKDITTWALD, PIOTR
Owner VLAAMSE INSTELLING VOOR TECHNOLOGISCH ONDERZOEK NV VITO
Learn More