
Method and user interface for the graphical presentation of medical data

a medical data and graphical technology, applied in the field of graphical presentation of medical examination results, can solve the problems of forced access to image series, relative high cognitive effort and time on the part of users, and achieve the effect of facilitating rapid adaptation

Inactive Publication Date: 2013-01-29
SIEMENS HEALTHCARE GMBH
View PDF21 Cites 3 Cited by
  • Summary
  • Abstract
  • Description
  • Claims
  • Application Information

AI Technical Summary

Benefits of technology

Enables rapid adaptation of data set views to user context, reduces cognitive effort, and allows for efficient access and manipulation of image series, optimizing screen space and accommodating visually oriented interactions.

Problems solved by technology

The access to image series therefore is forced to occur in serial interactions and is associated with relative high cognitive effort and time on the part of the user.

Method used


Image

  • Method and user interface for the graphical presentation of medical data
  • Method and user interface for the graphical presentation of medical data
  • Method and user interface for the graphical presentation of medical data

Examples


Embodiment Construction

[0026]The presentation in figures is not to scale; identical elements or elements having identical effects are provided with the same reference characters.

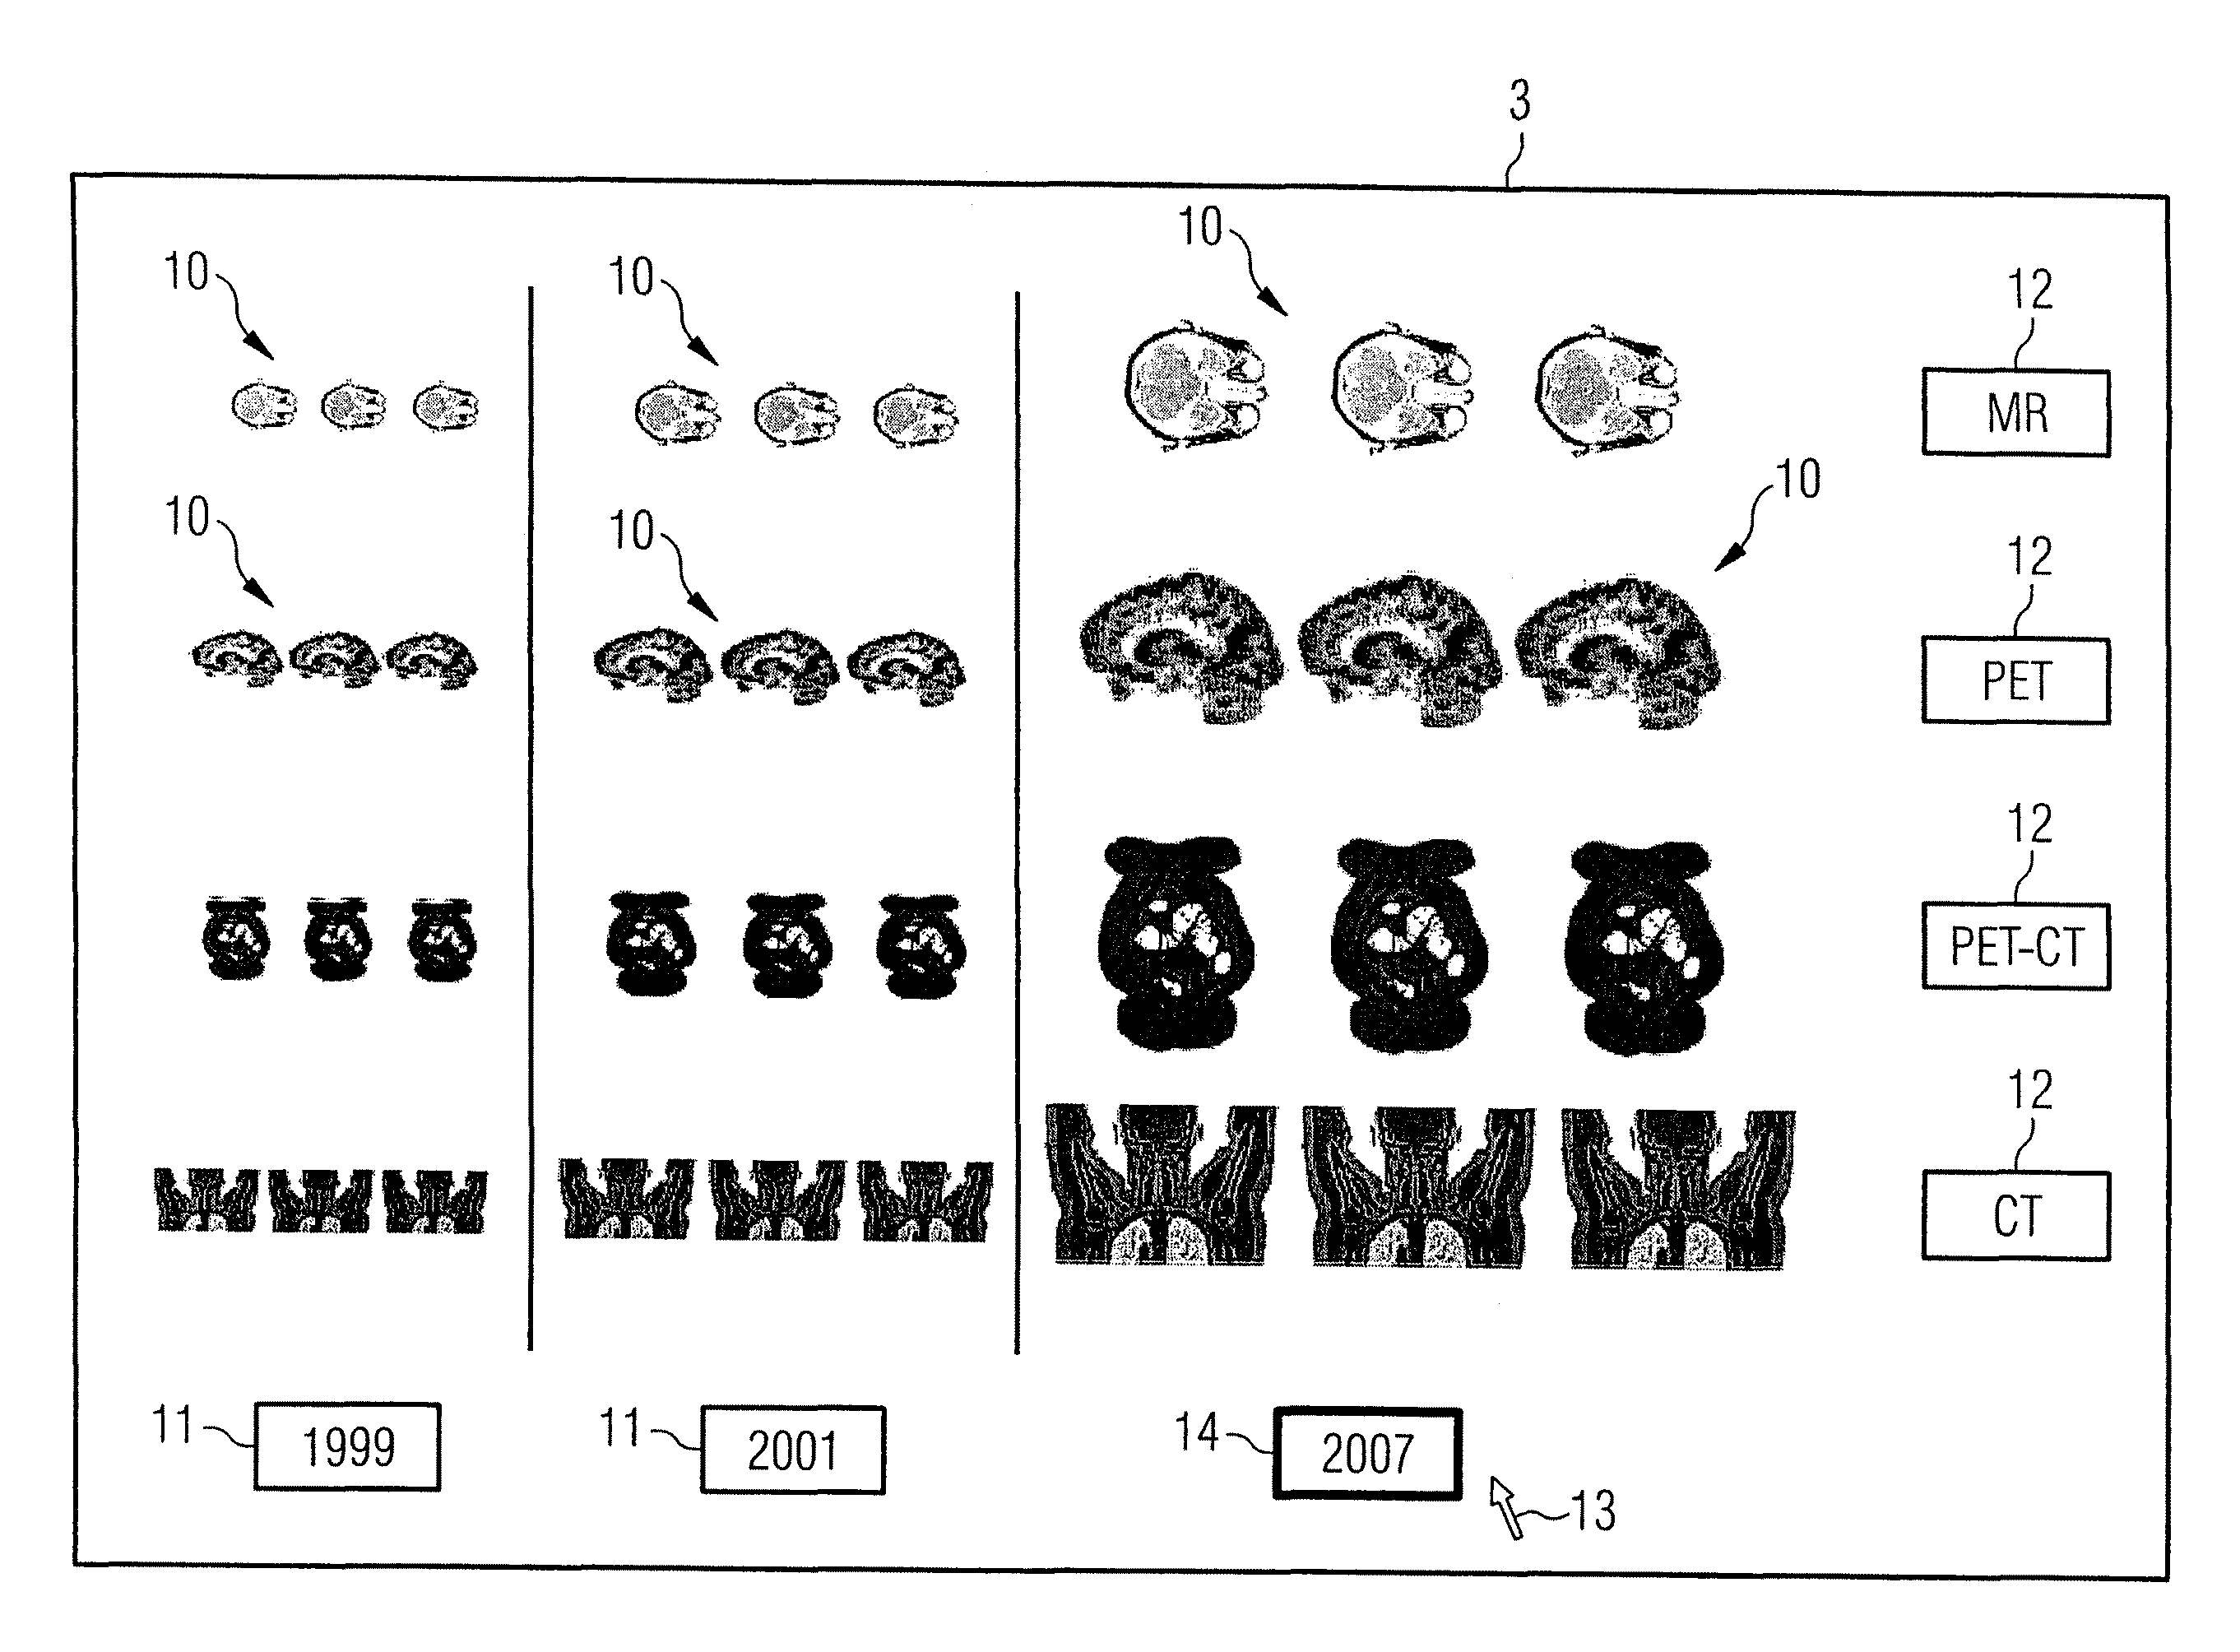
[0027]The user interface according to the invention utilizes the possibilities of two-dimensional presentation under consideration of established parameters in the display of data symbols and thus provides the user an overview of all present image series of a single patient in the form of a two-dimensional diagram: for example, all years in which image series were generated are displayed in parallel. These are sorted according to the respective modality (imaging method).

[0028]The first classification can be conducted so that a rectangle is created for each year. Data symbols that correspond to the image series are displayed in these rectangles; said image series are retrieved and shown at a suitable size when the corresponding data symbol has been selected. The most recent year is focused on (emphasized) by default, so that its ob...


PUM


Abstract

A method and a user interface for the implementation of a medical examination with at least one imaging device operated by determination and input of a group of measurement parameters via an input device of the user interface, generation of spatially resolved image information with the at least one imaging device depending on the group of measurement parameters, and storage of the image information on a storage medium, presentation of the image information as a data symbol on a screen of the user interface, Multiple data symbols are presented in a predetermined arrangement on the screen for a medical assessment. In order to be able to clearly present all data of a patient that are acquired in imaging methods in an accessible and manipulable manner, the data symbols are arranged on the screen by a control unit depending on at least three display parameters.

Description

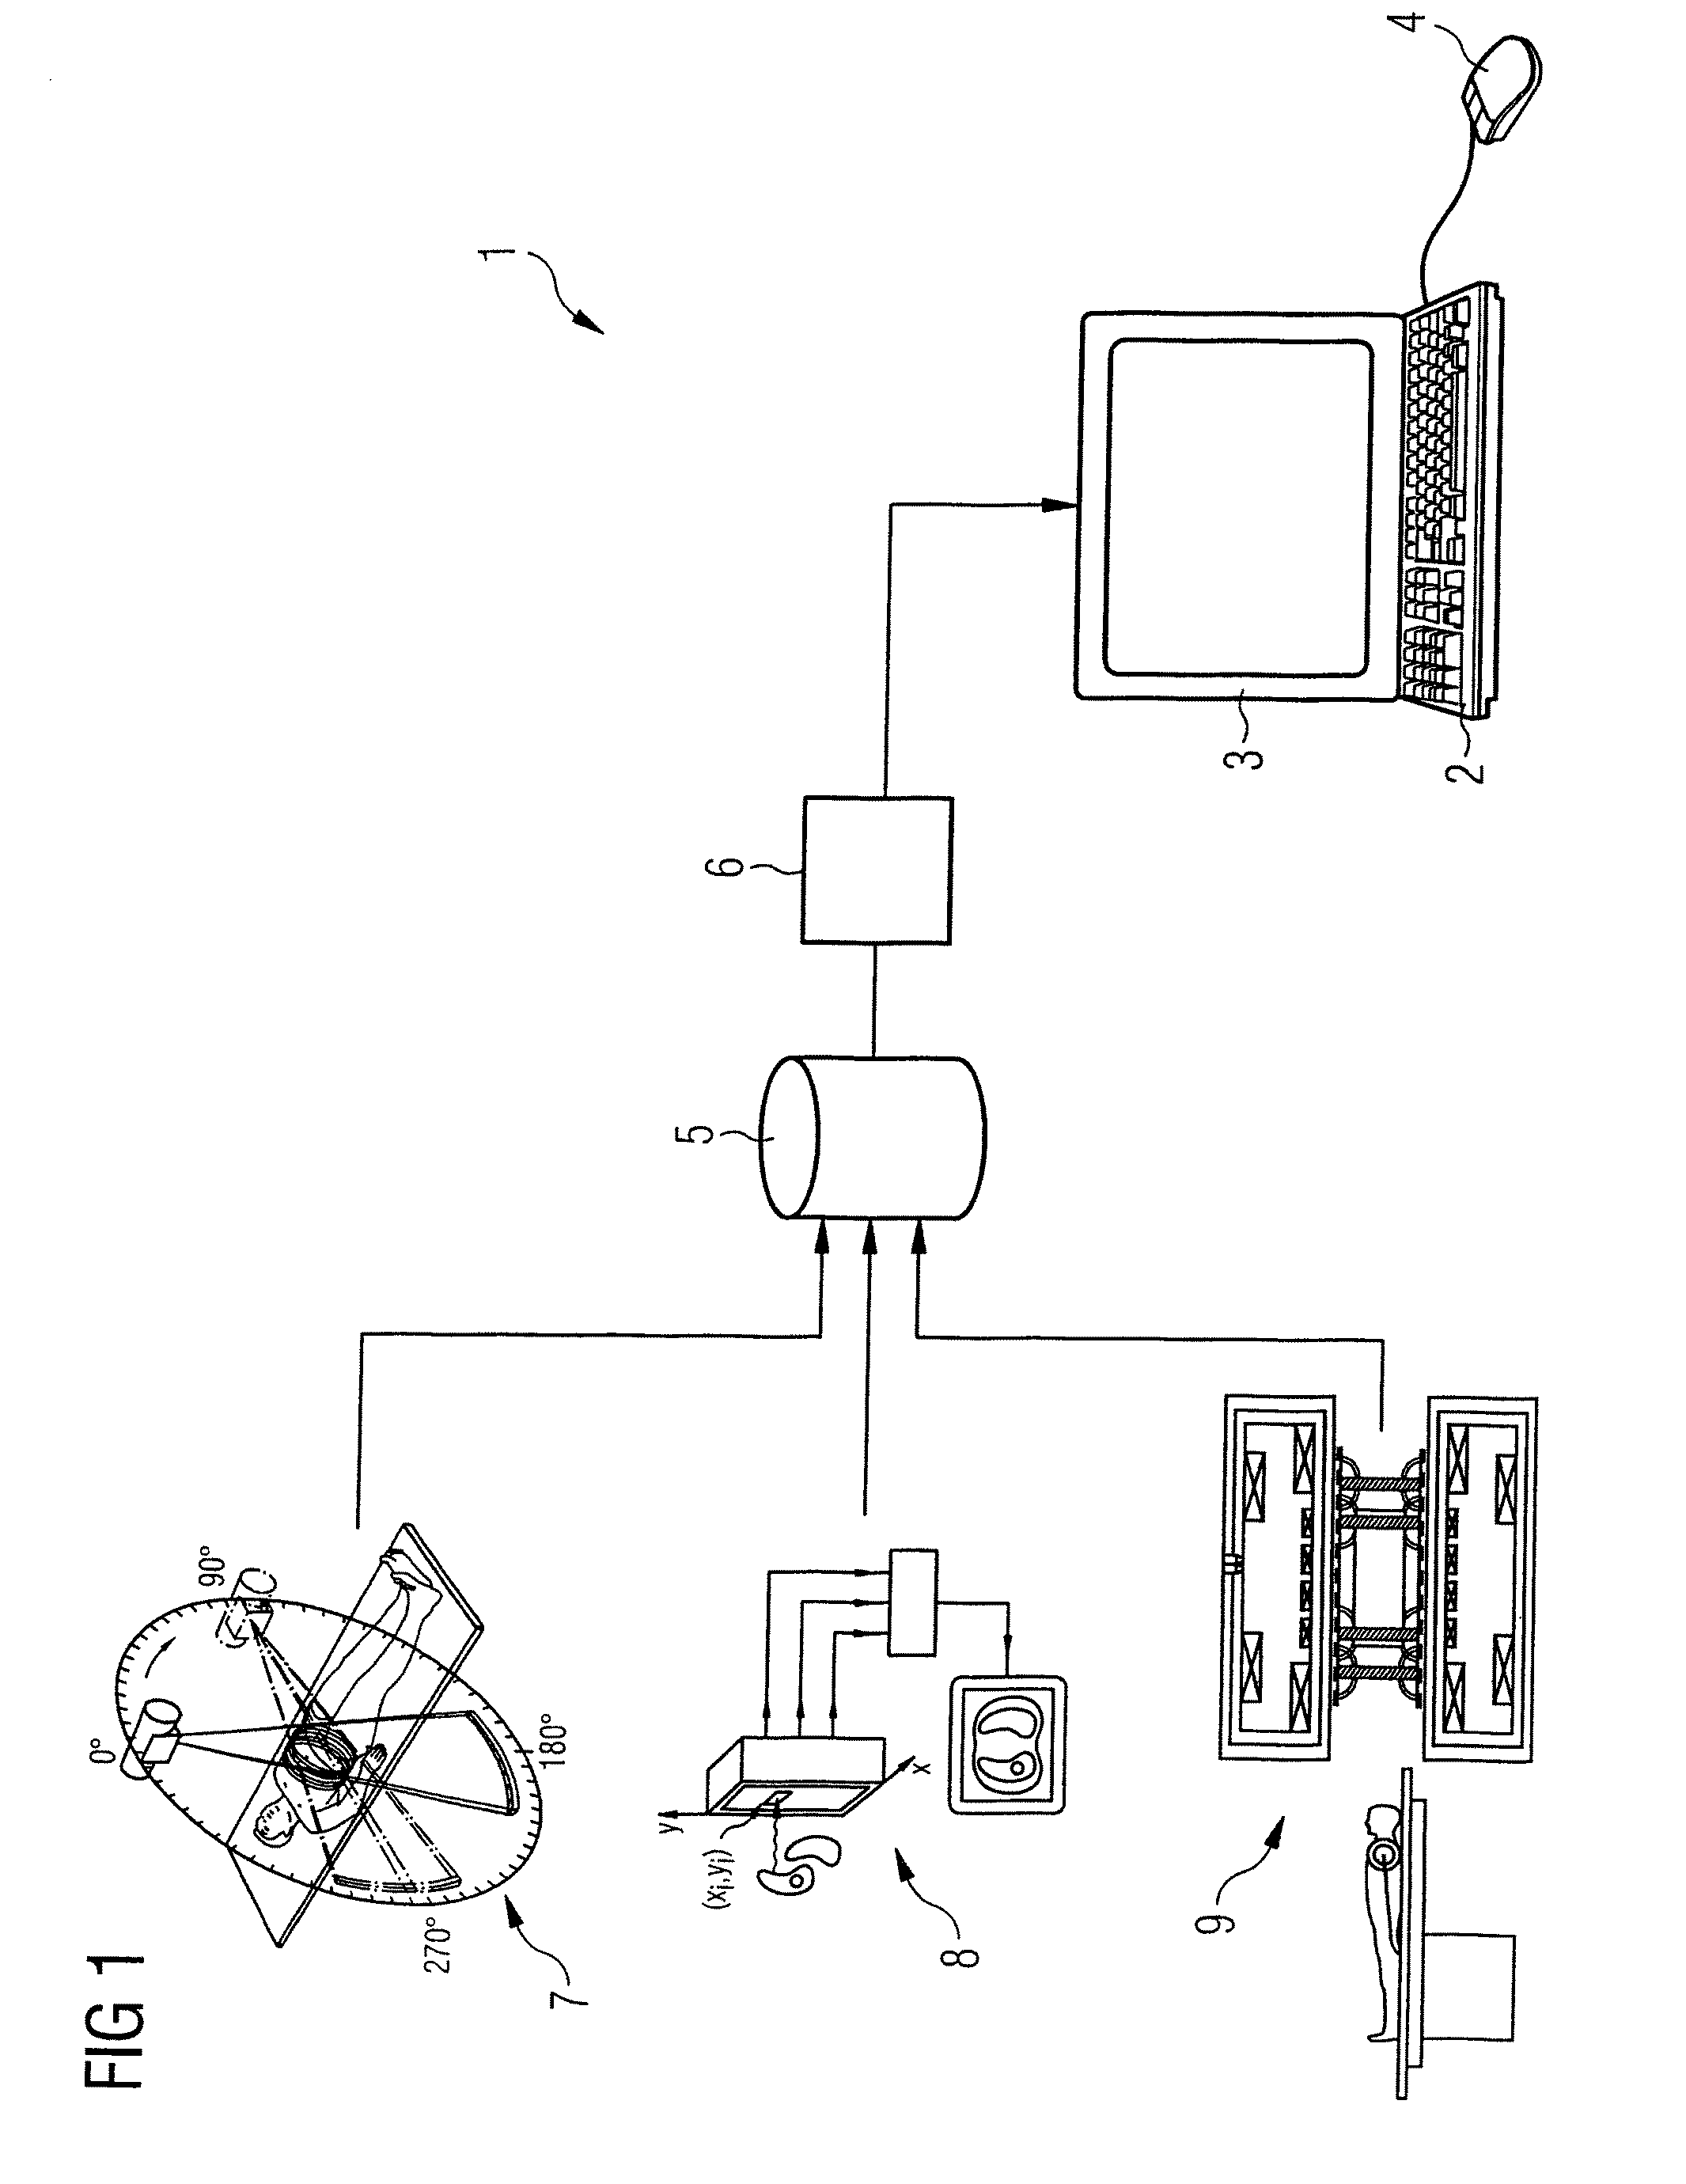
BACKGROUND OF THE INVENTION[0001]1. Field of the Invention[0002]The present invention concerns the graphical presentation of medical examination results that were acquired with imaging methods, and in particular a method and a user interface for the implementation of a medical examination.[0003]2. Description of the Prior Art[0004]For the necessary categorization, sorting and evaluation of data acquired in imaging methods of medical technology, not only are the spatial dimensions (such as 3D data sets, slice images, body region) relevant, but also time information such as the chronological order of the acquisitions (acquisition points in time), as well as information that results from the examination context, such as the employed imaging method, the scanner model and the medical question. The relevance of such factors to the task of the user can change from one moment to the next, even multiple times in one application situation under the circumstances. User interfaces that enable a...

Claims


Application Information

Patent Timeline
Patent Type & Authority Patents(United States)
IPC IPC(8): G06F3/048A61B5/05G16H30/20G16H30/40G16H50/30G16Z99/00
CPCG06F19/321G06F19/3406G16H40/63G16H50/30G16H30/40G16H30/20G16Z99/00
Inventor GLASER-SEIDNITZER, KARLHEINZKLING, JOHANNESMARTIN, DIANA
Owner SIEMENS HEALTHCARE GMBH
Learn More