
Method and apparatus for generating a dynamic power-flux map for a set of computer systems

a computer system and power flux technology, applied in the direction of digital computer details, instruments, nuclear elements, etc., can solve the problems of large datacenters typically overprovisioning cooling capacity, premature failure of components within servers, and low average server utilization factors, etc., to achieve the effect of power flux

Active Publication Date: 2009-06-16
ORACLE INT CORP
View PDF4 Cites 22 Cited by
  • Summary
  • Abstract
  • Description
  • Claims
  • Application Information

AI Technical Summary

Benefits of technology

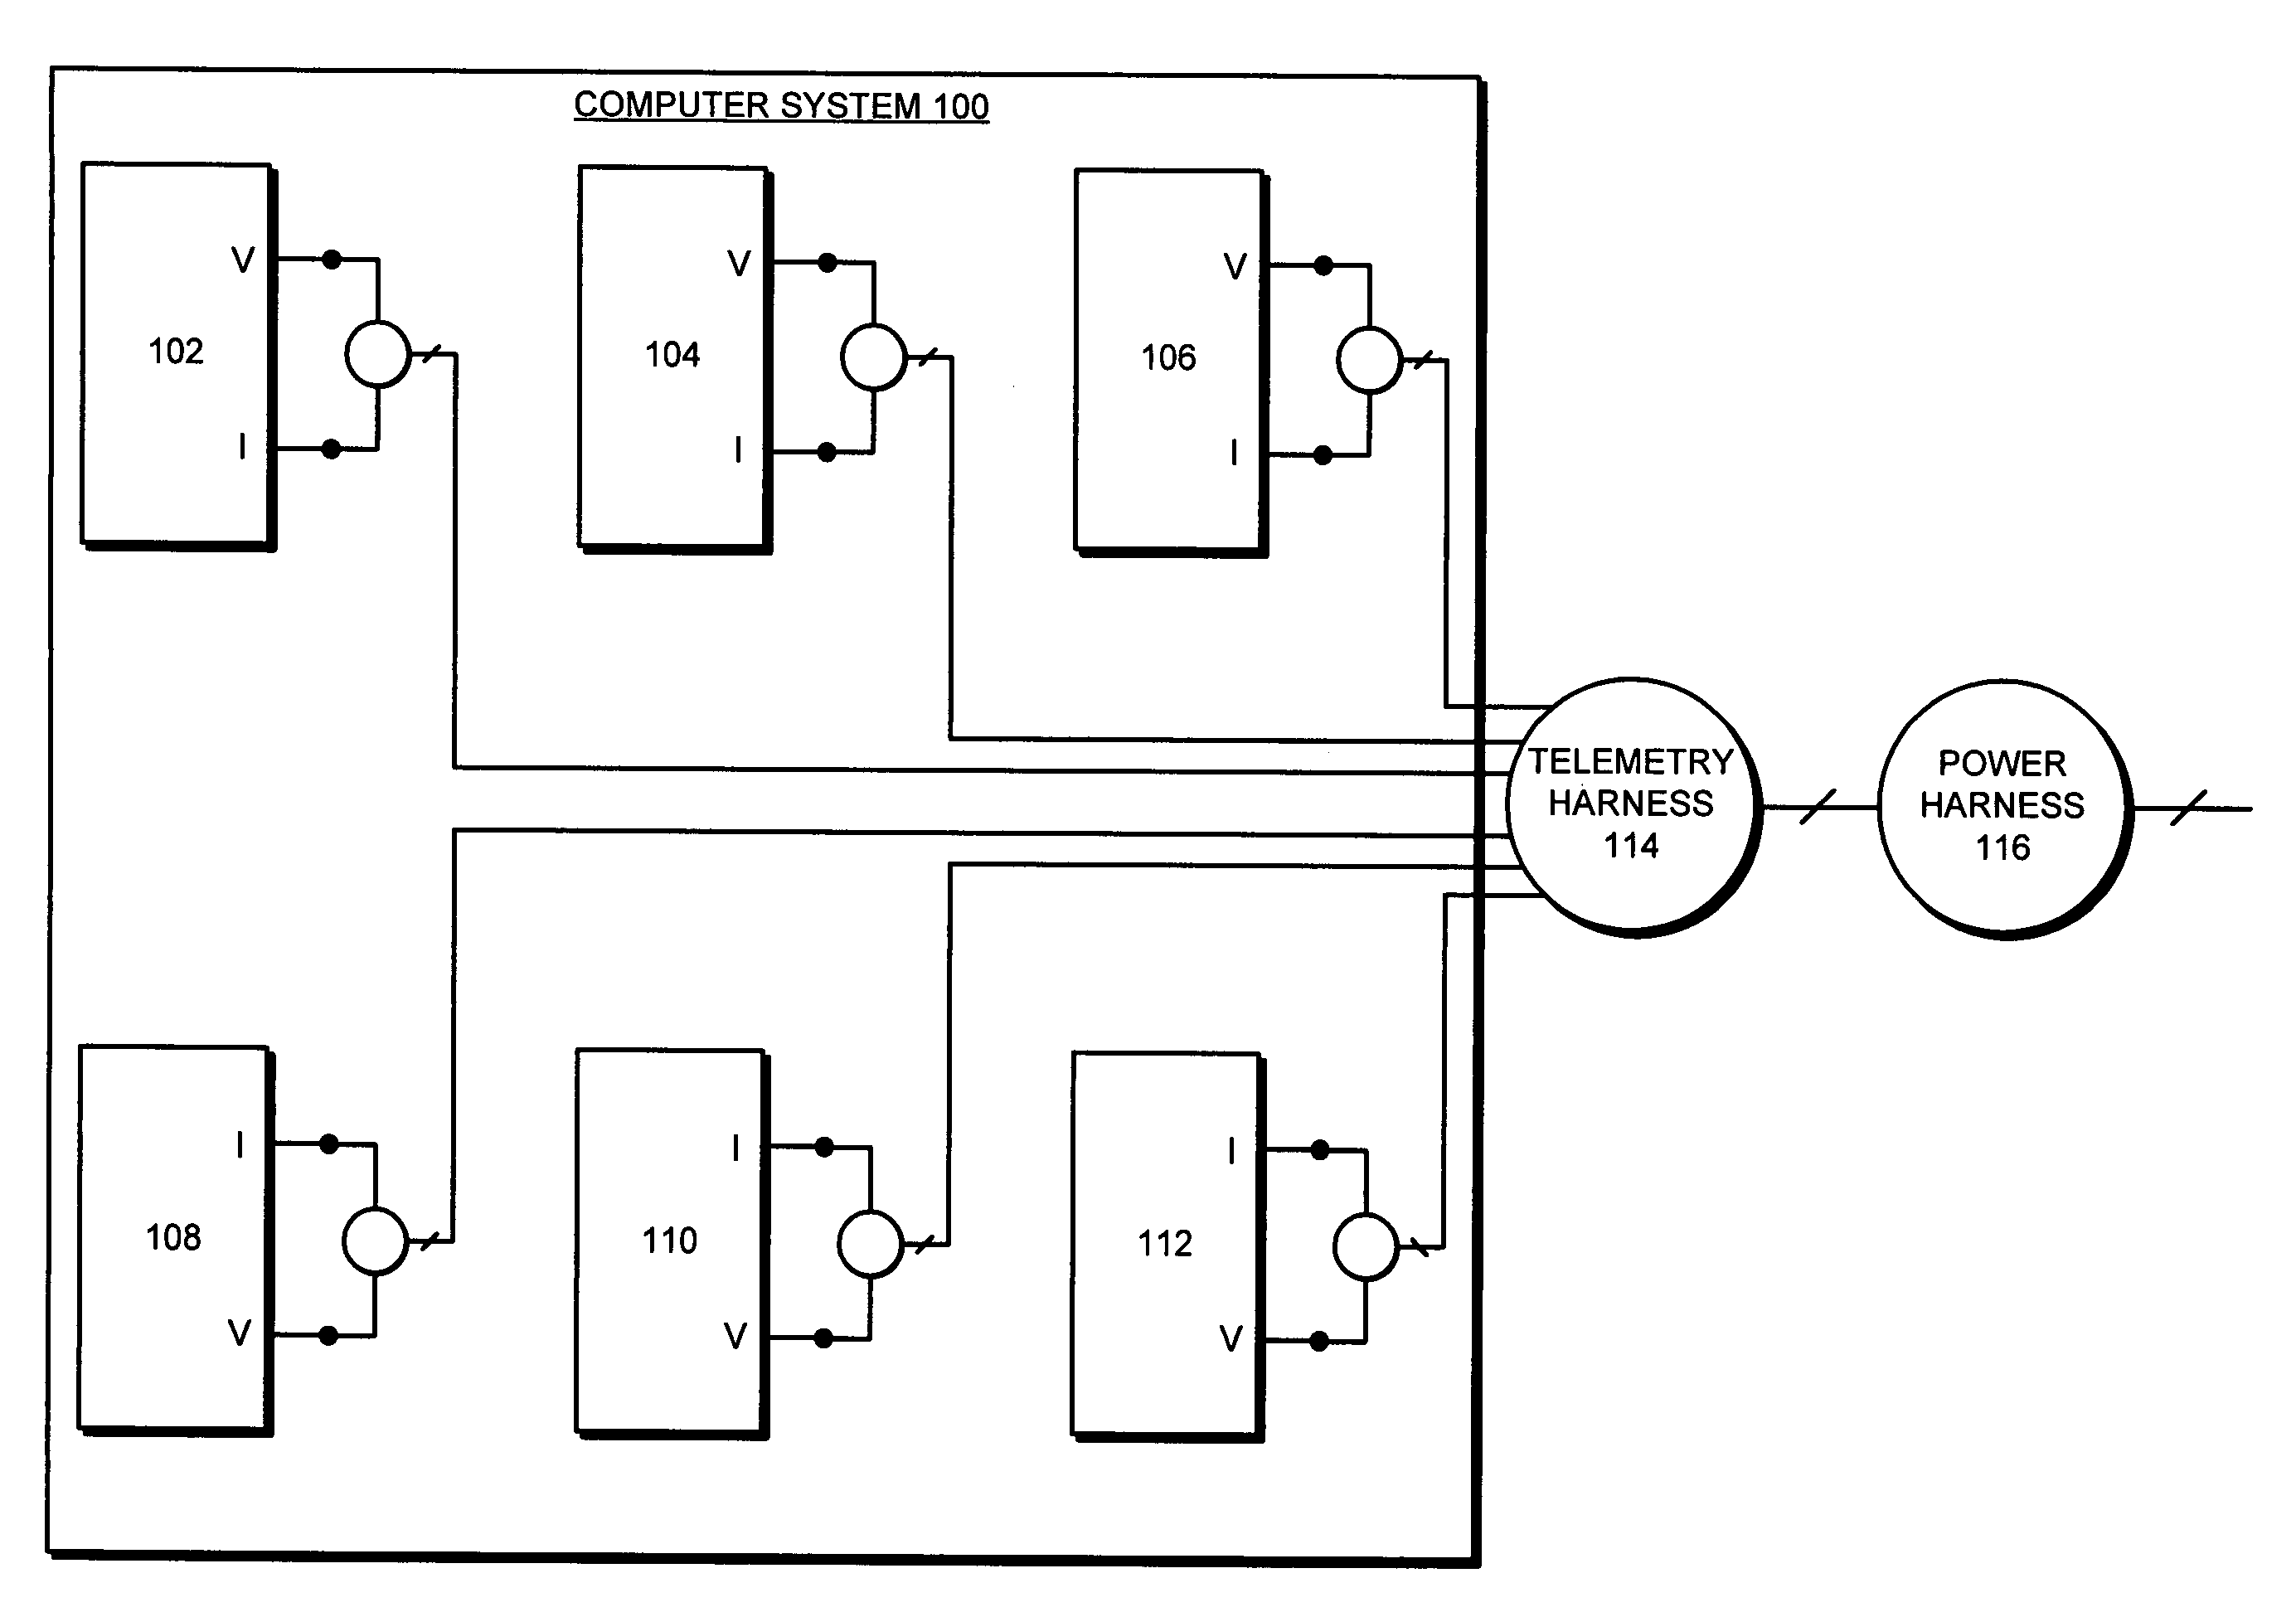
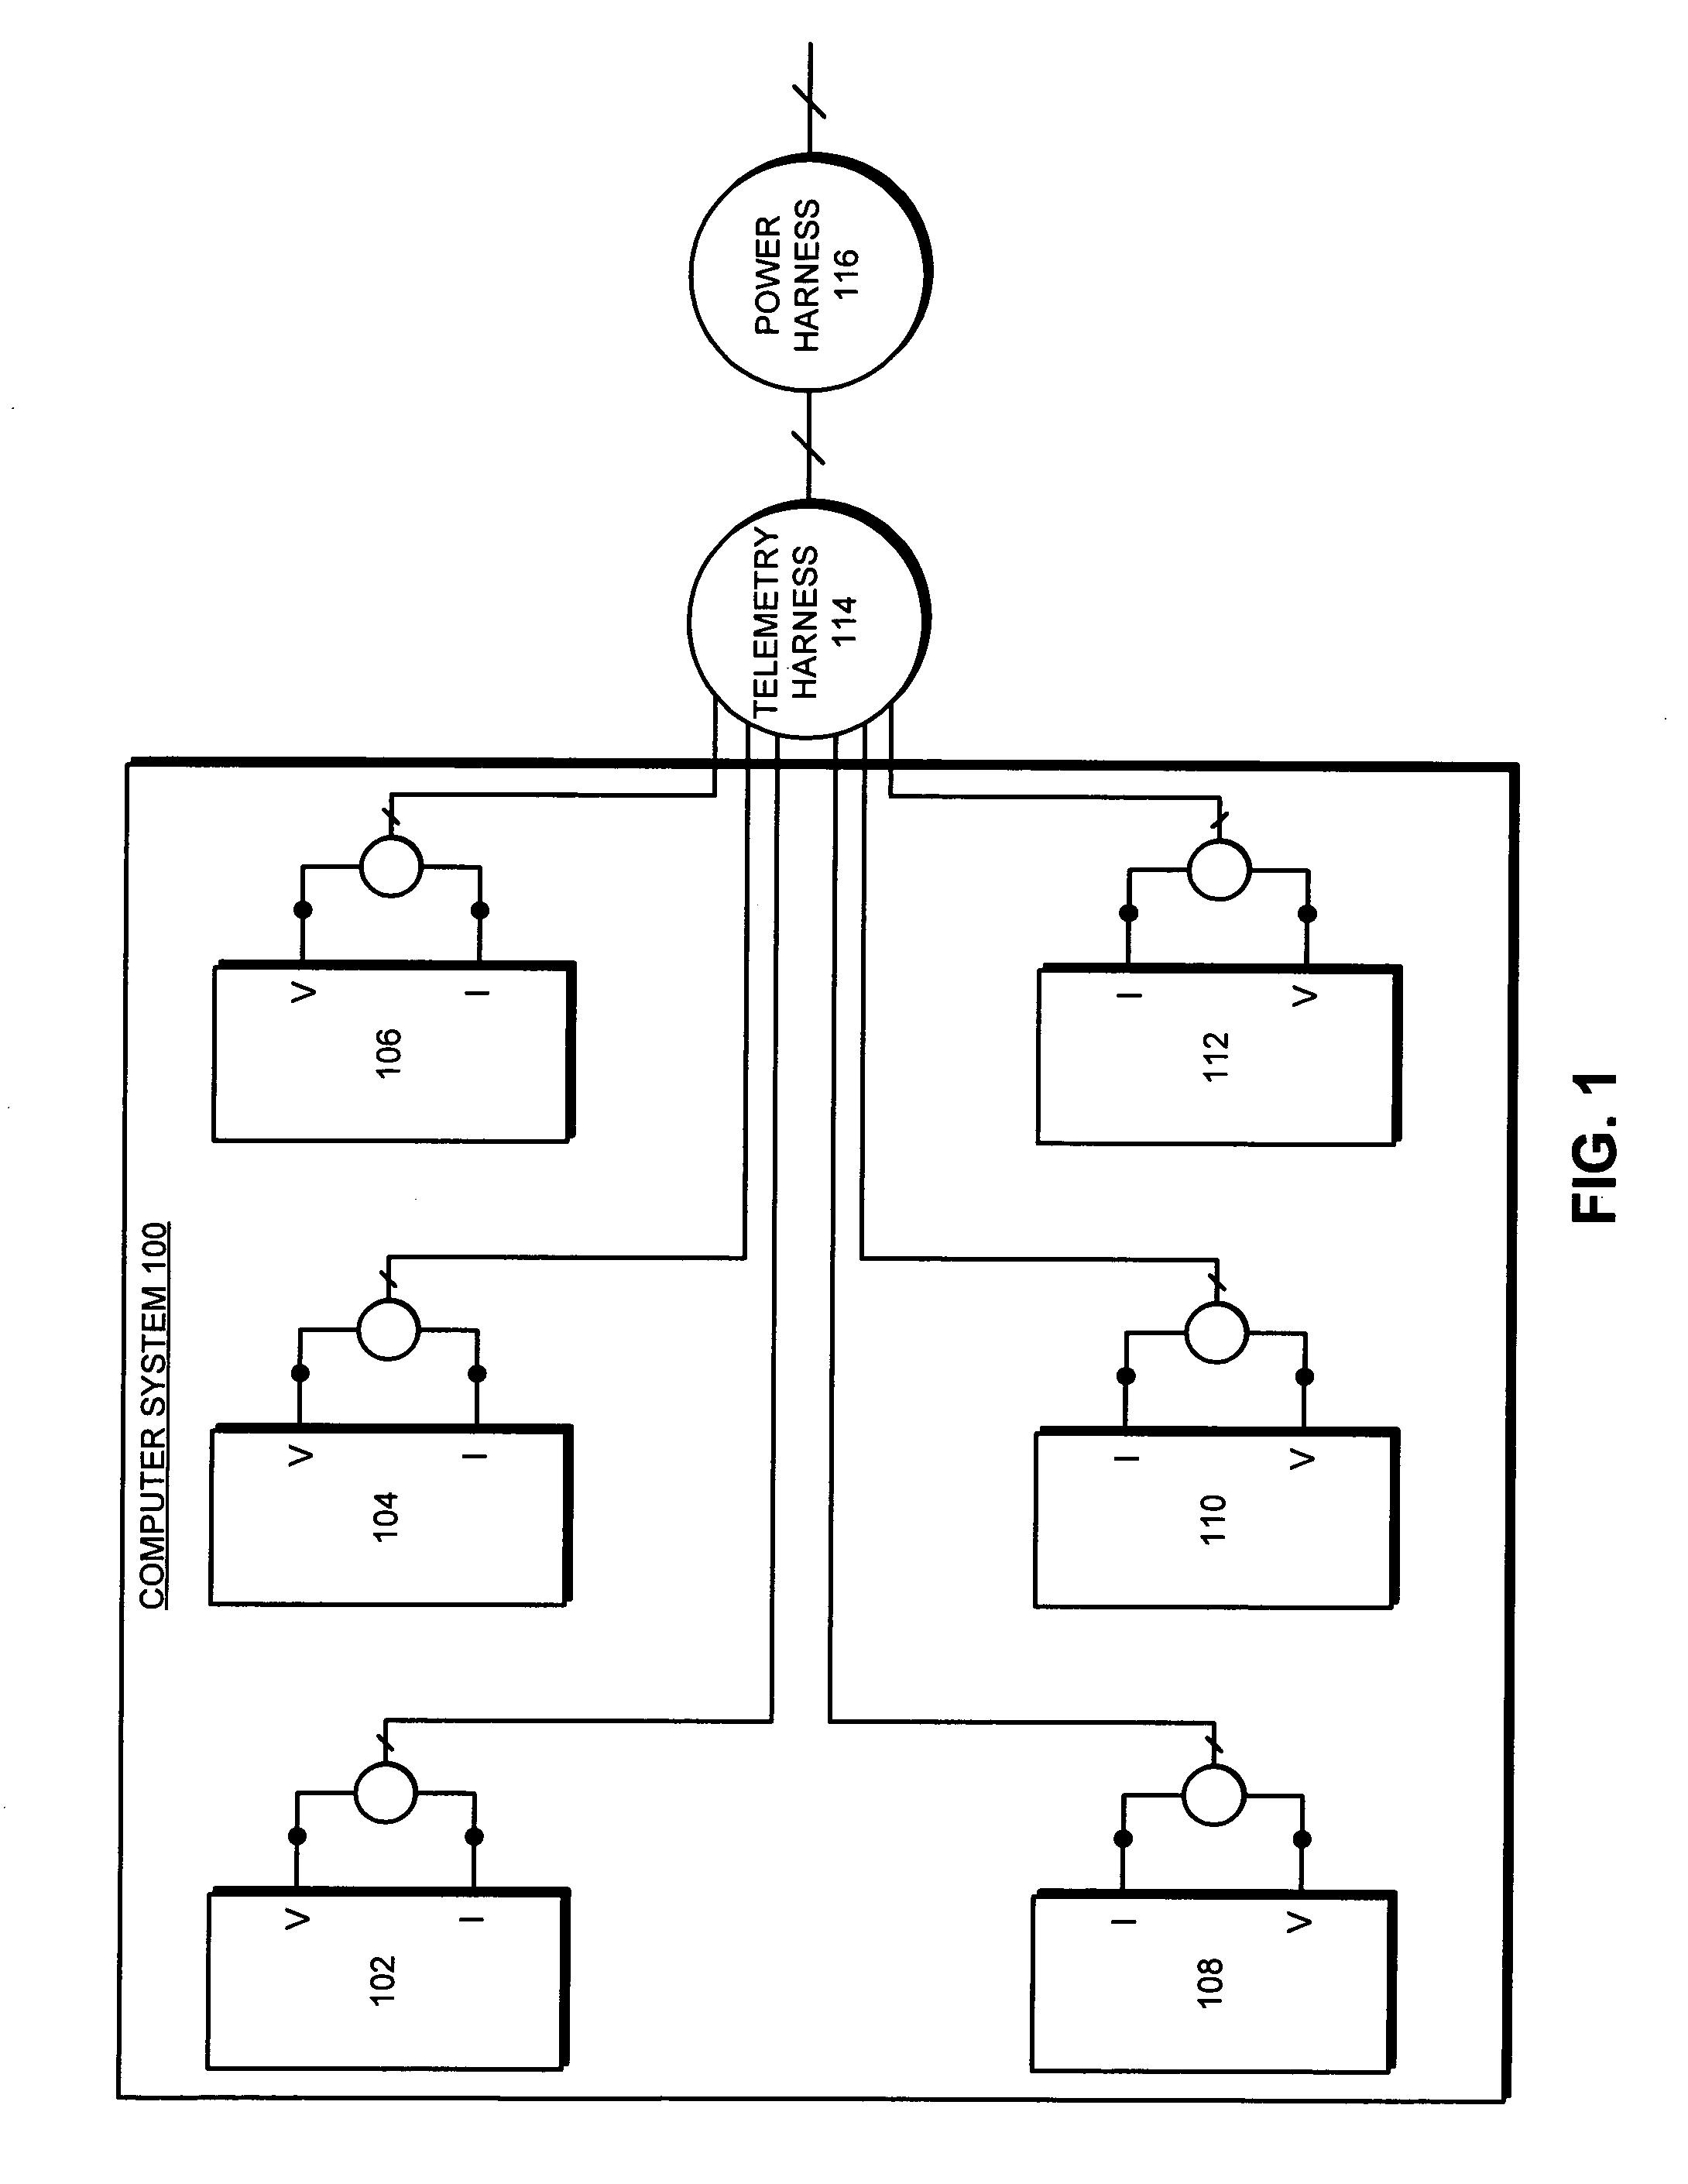
"The present invention provides a system that generates a dynamic power-flux map for a set of computer systems. This system uses RFID tags on the computer systems to automatically detect their location, and monitors various factors such as power consumption and temperature to determine their activity and balance power flux across a datacenter. The system can also modify physical attributes of the datacenter to further balance power flux and temperature. The inferential variables used for monitoring include signals from current and voltage sensors located within the computer systems. The technical effects of this invention include improved efficiency and reliability of computer systems in datacenters, as well as better overall performance and control over power distribution."

Problems solved by technology

Since excessive heat can cause premature failure of components within servers, providing sufficient cooling capacity to remove the heat generated by these servers is a primary concern for operators of these datacenters.
At the present moment, large datacenters typically over-provision cooling capacity.
Typically, the faceplate power rating is higher than it is possible to achieve because the faceplate power ratings are extremely conservative estimates of the maximum theoretically possible power consumption of the individual components and the field-replaceable units (FRUs) within a server.
Furthermore, average server utilization factors are low.
Unfortunately, a hardware power monitor is expensive, typically costing many thousands of dollars.
Furthermore, a hardware power monitor only measures the total power entering the server and hence cannot report on the power consumption of the individual components within the server.
A related challenge for datacenter operators is to balance the power flux and the temperature across a datacenter.
Large disparities between “hot” and “cold” zones within a datacenter can result in cooling inefficiencies, which can significantly increase datacenter electricity costs.
Furthermore, local “hot spots,” caused by an aggregation of computer systems or racks, can lead to poor long-term reliability of the computer systems located within the local hot spot.
Unfortunately, present techniques for generating a power-flux map for a datacenter are time-consuming and expensive.
Note that only measuring the temperature is not sufficient because it does not account for the rate of cool air being vented into the room.
Unfortunately, this technique requires manually taking temperature measurements within the datacenter and the use of complex CFD analysis, which is time-consuming and expensive.
This power-flux mapping can quickly become out-of-date if the load profiles of the computer systems within the datacenter change, or when computer systems are upgraded or reconfigured.
Although the robot can be configured to automatically travel along each aisle to collect temperature readings, this technique still requires the use of complex CFD analysis and further requires an expensive robot.

Method used


Image

  • Method and apparatus for generating a dynamic power-flux map for a set of computer systems
  • Method and apparatus for generating a dynamic power-flux map for a set of computer systems
  • Method and apparatus for generating a dynamic power-flux map for a set of computer systems

Examples


Embodiment Construction

[0031]The following description is presented to enable any person skilled in the art to make and use the invention, and is provided in the context of a particular application and its requirements. Various modifications to the disclosed embodiments will be readily apparent to those skilled in the art, and the general principles defined herein may be applied to other embodiments and applications without departing from the spirit and scope of the present invention. Thus, the present invention is not limited to the embodiments shown, but is to be accorded the widest scope consistent with the principles and features disclosed herein.

[0032]The data structures and code described in this detailed description are typically stored on a computer-readable storage medium, which may be any device or medium that can store code and / or data for use by a computer system. This includes, but is not limited to, magnetic and optical storage devices such as disk drives, magnetic tape, CDs (compact discs) ...


PUM


Abstract

A system that generates a dynamic power-flux map for a set of computer systems. During operation the system determines the locations of the computer systems. Next, the system receives dynamic traces of power consumption for the computer systems, wherein a dynamic trace of power consumption for a given computer system is generated based on dynamic traces of monitored inferential variables for the given computer system. The system then correlates the locations of the computer systems with the dynamic traces of power consumption for the computer systems, and generates the dynamic power-flux map for the set of computer systems based on the correlated locations and the dynamic traces for the computer systems.

Description

RELATED APPLICATION[0001]This application is related to a pending U.S. patent application, entitled “Real-Time Power Harness,” by inventors Kenny C. Gross, Kalyanaraman Vaidyanathan, Aleksey M. Urmanov, Keith A. Whisnant, and Steven F. Zwinger, having Ser. No. 11 / 195,014 and a filing date of 2 Aug. 2005. This pending application is hereby incorporated by reference.BACKGROUND[0002]1. Field of the Invention[0003]The present invention relates to techniques for determining power consumption for a set of computer systems. More specifically, the present invention relates to a method and apparatus for generating a dynamic power-flux map for a set of computer systems.[0004]2. Related Art[0005]Large businesses often maintain datacenters containing dozens or even hundreds of servers that provide various computational services. Since excessive heat can cause premature failure of components within servers, providing sufficient cooling capacity to remove the heat generated by these servers is a ...

Claims


Application Information

Patent Timeline
Patent Type & Authority Patents(United States)
IPC IPC(8): G06F1/32
CPCG06F1/3209
Inventor ZWINGER, STEVEN F.GROSS, KENNY C.DHANEKULA, RAMAKRISHNA C.
Owner ORACLE INT CORP
Learn More