Breath-based sensors for non-invasive molecular detection
a sensor and sensor technology, applied in the field of breath-based sensors for non-invasive molecular detection, to achieve the effect of simplifying the discussion
- Summary
- Abstract
- Description
- Claims
- Application Information
AI Technical Summary
Benefits of technology
Problems solved by technology
Method used
Image
Examples
example 1
Evaluation of Reproducibility
[0085]This example is directed to the evaluation of reproducibility of the time response curves for different fuel cells assembled as described herein.
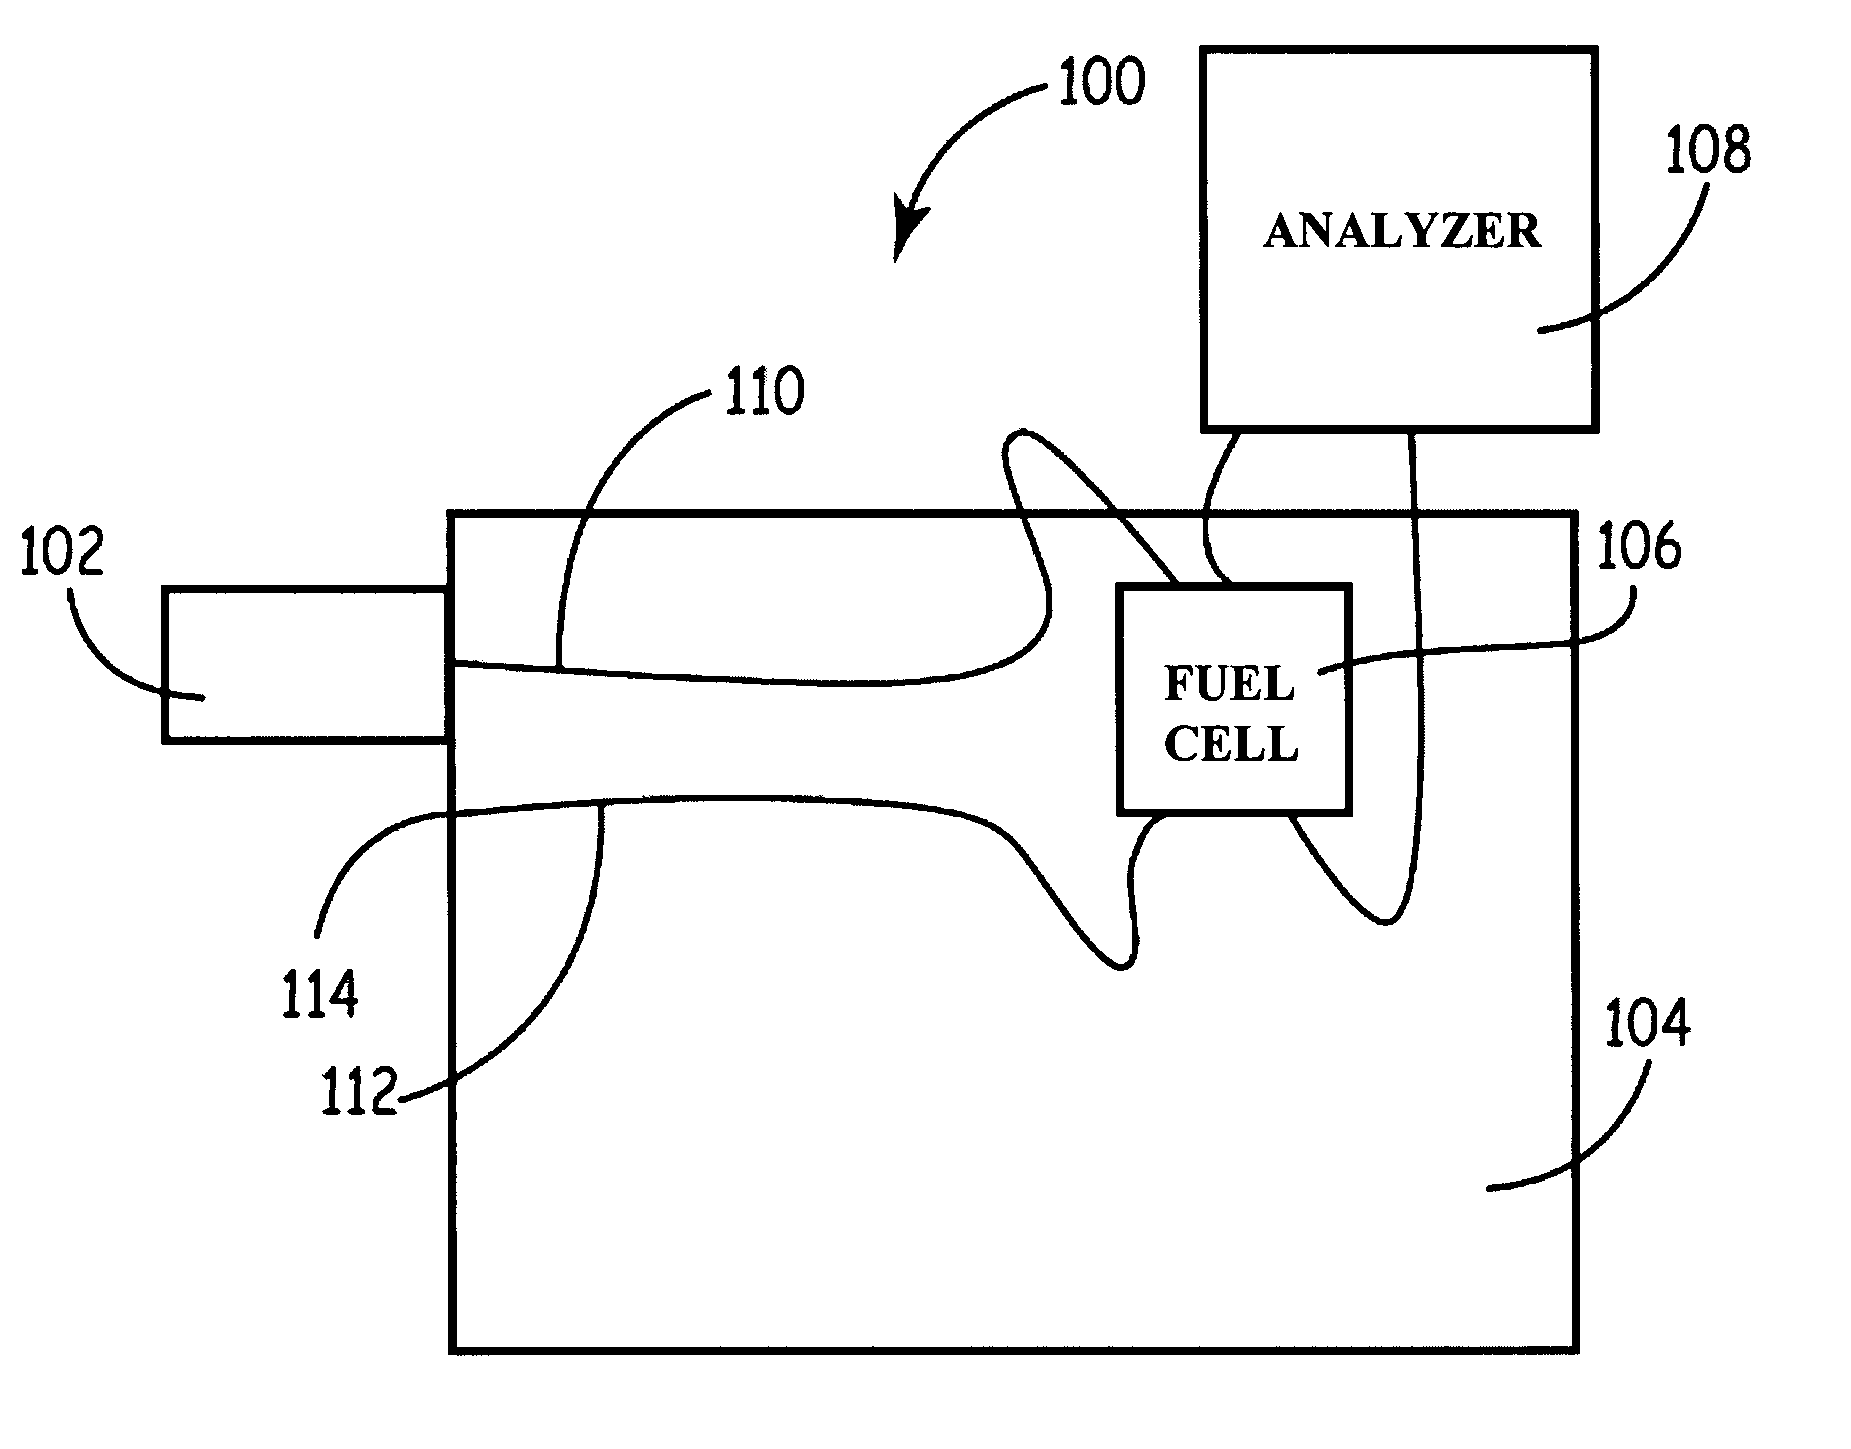
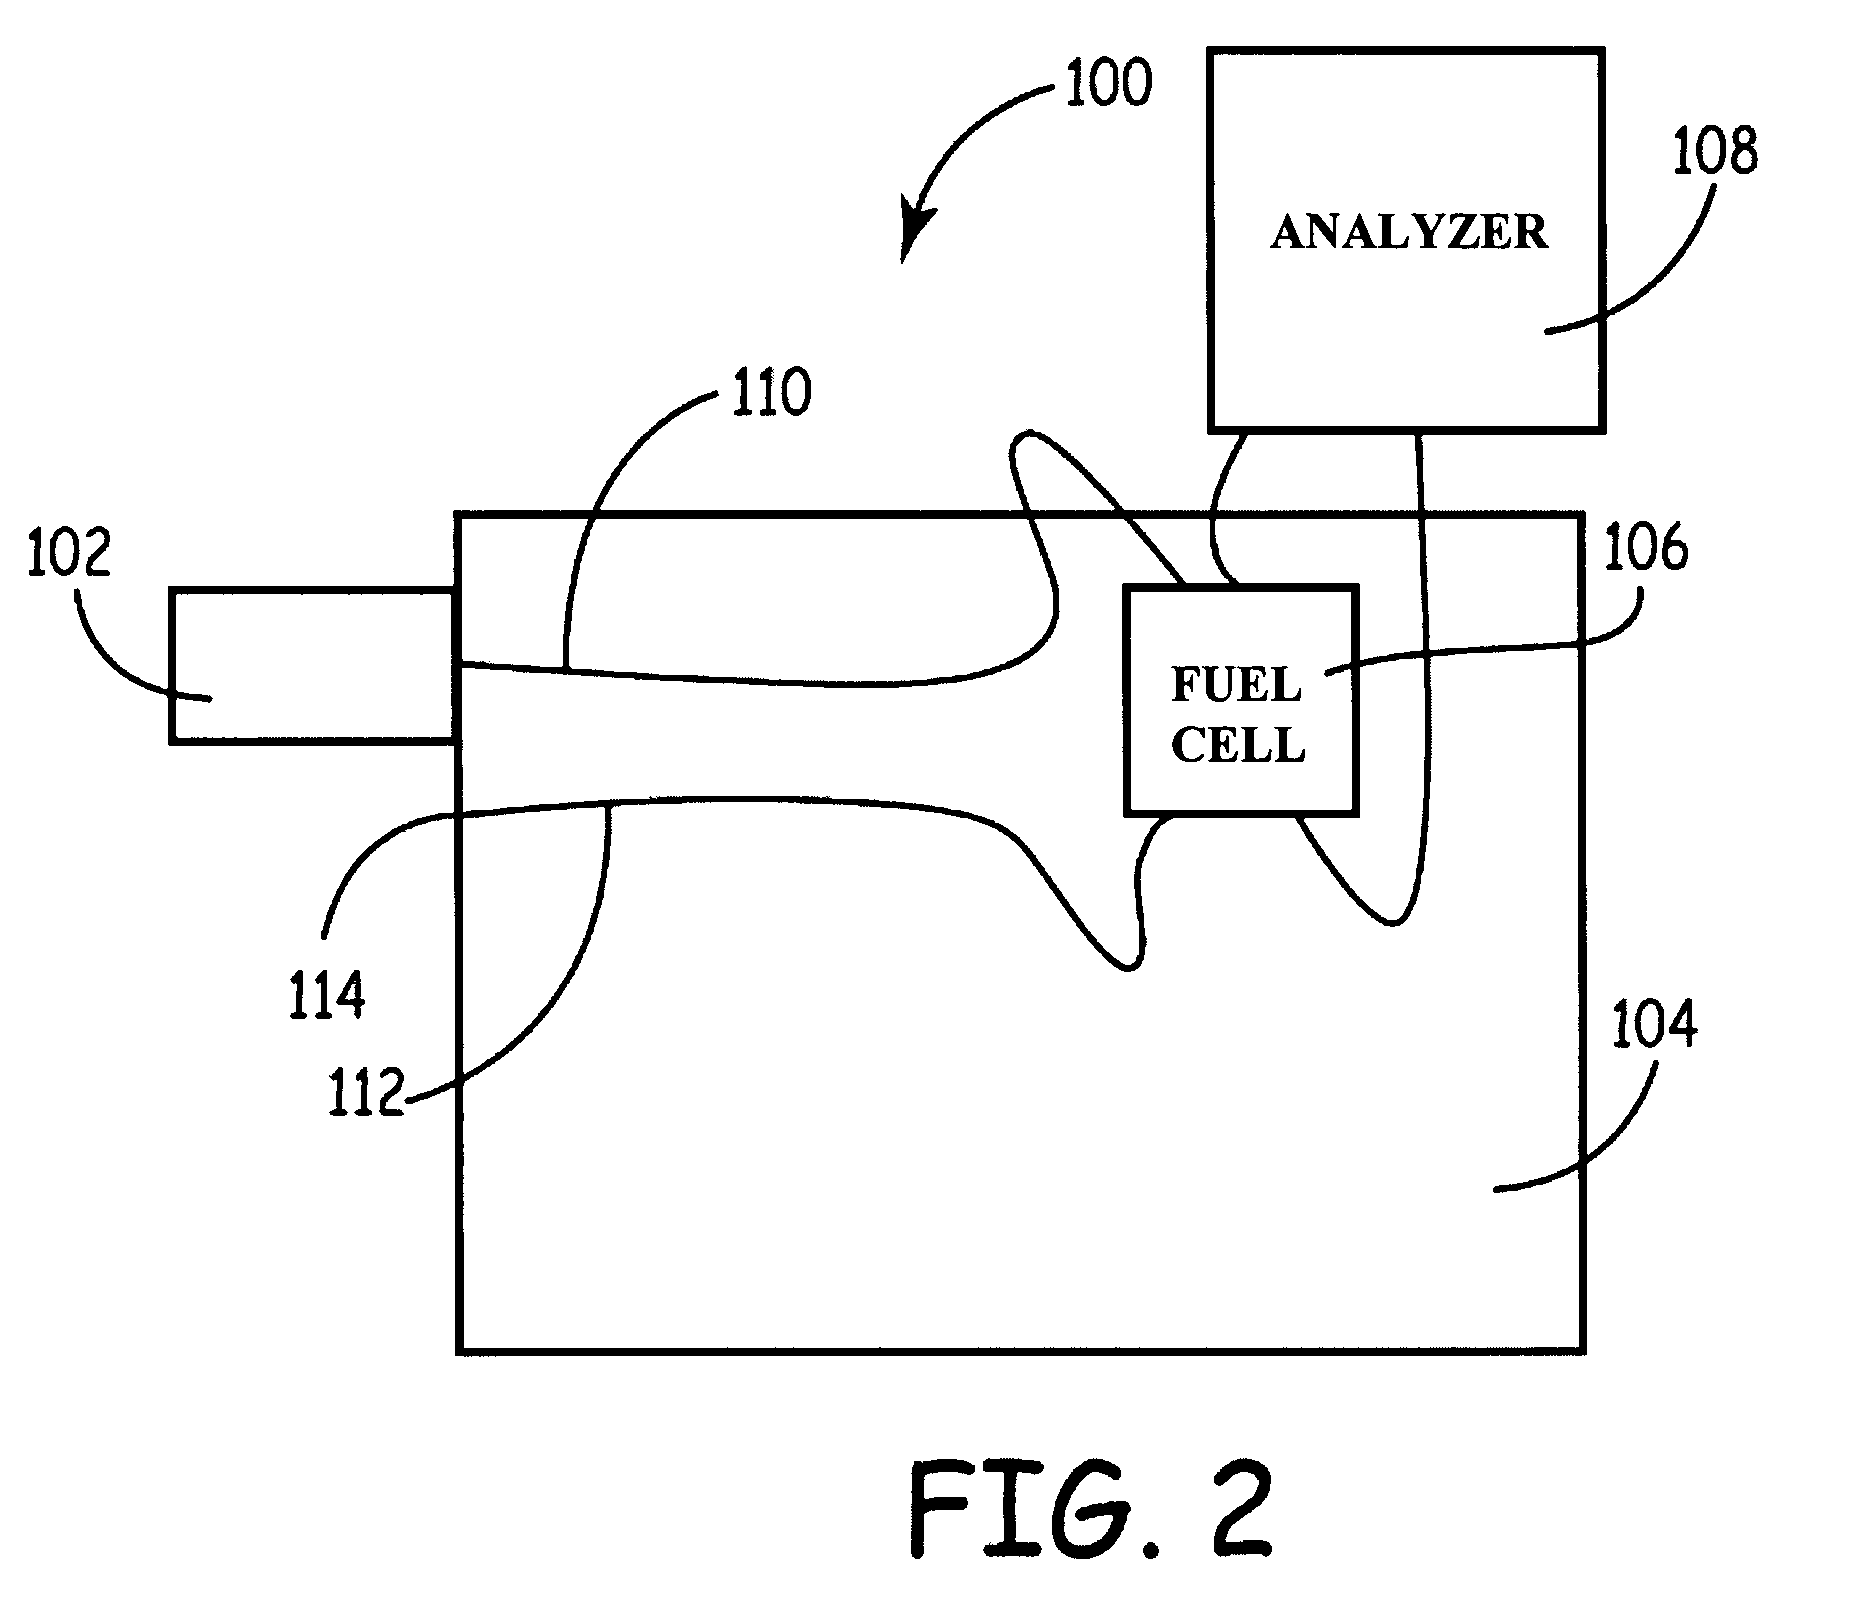
[0086]Three fuel cell test devices were constructed as described above. “Breath” samples were produced and introduced into each of the fuel cell test devices. The “breath” samples were generated using a Toxitest Breath Alcohol Simulator containing a 0.05 BAC standard solution. The solution was formed with a mixture of ethanol and water to simulate a blood sample and heated to 37° C. to simulate body temperature. Breath was bubbled through the solution to simulate a breath sample. A known quantity of the “breath” sample was introduced into the fuel cell of each fuel cell test device.
[0087]As depicted in FIG. 3, the shape of the amplified potential v. time curve is similar for all three fuel cells. However, the magnitude of the three curves are different, with fuel cell 1 having the largest magnitude, follow...
example 2
Cigarette Smoke Detection
[0088]This example is directed to the comparison of the breath of a non-smoker with the breath of a smoker after a twenty-four hour period without smoking.
[0089]Breath samples containing cigarette smoke from a single individual were introduced into a fuel cell test device as described above. The shape of the amplified potential v. time curve for each breath sample was similar, however, the magnitude of the curve decreased over time as the number of “clean” breaths after inhalation of the cigarette increased. In other words, the magnitude of the response to cigarette smoke is dependent on time. Referring to FIG. 4, the curve with the largest magnitude was from a breath sample taken after no clean breaths, while the curve with the smallest magnitude was from a breath sample taken after two clean breaths after a drag. The shape of the amplified potential v. time curve has been found to be consistent for at least one hour after a cigarette has been inhaled. Addi...
example 3
“Clean” Breath Samples
[0090]This example is directed to the comparison of the breath of a non-smoker with the breath of a smoker after a 24 hour period without smoking.
[0091]Clean breath samples were introduced from different individuals into a fuel cell test device as described above. Two of the individuals who provided breath samples were non-smokers, while the other individual was a smoker who had not inhaled a cigarette for about twenty-four hours prior to giving the breath sample. As depicted in the FIG. 5, the shape of the amplified potential v. time curve for all three individuals is similar. Thus, significant voltage, or response, is not detected by individuals who have “clean” breath.
PUM
| Property | Measurement | Unit |
|---|---|---|
| operating temperatures | aaaaa | aaaaa |
| temperatures | aaaaa | aaaaa |
| temperatures | aaaaa | aaaaa |
Abstract
Description
Claims
Application Information
 - R&D
- Intellectual Property
- Life Sciences
- Materials
- Tech Scout
- Unparalleled Data Quality
- Higher Quality Content
- 60% Fewer Hallucinations
Browse by: Latest US Patents, China's latest patents, Technical Efficacy Thesaurus, Application Domain, Technology Topic, Popular Technical Reports.
© 2025 PatSnap. All rights reserved.Legal|Privacy policy|Modern Slavery Act Transparency Statement|Sitemap|About US| Contact US: help@patsnap.com


